
The Application of the Tiangong-2 Wide-band Imaging Spectrometer
Data in the Ecological Environment Evaluation: A Case Study of
Kunming
Kang Liu
1,2, *
, Bangyong Qin
1,2
and Shengyang Li
1,2
1
Key Laboratory of Space Utilization;
2
Technology and Engineering Center for space Utilization, Chinese Academy of Sciences. 100094, Beijing, China.
Email: liukang@csu.ac.cn
Keywords: Tiangong-2; Wide-band Imaging Spectrometer data; Ecological environment evaluation
Abstract: As a new type of remote sensing data source, the Tiangong-2 image data have several advantages and can
be applied in various fields, of which one application is the ecological environment evaluation. In this study,
the ecological environment status in Kunming, a major city of “The belt and Road Initiative”, is performed
using data provided by the wide-band imaging spectrometer on Tiangong-2. The ecological environment
evaluation system is established based on The Criterion for Ecosystem Status Evaluation, in which the
vegetation coverage index, soil index and slope are used as the evaluation indicator. The ecological
environment status in Kunming is evaluated and classified into four grades including excellent, good,
medium and poor based on the “3S Technology”. The result shows that the ecological environment in
Kunming is good, of which 62.75% is excellent or good grade and distributed in the area with high
vegetation coverage, 30.84% is medium grade and distributed in the mountainous areas or the Dian Lake,
and 6.40% is poor grade and distributed in the north of Dian Lake or other built areas. Strengthening the
ecological protection and restoration of Dian Lake and its surrounding areas will help to improve the overall
ecological environment quality of Kunming.
1 INTRODUCTION
Tiangong-2 was launched in September 15, 2016,
carrying three earth observation loads, of which one
is the wide-band imaging spectrometer (MWI)
(Yang et al., 2017; Wen, 2016). So far a lot of
ground observation data have been obtained by
MWI. The data be used to monitor large-scale,
medium and large objects in ocean, land, and air. It
can be applied in various fields, such as land and
resources, agriculture and forestry applications,
hydrology and water resources, marine and coastal
research, etc. One important application of these
data in the field of ecological environment is the
ecological environment evaluation.
The ecological environment is the basis of all
living beings and human existence, providing
material support and ecological services for human
society (Zhao et al., 2013). The quality of ecological
environment is closely related to the sustainable
development of social economy (Chen, 2012; Zhao
et al., 2009) With the city development, the
contradiction between economic development and
ecological environment quality will be highlighted.
For example, the degradation of forest and grassland
is serious, soil erosion is aggravated, natural
disasters occur frequently, pollution is aggravated,
and the ecological environment is deteriorating (He
et al.,
2017; Deng et al., 2016; Li et al., 2016; Song
and
Xue, 2016). Considering the above situation,
ecological environment evaluation is very important.
The ecological environment evaluation is a
quantitative description and evaluation of the
advantages and disadvantages of the ecological
environment, which more accurately reflect the
status of the ecological environment and expose the
main environmental problems. It provides scientific
basis for the ecological protection and restoration
measures, the formulation of ecological environment
planning and the countermeasures of environment
management and control (Zhao et al., 2013; Cheng
et al., 2012). Ecological environment evaluation is of
great significance to the effective management and
sustainable development of regional ecological
Liu, K., Qin, B. and Li, S.
The Application of the Tiangong-2 Wide-band Imaging Spectrometer Data in the Ecological Environment Evaluation - A Case Study of Kunming.
In Proceedings of the International Workshop on Environment and Geoscience (IWEG 2018), pages 469-476
ISBN: 978-989-758-342-1
Copyright © 2018 by SCITEPRESS – Science and Technology Publications, Lda. All rights reserved
469

environment (He et al., 2017; Wang and Zhao,
2016)There are many methods of ecological
environment evaluation, which can be divided into
qualitative and quantitative evaluation. Quantitative
evaluation includes vulnerability calculation
method, distance calculation method, ecological
footprint method and comprehensive index method
(Guo and
Li, 2007; Rees, 1992; Bi and Hong, 2001). At
present, the comprehensive index method is widely
used and it refers to the reasonable evaluation of the
research area by selecting the appropriate evaluation
index and evaluation model. There are great
differences in the selection of the index system or
the weight distribution of the same index in the
understanding of the ecological environment or the
purpose of the study, which leads to differences in
the evaluation results of the same ecological
environment. As a result, different evaluations
cannot be directly compared. Adopting standardized
method, such as Technical Criterion for Ecosystem
Status Evaluation (HJ192-2015), can enhance the
comparability between results from various
researches. HJ192-2015 uses the comprehensive
index (Ecological index, EI) to describe the overall
state of the regional ecological environment. It
provides for the evaluation index system of
ecological environment status and the calculation
method of each index, which is suitable for
evaluating the status and changes of the ecological
environment of the county, provincial and ecological
areas. However, the indexes are difficult to obtain
and the data acquisition cycle is long. Besides, the
data sources are mostly obtained based on the
administrative area, which is difficult to meet the
requirements of the timeliness and refinement of the
evaluation unit. GIS and RS technology are used to
evaluate the ecological environment condition, to
process the remote sensing image data of the
evaluation area and extract the index data of the
evaluation, greatly saving the time and energy of the
data collection and management, improving the
timeliness of the evaluation results, increasing the
visibility of the results, and providing technical
support for the ecological environment evaluation.
Many researchers use remote sensing data to
evaluate ecological environment. For example,
researches are carried out on ecological environment
evaluation in the Quanzhou Bay area, Kunming
Chenggong District, Yanhe watershed and Longkou,
respectively (He et al.,
2017; Li et al., 2016; Wang
and
Zhao, 2016; Gan et al., 2016). With the growing
maturity of remote sensing (RS), the EI index can be
relatively easy to obtain and the result can be well
visualized (Song and
Xue, 2016; Li et al., 2007;
Gupta et al., 2012; Yan, 2017).
In this paper, Tiangong-2 MWI image, as a new
domestic remote sensing data source, is used for the
ecological environment evaluation in Kunming.
Referring to Technical Criterion for Ecosystem
Status Evaluation (HJ192-2015) (Rees,
1992), and
combining the characteristics of Kunming's eco-
environment, the evaluation factors are extracted
with RS and EI is calculated to evaluate of the
ecological environment condition in Kunming. This
paper quantitatively analyses and evaluates the
ecological environment in Kunming, which can
provide the basis for the scientific ecological
protection and restoration of this city, as well as
promote the "The Belt and Road Initiative"
ecological construction.
2 MATERIALS AND METHODS
2.1 Study Area
Kunming (102°10 'E~103°40' E, 24°23 'N~26°22'
N) is located in the central area of the lake basin
group in the central Yunnan Province, which is in
the central part of Yungui Plateau in Southwest
China. Kunming is south to Dian Lake and is
surrounded by mountains on three sides. It is
dominated by Plateau hilly landforms (
Tang, 2017;
Yang
et al., 2001).
Kunming is a frontier and portal of China facing
Southeastern Asia, Southern Asia, the Middle East,
southern Europe and Africa. As an important city
along the Belt and Road, Kunming has a unique
geographical advantage, connecting to the coastal
areas through Guizhou Province on the East, to India
and Pakistan through Myanmar on the west, to the
Central Plains of the China through Sichuan
Province and Chongqing on the north, and to
Thailand and Cambodia through Vietnam and Laos
on the south.
Kunming is dominated by low north latitude
subtropical-plateau monsoon climate, with the
average annual temperature of 14.7 Celsius degree
and the average annual precipitation of 1011.2mm
(Zhao
et al., 2013). It has jurisdiction over 7
municipal districts, 1 county-level city, 3 counties
and 3 autonomous counties. Its permanent
population is 6.728 million. There are three main
lakes, which is the Dian Lake, the Yangzonghai
Lake and the Qingshuihai Lake. Kunming’s
vegetation type is the Evergreen broad-leaved forest
IWEG 2018 - International Workshop on Environment and Geoscience
470

in the Northern Subtropical Zone and it has
significant characteristics of biodiversity (Zhao
et al.,
2013).
2.2 Data Source and Data Preprocessing
In this paper, a new generation of domestic remote
sensing image data, Tiangong-2 Wide-band Imaging
Spectrometer (MWI) images, are used as the data
source. As a new generation of wide band remote
sensor, the Wide-band Imaging Spectrometer on
Tiangong-2 has a wide FOV (Field of View) and
combination of image and spectrum. It integrates
visible and near infrared, short wavelength infrared
and thermal infrared spectrums in one instrument.
Detailed data descriptions are listed below in Table
1.
In this study, MWI images and ASTER GDEM
(90m) are selected as data source. The remote
sensing image of Kunming in March 22,
2017(Figure 1, data source: Space application data
promoting service platform for china Manned Space
Engineering, http://www.msadc.cn/) is selected as
the data source and the vegetation coverage index
and soil index are extracted. The slop is extracted
using ASTER GDEM (90m) data (Data
source:NASA).
2.3 Evaluation Method
In this study, the Technical Criterion for Ecosystem
Status Evaluation (HJ192-2015) is taken as a
reference (Rees,
1992). In accordance with the
principle of representativeness, simplicity and
applicability, as the basic elements of vegetation,
soil and topography, the data of vegetation coverage,
bare soil vegetation index (GRABS) (
Yang et al.,
2001) proposed by Yang Cunjian et al. and slop are
selected as the key factors. After the normalization
of these factors, the EI(Ecological Index, 0~100)was
obtained through weight calculation. Finally,
according to the EI, the ecological environment of
Kunming was evaluated and analyzed.
Firstly, the FLAASH atmospheric correction for
Tiangong-2 MWI is performed with the help of
ENVI and the image is cut using the vector
boundary of Kunming.
Table 1: Data index of Tiangong-2 MWI.
Index Visible Near Infrared Short Wavelength Infrared Thermal Infrared
spectral range(μm) 0.4~1.0 1~1.7 8~10
numbers of channels 14 2 2
Channel range(μm)
V1:0.970~0.990
V2:0.930~0.950
V3:0.895~0.915
V4:0.845~0.885
V5:0.810~0.830
V6:0.740~0.760
V7:0.6775~0.6875
V8:0.655~0.675
V9:0.610~0.630
V10:0.555~0.575
V11:0.510~0.530
V12:0.480~0.500
V13:0.433~0.453
V14:0.403~0.423
S1:1.23~1.25
S2:1.63~1.65
T1:8.125~8.825
T2:8.925~9.275
spatial resolution(m) 100 200 400
swath(km) 300 300 300
The Application of the Tiangong-2 Wide-band Imaging Spectrometer Data in the Ecological Environment Evaluation - A Case Study of
Kunming
471

Figure 1: True color synthetic image of Tiangong-2
MWI(RGB=band8/10/12).
Then, benefiting from the IDL Language
Programming System, this paper summaries an
approach for Tiangong-2 MWI data processing and
application in light of the ENVI remote sensing
software, which provides a band match instrument
to the calculation of VC and NDVI indexes.
The vegetation coverage (VC) was calculated
with NDVI:
min
max min
NDVI NDVI
VC
NDVI NDVI
−
=
−
(1)
48
48
VV
NDVI
VV
−
=
+
(2)
NDVI is the normalized difference vegetation
index (NDVI). NDVI
max
and NDVI
min
is the
maximum and minimum NDVI value of the region,
respectively. V4 and V8 is band 4 and band 8 of
visible near infrared of Tiangong-2 MWI,
respectively.
The bare soil vegetation index is calculated as:
0.09178 5.58959GRABS VI BI=− ×+
(3)
VI, BI are the green index and soil brightness
index of tasseled cap transformation respectively,
which are calculated with the help of Tasseled Cap
tools of ENVI5.1.
Based on ASTER GDEM (90m), the splicing
and projection are firstly carried out, and the
samples are resampled as 100m, which is consistent
with the data of MWI. Then, the slop information is
extracted with the help of the Topographic Modeling
tool of the ENVI5.1.
The EI is calculated through weight and the
weights of different factors are determined by
Analytic Hierarchy Process (AHP). The evaluation
matrix is constructed by using the 1-9 scale method,
and the weight values of the indexes are calculated
and the consistency of matrix is checked with
MATLAB.
Table 2: Judgment matrix.
Sv Ss St weight
Sv 1 4 6 0.7
Ss 1/4 1 2 0.2
St 1/6 1/2 1 0.1
Consistency test results show that λmax=3.0092 ,
C.I.=0.0046 , C.R.=0.0088 <0.1, which has
satisfactory consistency.
123vst
EI W S W S W S=×+×+×
(4)
S
v
, S
s
and S
t
are the vegetation coverage factor,
soil factor and topographical factor, respectively. W
1
,
W
2
and W
3
are corresponding weight coefficients
which are set as 0.7, 0.2 and 0.1.
Finally, the EI index results are divided into 4
grades by Natural Breaks with ArcGIS10.0, and the
visual display of pixel level is carried out(
Zhang,
2014).
3 RESULTS
3.1 Ecological Environment Evaluation
in Kunming
Using the RS method, the vegetation factor
(vegetation coverage index), soil factor (bare soil
index) and topographic factor (slope) were obtained,
as shown in Figure 2.
Figure 2: Results of evaluation factor (a. vegetation factor
b. soil factor c. topographic factor).
Figure 2-a is the result map of vegetation factor.
The higher vegetation coverage is, the better the
quality of eco-environment is. The dark color areas
IWEG 2018 - International Workshop on Environment and Geoscience
472
stand for woodland, where the vegetation coverage
is high. The light color area in southwestern
Kunming is Dian Lake. The light color area to the
northeast of Dian Lake is the construction zone,in
which the vegetation coverage is low. In the
northern light color area, the vegetation coverage is
also very low due to snow cover.
Figure 2-b is the result map of soil factor. This
index is a linear combination of the greenness index
and the soil brightness index. It reflects the soil nude
condition well. The higher the degree of soil
exposure is, the
greater the risk of erosion and
degradation would be and the worse the quality of
the ecological environment is. The dark color areas
of the map are water areas with no vegetation. The
darker of the other area means higher the soil
exposure and worse the quality of the ecological
environment.
Figure 2-c is the result map of the topographical
factor. The greater the slop is, the higher the risk of
landslide and debris flow would be. The index can
reflect the ecological risk in the study area to a
certain extent. The dark color area in the northern
part of the map is mountainous, where the slop is
large, and the light color area in the south is water
area, town and so on, where the slop is very small.
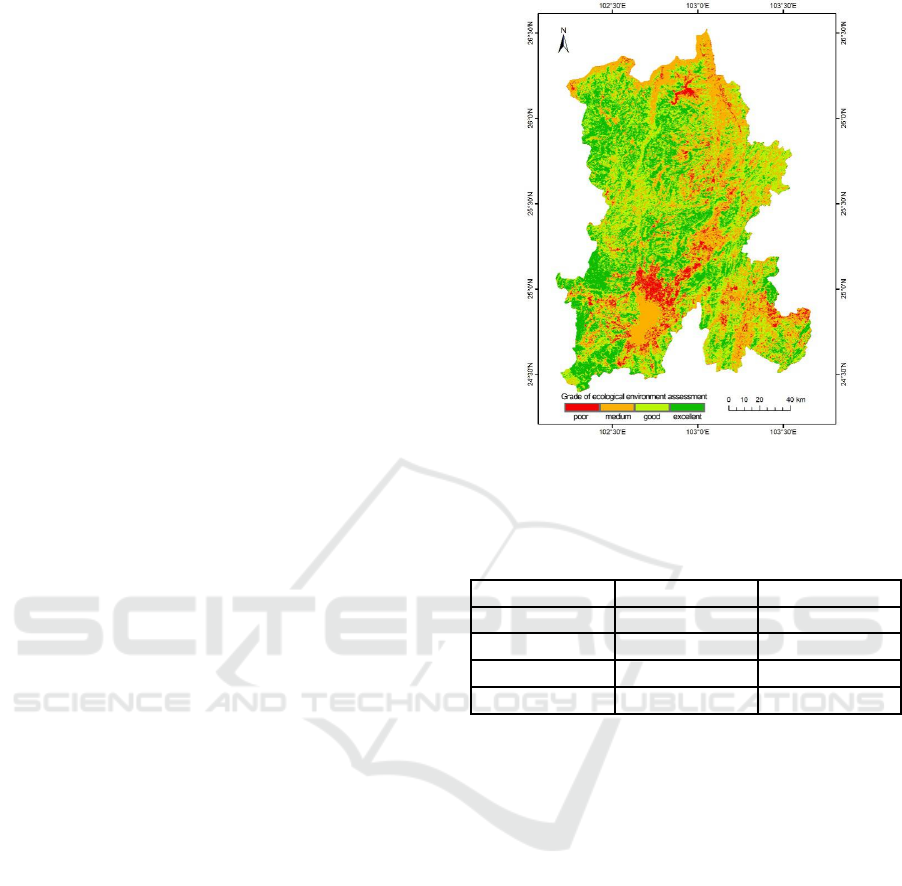
Figure 3 is a result map of the ecological
environment evaluation of Kunming, which is
weight calculated with the normalized vegetation
coverage factor, soil factor and topographical factor.
The ecological environment status of the study area
is divided into four grades: excellent, good, medium
and poor. The total area of the excellent grade is
5600 km
2
, which is 26.62% of the whole area. These
areas are widely distributed in Kunming with high
vegetation coverage. The areas with good ecological
environment are distributed in areas with lower
vegetation coverage or lower slop, whose total area
is 7600.58km
2
, accounting for 36.13% of Kunming.
The region with medium ecological environment
covers an area of 6487.02km
2
, which contributes to
30.84% of Kunming, mainly distributed to Dian
Lake and the northern mountainous region with a
relatively low vegetation coverage and high slop. It
has a fragile ecological environment and is
vulnerable to the rain erosion. The ecologically poor
region is mainly distributed in the downtown
northeast to the Dian Lake and other human
dominant areas with its total area of 1347.03 km
2
,
which is 6.4% of Kunming.
Figure 3: The results of ecological environment evaluation
in Kunming
Table 3: Statistics of ecological environment evaluation
results
Level Area/km
2
Percentage/%
Excellent 5600.58 26.62
Good 7600.58 36.13
Medium 6487.02 30.84
Poor 1347.03 6.41
3.2 Ecological Environment Evaluation
in Various Counties and Cities of
Kunming
There are 14 districts / counties in Kunming. The
ecological environment status of 14 districts /
counties is statistically analyzed, and the results of
ecological environment evaluation of each district /
county are obtained (Figure 4). The regions with an
excellent ecological environment, whose area is
1671.1km
2
, accounting for 29.83% of Kunming, are
mainly distributed in Luquan Autonomous County
for Yi and Miao Nationality. The regions with good
ecological environment are mainly distributed in
Luquan Yi and Miao Autonomous County and
Xundian Hui Autonomous County, whose area are
1692.26 km
2
and 1524.78 km
2
, accounting for 22.26%
and 20.06% respectively. The regions with medium
ecological environment are located in Xundian Hui
and Yi Autonomous County and Dongchuan District,
with the area of 1226.71 km
2
and 1048.32 km
2
,
accounting for 18.91% and 16.16% respectively.
The Application of the Tiangong-2 Wide-band Imaging Spectrometer Data in the Ecological Environment Evaluation - A Case Study of
Kunming
473
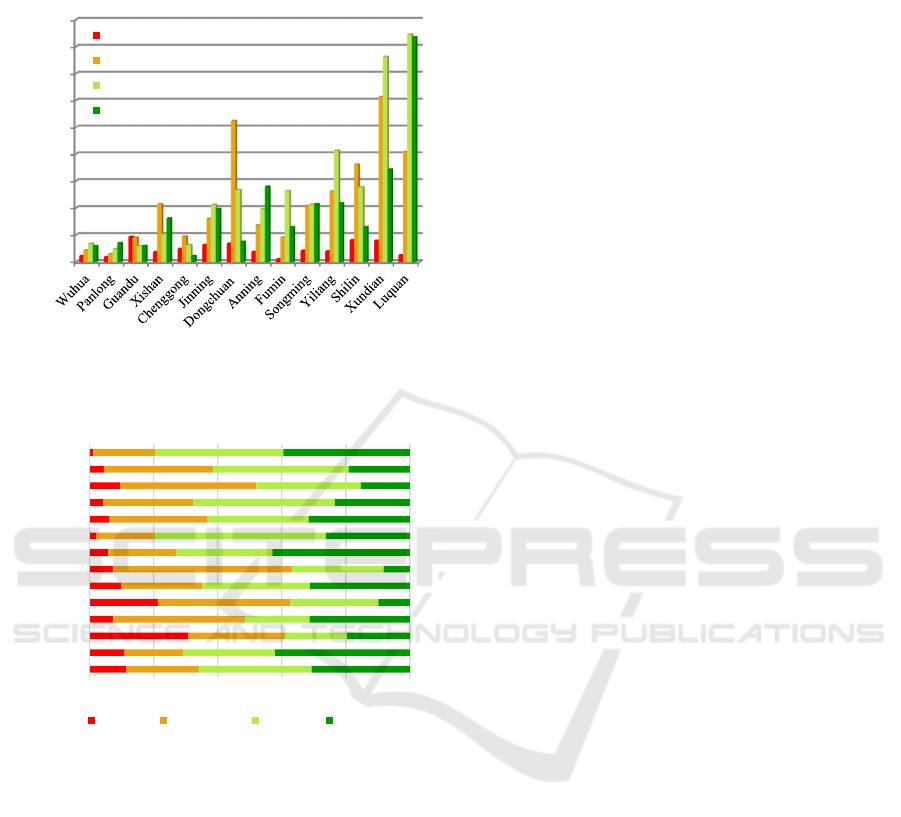
The regions with poor ecological environment are
mainly distributed in Guandu district and other
central urban areas.
Figure 4: Evaluation results of ecological environment in
various districts / counties of Kunming.
Figure 5: Percentage accumulation chart of ecological
environment in various districts / counties of Kunming.
Each district / county was calculated to get the
percentage accumulation chart of the ecological
environment status (Figure 5). The district / county
ecological environment is good as a whole, the
numbers of district/county with more than 60%
excellent and good ecological environment area is 9.
They are Fumin County, Luquan Yi and Miao
Autonomous County peace counties, Panlong
District, Yiliang County, Wuhua District, Jinning
District, Xundian Hui and Yi Chongming County
Autonomous County and the proportion were
79.47%, 79.39%, 73.06%, 70.88%, 67.65%, 65.82%,
64.70%, 63.13% and 61.46%, respectively. The
ecological environment status of Xishan District,
Shilin Yi Autonomous County, Guandu District,
Chenggong county and Dongchuan area is relatively
poor, and the ratio of excellent and good is less than
60%. Among them, the ecological environment in
Guandu and Chenggong is more severe, and the
regions with poor ecological status account for
30.85% and 21.36% . Guandu and Chenggong
District, as the downtown area of Kunming, have
large population density, large proportion of urban
construction land, and great difficulty in ecological
environment control. Therefore, the ecological
environment of the two area is less than the
surrounding area / county, ignoring the effect of the
different ecological function zoning on the results.
With the "The Belt and Road Initiative"
development, bring some pressure to the ecological
construction. At the same time of economic
development and urban construction, we need to
strengthen the control of ecological environment,
increase the rate of urban greening, strengthen the
management of water bodies, and continue to
maintain a good level of ecological environment.
4 DISCUSSION
Tiangong-2 Space Laboratory is the first real
laboratory in China (
Wen,
2016
). A number of
cutting-edge science and technology development
strategy of high science and application tasks was
undertaken in Tiangong-2 Space Laboratory,
including a number of scientific experiments and
testes, as well as validation system of new
technologies(Wen,
2016
). Tiangong-2 Space
Laboratory has carried out a number of new space
applied load equipment and more than ten
applications and experiments, which are related to
earth observation and space science, space
astronomy, microgravity basic physics, microgravity
fluid physics, space materials science, space life
science, space environment, space physics,
etc.(
Yang
et al., 2017
). There are three instruments
for the study of earth observation and space science,
including Wide-band imaging spectrometer, Three-
dimensional imaging microwave altimeter and
Multi-band ultraviolet edge imaging
spectrometer(
Qin
et al., 2017;
Kong
et al., 2017
). The
Wide-band Imaging Spectrometer data is the first
combination of visible and near infrared, shortwave
infrared , thermal infrared and polarization push-
scan imaging system on the single instrument in the
world for the first time, and it can achieve the
observation of the ocean, land and atmosphere(
Wen,
2016;
Yang
et al., 2017;
Qin
et al., 2017
). Besides, it
has characteristics of wide swath (300km), high time
0
200
400
600
800
1000
1200
1400
1600
1800
area / km
2
poor
medium
good
excellent
0% 20% 40% 60% 80% 100%
Wuhua
Panlong
Guandu
Xishan
Chenggong
Jinning
Dongchuan
Anning
Fumin
Songming
Yiliang
Shilin
Xundian
Luquan
poor medium good excellent
IWEG 2018 - International Workshop on Environment and Geoscience
474

resolution (the same area can be covered once in 2-3
days) and high spectral resolution (18 bands; VNI:
14 bands with the range of 0.4~1.0μm; SWI: 2 bands
with the range of 1~1.7μm; INF: 2 bands with the
range of 8~10μm). In comparison, Landsat 8 OLI, as
a common data source in the field of ecological
environment, has a swath of 185km and 11 bands,
and its revisit interval is 16 days. The wide-band
imaging spectrometer is an important innovation,
and the sensed images have been used as data source
in some researches about the monitoring of coastal
areas (
Liu et al., 2017). Its data need to be explored
and verified in the other fields, such as ecological
environment, lake monitoring, agroforestry, etc. It is
the first time for the Wide-band imaging
spectrometer data to be used in the ecological
environment evaluation and its application potential
of the new type of domestic load in the ecological
environment is explored.
In this study, three elements of vegetation, soil
and terrain were selected to evaluate the ecological
environment, and the characteristics of the study
area and the availability of data were taken into
consideration in the selection of the indexes. The
purpose of this paper is to verify the application
potential of the new domestic remote sensing data in
the field of ecological environment. It is the first
time to extract the vegetation index and soil index
by using the data of the wide-band images and the
extraction results are in good agreement with the
actual situation. The follow-up study should study
the theory and method of ecological environment
evaluation and improve the evaluation system. In
addition. Tiangong-2 has high temporal resolution,
which can be used for simultaneous observation and
evaluation of ecological environment, and
monitoring of ecological environment changes.
5 CONCLUSIONS
(1) The ecological environment status of Kunming is
good. The regions, with excellent or good ecological
environment grade account for 63.29% of the total
area of Kunming. The Dian Lake region and the
mountainous regions with steep slope cover 31.06%
of Kunming, whose ecological environment grade is
medium. Regions north to the Dian Lake and other
areas’ environment status is worse, accounting for
5.65% of the total area in Kunming. It is helpful to
improve the overall ecological environment quality
of Kunming by strengthening ecological protection
and restoration of the Dian Lake and its surrounding
areas.
(2) The distribution of ecological environment
status in each district / county is different. Fumin
County and Luquan Yi and Miao Autonomous
County ecological environmental status is relatively
good, whose ecological environment excellent of
good area ratio are 79.47% and 79.39% respectively.
The ecological environment quality of Chenggong
area is the worst, of which more than 60% is under
poor (21.36%) or medium (41.27%) ecological
environment status. The protection of the ecological
environment in the central cities should be
strengthened to further balance the ecological
environment status distribution of different districts/
counties.
(3) This study , the ecological environment
evaluation of Kunming, will not only provide the
decision for Kunming’s "The Belt and Road
Initiative" ecological construction, but also help for
the official scientific protection and restoration of
ecological environment. The image of Tiangong-2
MWI has the advantages of high cutting width,
spectral resolution and time resolution, which has
great potential for applications in the evaluation of
macro ecological environment.
(4) In the follow-up study, the evaluation index
system of ecological environment will be improved
by adding the indicators of biological abundance,
pollution load index and environmental restriction
index. Besides, the dynamic evaluation model will
be set up to realize the dynamic monitoring and
evaluation of the ecological environment in the key
areas by combining the remote sensing image data
of multi time phase.
ACKNOWLEDGEMENT
Thanks to China Manned Space Engineering for
providing space science and application data
products.
REFERENCES
Bi X L, Hong W 2001 Advances of composite evaluation
in ecological environment [J] System Sciemces and
Comprehensive Studies in Agriculture 17(2) 122-
124,126
Chen H G 2012 Study on the Evaluation of Ecological
Envionment and Ecological Construction in Coastal
Areas[D] Nanjing Forestry University
Cheng Q, Zhou L F, Zhang Y L 2012 Ecological
Environment Evaluation of Liaohe Delta Wetland
The Application of the Tiangong-2 Wide-band Imaging Spectrometer Data in the Ecological Environment Evaluation - A Case Study of
Kunming
475

Based on PSR Model[J) Advanced Materials Research
518-523(518-523), 1133-1136
Deng Y B, Li D P, Yi M, et al. 2016 Study on the
normalization coefficient of biological abundance in
Hunan Province Based on RS [J] Geospatial
Information 14(12) 48-51
Guo J P, Li F X 2007 Progress in Research on Eco-
environment Assessment in China [J] Meteorological
Science and Technology 35(2) 227-231
Gan Z P, Li J X, Li Z K, et al. 2016 Ecological
environment assessment of Quanzhou bay on GIS[J]
Journal of Hunan University of Science &
Technology(Nature Science Edition) 04 95-101
Gupta K, Kumar P, Pathan S K, et al. 2012 Urban
neighbor-hood green index: A measure of green
spaces in urban areas[J) Landscape & Urban Planning
105(3) 325-335
He F H, Gu L J, Wang T, et al. 2017The synthetic geo-
ecological environmental evaluation of a coastal coal-
mining city using spatiotemporal big data: A case
study in Longkou, China Journal of Cleaner
Production 142, 854 - 866
Kong W Y, Chong J S and Tan H 2017 Performance
Analysis of Ocean Surface Topography Altimetry by
Ku-Band Near-Nadir Interferometric SAR [J] Remote
Sensing 9(9) 933
Li J Y, Hu Y H, Li S, et al. 2016 The Dynamic Evaluation
of Ecological Environment Quality based on RS and
GIS -- A Case Study on Chenggong District, Kunming
[J] Surveying Mapping 39(05) 213-216
Li Z W, Zeng G M, Zhang H, et al. 2007 The integrated
eco - environment assessment of the red soil hilly
region based on GIS—a case study in Changsha
city,China[J] Ecological Modelling 202(3-4) 540-546
Liu K, Qin B Y, Mu L L, et al. 2017 Monitoring and
analysing of reclamation change based on multi-data
remote sensing images: a case study of partial area of
Liaoning province[J] Marine Environmental Science
6 911-917
Ministry of Environmental Protection of the People’s
Republic of China 2015 Technical Criterion for
Ecosystem Status Evaluation[S]
Qin B Y, Li S Y, Hao Z W, et al. 2017 Earth observation
data of the Tiangong-2 Space Laboratory (2016–
2017)[J/OL) Csdata 2(4) (2017-12-20). DOI:
10.11922/ csdata.2017.0003.
Rees W E 1992 Ecological footprints and appropriated
carrying capacity: what urban economics leaves out [J]
Environment and Urbanization 4(2) 121-130
Song H M, Xue L 2016 Dynamic monitoring and analysis
of ecological environment in Weinan City,Northwest
China besed on RSEI mode [J]
Chinese Journal of
Applied Ecology 27(12) 3913-3919
Tang L F 2017 Ecological problems and Countermeasures
of wetland in Kunming [J] Journal of Green Science
and Technology 6 143-144
Wen H 2016 Multiple "first" validation has been
implemented on Tiangong-2 space laboratory [J)
Manned Spaceflight 11 4-7
Wen H 2016 Multiple "first" validation has been
implemented on Tiangong-2 space laboratory [J]
Manned Spaceflight 11 4-7
Wang C J, Zhao H R 2016 The Assessment of Urban
Ecological Environment in Watershed Scale [J]
Procedia Environmental Science 36 169-175
Yang H X, Zhao J C, Gao L, et al. 2017 China’s Space
Laboratory and Manned Space Station [J) Science
69(4) 1-5
Yan J L 2017 Discussion on the Countermeasures of
building ecological garden city in Kunming [J] China
Forestry Industry 1 99-100
Yang C J, Liu J Y, Zhang Z X, et al. 2001 Decision on
Reforesting and Regrassing Some of the Dry Sloping
Cultivated with Support of GIS and Remote Sensing
in Yunnan[J] Acta Geographica Science 56(2) 181-
188
Yang H X, Zhao J C, Gao L, et al. 2017 China’s Space
Laboratory and Manned Space Station [J] Journal of
nature 69(4) 1-5
Zhao Y 2009 RS and GIS Supported Ecological
Environment Evaluation and Retrieval Model——A
case Study in Kenli County of the Yellow River
China[D] Shandong Agricultural University
Zhang X P 2014 Monitoring and Evaluation of Island
Ecological Environment Based on Remote Sensing: A
Case Study of the Zhoushan Islands Wuhan University
Zhao S M, Wang D W, Wang J T 2013 Evaluation on the
Eco-environmental Status of Kunming and
Countermeasures[J) Environmental Science Survey
32(3) 102-105
IWEG 2018 - International Workshop on Environment and Geoscience
476
