
Water Body Change Detection Based on Sentinel-1 and HJ-1A/B
Satellites Data
Wei Zheng
*
and Jiali Shao
National Satellite Meteorological Center, China Meteorological Administration, Beijing 10008 , China
Email: zhengw@cma.gov.cn
Keywords: Water body, Sentinel-1, HJ-1A/B, Poyang Lake
Abstract: In the operational water body monitoring work by satellite data, Sentinel-1 and HJ-1A/B satellites data are
the proper data source which can be download freely and quickly. The method of water body change
detection by using Sentinel-1 and HJ-1A/B Satellite data is presented in order to make full use of these data
to obtain water body information. The fusion of Sentinel-1 and HJ-1A/B with high resolution can monitor
the water body in all-weather condition. The method is applied in Poyang Lake of China and shows
promising results. Comprehensive and effective utilization of multi-source satellite data could provide
reliable water body information for water resource management, flood warning, real-time monitoring of
flood development, rapid and accurate assessment of flood losses.
1 INTRODUCTION
Earth surface water body is the one of most
important water resources. Water body change
detection using the satellite can provide useful
information for flood disasters monitoring and water
resource management (Zheng et al., 2017; Zheng et
al., 2016). Synthetic Aperture Radar (SAR) and
optical sensors with high spatial resolution are very
useful for obtaining detailed water body information
(Abileah and Vignudelli, 2011). SAR data with both
the two features of high spatial resolution and cloud
penetration are very attractive to water body
monitoring (Delmeire, 1997; Liao et al., 2004; Lv et
al., 2005; Juval et al., 2016), and the high spatial
resolution optical data provide the ideal data source
for water detection under the clear sky (Tholey et al.,
1997; Profeti and Macintosh, 1997). Comprehensive
using the SAR and optical remote sensing data both
can enhance the all-weather satellite observing
capability and data processing efficiency.
2 DATA
In the operational satellite monitoring work, easy to
obtain the satellite data is required. Sentinel-1 and
HJ-1A/B satellites data all can be download freely
and quickly by user register in official website. So,
in this paper, the two satellite data mainly are used
to monitor the water body.
Sentinel-1 is a space mission funded by the
European Union and carried out by the ESA within
the Copernicus Program, consisting of a
constellation of two satellites, Sentinel-1A and
Sentinel-1B. he first satellite, Sentinel-1A, launched
on 3 April 2014, and Sentinel-1B was launched on
25 April 2016. The payload of Sentinel-1 is a
Synthetic Aperture Radar in C band that provides
continuous imagery (day, night and all weather). In
this paper, Sentinel-1 is applied to attain surface
water information in time for it is not influenced by
cloudy and rainy, all-weather observation. The C-
SAR instrument supports operation in dual
polarisation implemented through one transmit chain
and two parallel receive chains for H and V
polarisation. Sentinel-1 operates in four exclusive
acquisition modes showed in Table 1.
HJ-1A and HJ-1B, launched on 6 September
2008, are as two optical satellites of environment
and disaster monitoring and forecasting small
satellite constellation. The two satellites are
equipped with 3 remote sensors such as wide-
coverage CCD scanner, infrared multispectral
scanner and hyper-spectral imager, comprising a
more complete earth observation remote sensing
series characterized by high and medium space
resolution, high time resolution, high spectrum
resolution and wide coverage. CCD scanner observe
484
Zheng, W. and Shao, J.
Water Body Change Detection Based on Sentinel-1 and HJ-1A/B Satellites Data.
In Proceedings of the International Workshop on Environment and Geoscience (IWEG 2018), pages 484-488
ISBN: 978-989-758-342-1
Copyright © 2018 by SCITEPRESS – Science and Technology Publications, Lda. All rights reserved

in parallel to complete scanning and imaging for
earth with swath width of 700 km, ground pixel
resolution of 30m and 4 spectrum bands(table.2).
HJ-1A and HJ-1B have the same orbit with phase
position difference of 180°. The revisit period of two
CCD cameras is only 2 days after networking.
Table 1: Characters of SENTINEL-1A/B.
Operation
mode
Spatial
resolution
Swath
width
Polarisation
Stripmap(SM) 5×5 m
2
80 km
HH or VV
VV+VH or
HH+HV
Scan SAR-
Interferometirc
wide-
swath(IW)
5×20 m
2
250 km
HH or VV
VV+VH or
HH+HV
Extra-Wide
swath (EW)
20×40 m
2
400 km
HH or VV
VV+VH or
HH+HV
Wave mode
(WV)
20×5 m
2
20×20km
2
every
100km
HH or VV
Table 2: Channel parameters of HJ-1A/ B CCD.
Channel
number
Spectral
ranger
(µm)
Spatial
resolu-
tion(m)
Swath
width(km)
Repeti-tion
cycle(days)
1
0.43-
0.52
30
360(single)
700(double)
4(single)
2(double)
2
0.52-
0.60
30
3
0.63-
0.69
30
4
0.76-
0.90
30
3 METHOD
3.1 Water Body Identifying Based on
HJ-1A/B
HJ-1A/B data have 30-m spatial resolution. For the
CCD sensor, red channel 1(0.63~0.69μm) and near
infrared channel (0.76~0.90μm) are taken as the
main channels for water detection due to the specific
spectral properties in these two channels. Red
channel has low reflectance over vegetation and bare
land but relatively higher reflectance over water
surface. Opposite to red channel, near infrared
channel has much higher reflectance over vegetation
and land but much lower reflectance over water
surface. In addition, considering atmospheric
absorption and cloud contamination, it is difficult to
use single channels to distinguish water from land.
Therefore, the ratio between red channel and near
infrared channel are more effective variables instead
of single channel reflectance to separate water from
vegetation, bare land, and cloud shadow. A
threshold method or decision–tree method can be
used to detect earth surface water by using the ratio
(Zheng, 2008; Zheng et al., 2013):
inf
T
red
R
<R
R
(1)
Where R
inf
and R
red
are the reflectance of near
infrared channel and red channel respectively, R
T
is
the thresholds of the ratio.
3.2 Water Body Identifying Based on
Sentinel-1
Under rainy weather conditions, Sentinel-1 data is
quite ideal water body monitoring because it not
only has high spatial resolution, but also can
penetrate cloud. The software SNAP is used to
process the Sentinel-1 data, Firstly, the level-1
Sentinel-1 data was processed for the radiometric
calibration, and the backscatter coefficient could be
calculated; Secondly, Sentinel-1 data was processed
for topographic correction. Furthermore, SAR
images are subjected to an inherent granular noise
called speckle, degrading the quality of the image
and making water extraction more difficult. The
adaptive Gamma filter produces speckle removed
images with relatively low processing time (Martinis
et al., 2009). This method was ultimately selected
for speckle removal, as it was effective for all of the
available SAR resolutions, angles, and sensor modes
(Long et al., 2014). Sentinel-1 data was removed
speckle based on the filter method. Last, water has
lower backscatter signature than other surface
features in SAR imagery, so it can be identified
based on the threshold method as follows:
_SAR T flood
σσ
<
(2)
Where R
inf
and R
red
are the reflectance of near
infrared channel and red channel respectively, R
T
is
the thresholds of the ratio.
3.3 Water Change Detection with
Multi-Source Data
Comparison of two different time water body can
analyze the water change information. Although
SAR has many advantages for being used to detect
the water body at all-weather condition, the
procedure of processing the SAR data is much
harder than optical remote sensing data, and it also
Water Body Change Detection Based on Sentinel-1 and HJ-1A/B Satellites Data
485

can’t determine water change area if only using
radar image. HJ-A/B data can be used to obtain
background water body. Therefore, water change
area can be confirmed by combining the Sentinel-1
image at cloudy and rainy day during flood season
and HJ-A/B image before flood season as follows:
OPT
cha SAR
W=W WI
(3)
Where W
cha
is the water extent extracted by
Sentinel-1 image during flood season, W
OPT
is the
water extent extracted by HJ-A/B image before the
flood season.
4 RESULT AND ANALYSES
The method described in section 3 is applied to
monitor the water body change in Poyang Lake of
China. Poyang Lake, located in Jiangxi Province, is
the largest freshwater lake in China(Figure 1). The
lake is fed by the Gan, Xin, and Xiu rivers, which
connect to the Yangtze through a channel. Water
body change of Poyang Lake can indicate the
climate change and effect of human activity. Using
satellite data to monitor the water body of this lake
is valuable and meaningful (Zeng et al., 2017;
Andreoli et al., 2007). Poyang Lake was hit by
severe heavy rains in early June of 2017. The rise of
water level in lakes caused water body enlarging.
Because of the interruption of precipitation, effective
optical remote sensing data can’t be obtained,
Sentinel-1 data in flood season and HJ-1A/B data
before the rainfall are used to research the lake area
change. The Poyang lake is observed at least every 6
days from Sentinel1A/B and at least 2 days from
HJSentinel-1 data on June 24 of 2017 and HJ-1B
data on May 25 of 2017 were acquired. This
Sentinel-1 data is imaged by IW model and VH
polarisation. Based on the method in section 3,
Poyang Lake water area production on June 24
shows that the water area of Poyang Lake is about
3307 km
2
(Figure 2), this result was compared to
the Poyang Lake water area production by HJ-1B
data on May 25. The comparing result indicated that
the lake area increase by about 43% in flood season
(Figure 3). In order to validate the monitoring result,
the field investigation of Poyang Lake was carried
out. The typical water samples were selected to
investigate base on the water changing thematic map
(Figure 4). The GPS data and photos of the scene
account for the satisfying effect of water body
monitoring result, which indicated locally the good
accordance between field measurement and
extracted water. The water areas with a significant
increase are mainly located in the middle and east of
Poyang Lake. Based on these water monitoring and
assessing production, the water change information
can be showed obviously.
Figure 1: Location sketch map of Poyang Lake.
Figure 2: Sentinel-1 monitoring image on June 24, 2017.
IWEG 2018 - International Workshop on Environment and Geoscience
486
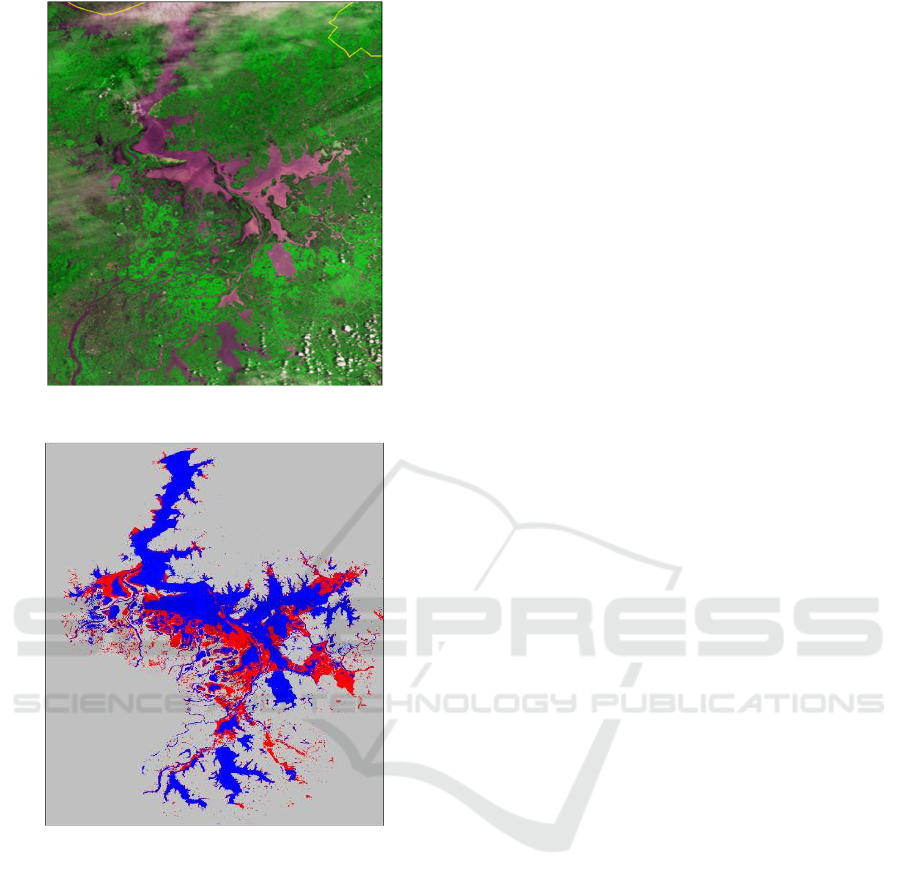
Figure 3: HJ-1B monitoring image on May 25, 2017.
Figure 4: Water changing thematic map.
5 DISCUSSION AND
CONCLUSIONS
The method of water change mapping by
synergizing different types data was developed and
tested. Sentinel-1 data in flood season and HJ-A/B
data before the flood season are employed. The
result shows the comprehensive and effective use of
multi-source satellite data can give reliable earth
surface water body change information. The method
also is proper to other satellite data such as Chinese
GF-3 and GF-1 data.
The optical remote sensing data, such as
Landsat/TM and Sentinel2 A/B data which have the
short wave infrared (SWIR) band is often applied to
detect the water body, for high turbid waters, the
SWIR channel is preferred. So, the choice of the best
spectral band(s) is required according the
characteristic of satellite data before detecting the
water body information. Furthermore, increasing the
satellite data revisiting time is also especially
important for short-time events as floods.
Geostationary satellite data, such as FengYun-4 and
Himawari-8 data with high spatial and temporal
resolution also can be used to monitor the water
body dynamically.
With the fast development of earth observation
technology, more types of satellite data can be
available easily. The method of water body mapping
based on multi-source satellite data will be improved
continually.
ACKNOWLEDGMENTS
The work was supported by National Nature Science
Found of China under grant 41571425 “Research on
flood and waterlogging quantitative retrieval and
super-resolution mapping based on passive
microwave remote sensing data” and National
Nature Science Found of China “Water and wetness
fraction by multi-source data and its application in
flood monitoring and warning in Huaihe river basin”
(40901231). We are grateful to the editor and the
reviewers for their helpful and constructive
comments and suggestions.
REFERENCES
Abileah R and Vignudelli S A 2011 Completely Remote
Sensing Approach To Monitoring Reservoirs Water
Volume International Water Technology Journal
Alexandria 1(1) 63-77
Andreoli R , Yesou H, Li J and Desnos Y L 2007 Inland
lake monitoring using low and medium resolution
ENVISAT ASAR and optical data: Case study of
Poyang Lake (Jiangxi, P.R. China). IEEE International
Geoscience and Remote Sensing Symposium 4578-
4581
Delmeire S 1997 Use of ERS-1 data for the extraction of
fooded areas Hydrological Processes 11(10) 1393-
1396
Juval Cohen, Henri Riihimäki, Jouni Pulliainen, Juha
Lemmetyinen and Jyri Heilimo 2016 Implications of
boreal forest stand characteristics for X-band SAR
flood mapping accuracy Remote Sensing of
Environment 186(1) 47–63
Water Body Change Detection Based on Sentinel-1 and HJ-1A/B Satellites Data
487

Liao J J, Shao Y and Wang S X 2004 Monitoring for 2003
Huai River flood in China using multisource SAR dat
International Geoscience and Remote Sensing
Symposium 4 2260-2263
Long, Stephanie, Fatoyinbo, Temilola E and Policelli
Frederick 2014.Flood Extent Mapping for Namibia
Using Change Detection and Thresholding with SAR
Environmental Research Letters 9(3)
Lv X L, Liu R G and Liu J Y,et al. 2005 Monitoring flood
using multi-temporal ENVISAT ASAR data
International Geoscience and Remote Sensing
Symposium 5 3627-3629
Martinis S, Twele A and Voigt S 2009 Towards
operational near real-time flood detection using a split-
based automatic thresholding procedure on high
resolution TerraSAR-X data Natural Hazards and
Earth System Science 9(2) 303-314
Profeti G and Macintosh H 1997 Flood management
through Landsat TM and ERS SAR data: a case study
Hydrological Processes 11 1397-1408
Tholey N, Clandillon S and Fraipont P D 1997 The
contribution of spaceborne SAR and optical data in
monitoring food events: examples in northern and
southern France Hydrological Processes 11 1409-1413
Zeng Lingfang, Michael Schmitt, Li Lin and Zhu Xiao
Xiang 2017 Analysing changes of the Poyang Lake
water area using Sentinel-1 synthetic aperture radar
imagery International Journal of Remote Sensing
38(23) 7041-7069
Zheng W 2008 Multi-Source Remote Sensing Data
Mining for Flood Monitoring Systematically—A Case
Study in Huaihe River Basin. Beijing: Institute of
Geographic Sciences and Natural Resources Research,
Chinese Academy of Sciences (in Chinese)
Zheng W, Sun D and Li S 2016 Coastal flood monitoring
based on AMSR-E data. 2016 IEEE International
Geoscience and Remote Sensing Symposium 4399-
4401
Zheng W, Sun D and Li S 2017 Mapping coastal floods
induced by hurricane storm surge using ATMS data
International Journal of Remote Sensing 38(23) 6846-
6864
Zheng Wei, Shao Jiali and Wang Meng,et al. 2013 A thin
cloud removal method from remote sensing image for
water body identification Chinese Geographical
Science 23(4) 460-469
IWEG 2018 - International Workshop on Environment and Geoscience
488
