
Study on 3D Permeability Modelling of Carbonate Reservoir Based
on Flow Unit Classification
Li Wei
1,*
, Changlin Shi
1
,
Lanqing Liu
2
and Caihong Yang
1
1
CNOOC EnerTech-Drilling & Production Co. Unconventional Oil & Gas Technology Research Institute;
2
CNOOC Energy Technology & Services Limited.
Email: weili4@cnooc.com.cn
Keywords: Carbonate reservoir, flow units, FZI method, permeability model
Abstract: RQI (Rock Quality Index) and FZI (Flow Zone Index) have proved to be effective methods of dividing the
flow unit in the carbonate reservoir of the R oil field. The method utilizes the porosity and permeability of
the core rock samples to divide the flow unit. The field consists of six flow units, and they represent
different flow characteristics. The FZI can be accurately predicted by establishing a mathematical model of
the log curves where core is not available, and the FZI/DRT (Discrete Rock Type) model of the whole
reservoir is established by geostatistics method. With the DRT model and the porosity model, the
permeability model can be estimated by using the characteristics of each flow unit with unique porosity-
permeability relationship. The results show that the permeability model established by this method does not
require a perm multiplier, the difficulty of curve fitting is greatly reduced and the work efficiency is
improved in the numerical simulations.
1 INTRODUCTION
As an important parameter of oilfield development,
rock permeability is generally converted into a
continuous permeability curves through the
petrophysical parameter model. Permeability is not
only related to porosity but also to pore shape and
pore size distribution. The porosity and permeability
of single-porosity sandstone reservoirs generally
show a simple function change. The established 3D
model of permeability can be converted from 3D
model of porosity. In carbonate reservoirs, however,
this simple functional relationship is hardly valid
due to the properties of carbonate rocks and the
properties that are easily changed. The pore-perm
relationship from the core test is very complicated,
often with small change in porosity, and the
permeability changes by several orders of magnitude
or even the same porosity value corresponds to
different magnitudes of permeability. This
phenomenon does exist in the actual production of
carbonate reservoirs in R oil field in Indonesia, and
the permeability cannot be matched with the actual
output. Therefore, R oilfield needs some method to
establish a permeability model that can truly reflect
the geological conditions of the oilfield and reduce
the uncertainty in development. Based on this, the
authors put forward the application of porosity and
permeability of rock samples, using flow unit index
method to divide flow units, establishing
corresponding permeability model in each flow unit,
and achieving the purpose of improving
permeability model evaluation accuracy.
2 THE BASIC THEORY OF
FLOW UNITS
The concept of flow units was first proposed by
Hearn (1984). He defined a reservoir zone with
vertical and horizontal continuum with similar
permeability, porosity and bedding features as flow
units (
Hearn et al., 1984). After the study by different
experts and scholars, the flow unit has more and
deeper understanding. W. J. Banks et al. Consider
flow units to be further subdivided according to
changes in the physical and petrophysical properties
that affect the fluid flow in the rock (
Ebanks, 1987).
D.C. Barr et al. (1992) consider flow units as a rock
block with similar water features in a given
rock(
Barr and Altunbay, 1992). Yinan Qiu et al.
consider that the flow unit is a naturally occurring
Wei, L., Shi, C., Liu, L. and Yang, C.
Study on 3D Permeability Modelling of Carbonate Reservoir Based on Flow Unit Classification.
In Proceedings of the International Workshop on Environment and Geoscience (IWEG 2018), pages 547-551
ISBN: 978-989-758-342-1
Copyright © 2018 by SCITEPRESS – Science and Technology Publications, Lda. All rights reserved
547

fluid flow channel due to the heterogeneity of the
reservoir, the baffle and the by-pass conditions (
Qiu
and Wang, 1996). Longxin Mu believes that the flow
unit is a reservoir unit that is consistent with
percolation characteristic due to boundary
constraints, discontinuous thin barrier layers, various
sedimentary micro-interfaces, small faults, and
permeability differences within an oil sands body
(
Mu et al., 1996).
The authors through a large number of literature
research believe that D.C.Barr’s definition on the
definition of flow unit is Archie's early extension of
the definition of rock type (
Archie, 1952). Archie
believed that similar rock types were deposited
under similar geological conditions and underwent
similar diagenetic processes to form a type of rock
with unique pore structure and wettability. The
theoretical basis of the method adopted in this paper
is D.C. Barr's definition of flow units.
The flow units have the following features
(
Amaefule and Altunbay, 1993; Gunte et al., 1997; Guo et
al., 2005
) 1)Each flow cell has similar depositional
conditions and diagenetic reformation environment;
2)Under the proper classification conditions, each
flow unit has a unique porosity-permeability curve,
a capillary pressure curve (J-function), and a set of
relative permeability curves; 3)If properly applied,
the flow cell can accurately estimate the
permeability of non-coring section and generate a
reliable initial water saturation curve; 4)Through the
permeability model and oil saturation model build
by the facies control of flow units ,the dynamic
characteristics and production status of the reservoir
can be truly simulated.
There are many ways to identify flow units
(
Varavur et al., 2005; Tan and Lian, 2013; Liu et al.,
2011
), pore throat structure parameter method, flow
zone index method (FZI/DRT), pore throat radius
method, comprehensive parameter method, outcrop
depositional interface analysis method, production
dynamic parameter method and cluster analysis
method. At present, the mainstream technology of
quantitative flow unit classification of carbonate
reservoirs is the flow zone index (FZI) method and
Winland'S R35 method. (
Wang et al., 2017; Chekani
and Kharrat 2009; Tillero, 2012; Shabaninejad and
Haghighi, 2011; Betancourt, 1997
)
3 FZI METHOD
FZI method include two petrophysical methods,
Rock Quality Index (RQI) and flow unit analysis.
The Rock Quality Index reflects the reservoir's
ability to store and seep. Flow unit indicators can be
inferred by the rock quality index, which reflects the
seepage abilities of different rock types under
current conditions, regardless of the rock deposition
in the formation. Porosity and permeability data
from core test were used to calculate the flow unit
according to the following formula (
Amaefule and
Altunbay, 1993
)
= 0.0314
∅
(1)
In formula (1), K is permeability (md), ∅
is
effective porosity (%), RQI is rock quality index
(µm).
∅
=
∅
∅
(2)
In formula (2), ∅
is a normalized porosity.
=
∅
= 0.0314
∅
∅
∅
(3)
In equation (3), FZI is the flow zone index (µm).
FZI is a continuous variable, which is a
parameter that determines the pore structure by
combining structural and rock mineralogical and
pore throat features, and can accurately describe the
heterogeneous characteristics of the reservoir. We
can apply statistical rules to convert FZI to discrete
variables DRT,
=
2
(
)
+10.6
(4)
In equation (4), DRT is rock type. Equation (4) is
merely a simple tool to convert a continuous rock
type variable (FZI) into a discrete one (
Guo et al.,
2005
).
392 core samples from 7 wells in R oil field were
taken and flow units of the oilfield was calculated
according to the FZI method. Table 1 show the
results from one such well.
By calculating three parameters RQI, FZI and
DRT, the reservoir of R oil field can be classified
into 6 flow unit. This helps to build a relationship
chart of core porosity and permeability based on the
classification of FZI method (Figure 1).
Different colors represent different flow units,
and the relationship between core porosity and core
permeability becomes regular in each type of flow
unit, and each flow unit overlaps with each other to
a minimum. Fitting the functional relationship, the
porosity and permeability have a power function
relationship, the correlation is above 0.8 (Table 2).
IWEG 2018 - International Workshop on Environment and Geoscience
548
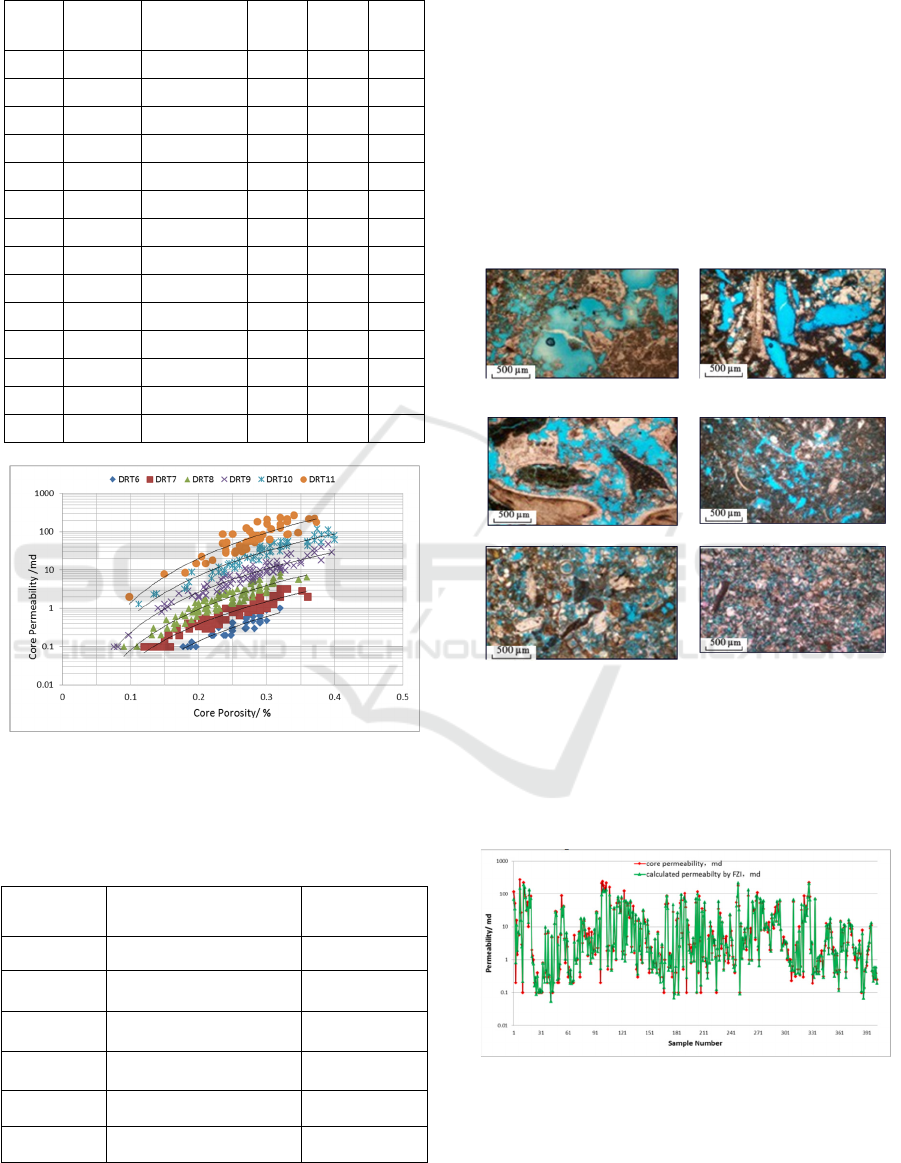
Table 1: FZI & DRT calculation results of well_01 in R
oil-field.
MD
(feet)
Porosity
Permeability
(md)
RQI
(µm)
FZI
(µm)
DRT
3028 0.352 2.9 0.090 0.166 7
3013 0.248 1.4 0.075 0.226 8
3014 0.359 6.4 0.133 0.237 8
3021 0.347 5.7 0.127 0.239 8
3055 0.321 10 0.175 0.371 9
3012 0.304 16 0.228 0.522 9
3027 0.336 27 0.281 0.556 9
3047 0.306 31 0.316 0.717 10
3062 0.381 85 0.469 0.762 10
3052 0.321 57 0.418 0.885 10
3005 0.311 52 0.406 0.900 10
3037 0.346 94 0.518 0.978 11
3059 0.331 88 0.512 1.035 11
3046 0.286 81 0.528 1.319 11
Figure 1: The plot of permeability vs. porosity as
classified using FZI.
Table 2: The relationship of porosity and permeability in
DRT of R oil-field.
Flow Units Relationship formula Correlation
coefficient
DRT6 0.86
DRT7 0.921
DRT8 0.895
DRT9 0.941
DRT10 0.931
DRT11 0.812
Figure 2 is a photograph of six typical castings
thin sections, representing the rock mass of six
different flow units in the field. DRT11
development of holes, connected to each other to
form a fluid flow connectivity, so the permeability is
high. DRT10 development of large holes,
connectivity is better. The DRT6 is very dense, the
development of clay crystal micropores, porosity
and permeability are low, most of the fluid trapped
in the microporosity, it is difficult to form a good
seepage channel. DRT7-DRT9 followed by the
development of micro-mesoporous, mesoporous,
mesoporic-macroporous, structural features between
the DRT6-10.
(
a
)
DRT11
(
b
)
DRT10
(
c
)
DRT9
(
d
)
DRT8
(e) DRT7 (f) DRT6
Figure2: Typical thin section pictures of the six rock
types from the core wells.
The agreement between the two was very good
by comparing the experimental core permeability
with the permeability calculated by the FZI / DRT
method (Figure 3).
Figure 3: A comparison between core permeability and
calculated permeability based on FZI.
=84.071 ∗ ∅
.
=278.36 ∗ ∅
.
=708.36 ∗ ∅
.
=2443.9 ∗ ∅
.
=9557 ∗ ∅
.
K
= 50.353 ∗ ∅
.
Study on 3D Permeability Modelling of Carbonate Reservoir Based on Flow Unit Classification
549

Table 3: Coefficient statistics table.
a b c d e f g
ALL curve -0.16 0.37 0.17 1.17 0.95 -0.18 -0.88
NO DT curve -0.5 0.33 -0.05 1.07 0.79 0.22 0
NO SP curve -0.09 0 0.4 1.1 0.92 0.23 -1.41
NO RD curve 1.33 0.22 -0.33 0 0.38 -0.95 -1.44
4 PERMEABILITY MODEL
BASED ON FZI
4.1 Logging Calculation Method of FZI
Flow unit division is based on core data, and its
calculation method provides us with a more reliable
quantitative template, but the core data is limited
after all. How to apply it to a well or even the whole
field? Here we use the multiple linear regression
method to establish the relationship between log
data and FZI.
Several Well log curves that are sensitive to FZI
are selected. In this study, six log curves of
spontaneous potential(SP), natural gamma ray(GR),
resistivity(RD), neutron(NPHI), density(RHOB) and
acoustic(DT) were selected and normalized by using
the following formula:
=
(
−
)
/( − )
(5)
In equation (5), Nx is the normalized value, X is
the logging curve value, Xmin is the minimum value
of the logging curve, and Xmax is the maximum
value of the logging curve.
Then use multivariate linear regression was used
to get the relationship between FZI and each curve,
the formula used being:
=+∗+∗+∗+∗
+∗+∗ (6)
where a=-0.16;b=0.37;c=0.17;d=1.17;e=0.95;f=-
0.18;g=-0.89
Since not all wells have these six well logs, the
regression equation is also considered with five
curves to calculate the FZI value, the results are
shown in Table 3
Using formula (6), the FZI curve for all non-
coring wells can be calculated.
4.2 Calculation of Permeability Model
The FZI curve is scaled up and the FZI model is
built by Sequential Gaussian Simulation conditioned
to the porosity model (Figure 4). The FZI model is
an interpolation model with continuous variables. In
order to characterize different flow units more
clearly, the FZI model is transformed into the DRT
model (Figure 5) using formula (4). The DRT model
is a discrete volume. The data type is similar to
sedimentary facies or lithofacies. According to the
characteristics of the flow cell, under the proper
classification conditions, each flow cell has a unique
pore-perm curve. Therefore, under the constraint of
the flow cell (under DRT model control),
permeability value for each DRT can be calculated
to get the permeability model (Figure 6).
The permeability model established in this way
can more accurately reflect the geological conditions
of the reservoir. In the numerical simulation, it can
reduce the inconsistent dynamic characteristics and
static characteristics and improve the working
efficiency of the numerical simulation. The RQI /
FZI method facilitates the study of permeability of
carbonate reservoirs.
Fi
g
ure 4: FZI modellin
g
.
Fi
g
ure 5: DRT modellin
g
.
IWEG 2018 - International Workshop on Environment and Geoscience
550

Figure 6: Permeability modelling.
5 CONCLUSIONS
The FZI / DRT method was used to study the flow
units of carbonate reservoir in R oil field. According
to the experimental results of core porosity and
permeability, the reservoir was divided into six
different flow units by empirical formula.
As each flow unit has a distinct structure and
percolation characteristics, the flow unit can be used
as a property to build the 3D model and the
permeability model can be built under the flow unit
constraints. This method can be used to accurately
describe the spatial characteristics of permeability in
a carbonate reservoir.
REFERENCES
Amaefule J O, Altunbay M 1993 Enhanced reservoir
description: usingcore and log data to identify
hydraulic( flow) units and predict permeability in
uncored intervals/well SPE26436 Presented at the 68th
Annual SPE Conference and Exhibition Houston Texas
1993 205-220
Archie G E 1952 Classification of carbonate reservoir
rock and petrophysical considerations AAPG Bulletin
36(2) 278-298
Barr D C, Altunbay M 1992 Identifying hydraulic units as
an aid to quantifying depositional environments and
diagenetic facies. Geological Soc. of Malaysia Symp
On Reservoir Evaluation/Formation Damage 1992
Betancourt J 1997 Rock type modeling: an effective
method to determine reservoir quality rock to
discretize net pay in lower guadalupe formation
Abanico Field Colombia Paper SPE 152332 SPE Latin
America and Caribbean Petroleum Engineering
Conference Mexico City Mexico 16-18 April
Technical Conference and Exhibition in San Antonio
Texas 1997
Chekani M, Kharrat R 2009 Reservoir rock typing in a
carbonate reservoir-cooperation of core and log data:
case study Paper SPE 123703 presented at SPE/EAGE
Reservoir Characterization and Simulation Conference
Abu Dhabi UAE 2009
Ebanks W J Jr 1987 Flow unit concept-integrated
approach to reservoir description for engineering
projects AAPG Annual Meeting 71(5) 551-552
Gunter G W, Finneran J M, Hartmann D J, et al. 1997
Early Determination of Reservoir Flow Units Using
and Integrated Petrophysical Method Paper SPE 38679
presented at the 1997 SPE Annual Technical
Conference and Exhibition San Antonio Texas 1997
Guo G, Diaz M A, Paz F, et al 2005 Rock typing as an
effective tool for permeability and water saturation
modeling: a case study in a clastic reservoir in the
Oriente Basin SPE 97033 presented at SPE Annual
Technical Conference and Exhibition Dallas Texas
2005
Hearn C L, Ebanks W J Jr, Tye R S, et al. 1984
Geological factors influencing reservoir performance
of the Hartzog Draw Field, Wyoming Journal of
Petroleum Technology 36(8) 1335-1344
Liu Jiyu, Wang Ying, Gan Senlin 2011 Study on the
method of classification in flow unit of thin and narrow
sand bodies Science Technology and Engineer 11(15)
3422-3425
Mu Longxin, Huang Shiyan, Jia Ailin 1996 New
technology of reservoir description Proceedings of Oil
and Gas Field Development of China National
Petroleum Corporation Beijng Petroleum Industry
Press 1996 1-10
Qiu Yinan, Wang Zhenbiao 1996 New technology of
reservoir description Proceedings of Oil and Gas Field
Development of China National Petroleum
Corporation Petroleum Industry Press 1996 62-72
Shabaninejad M, Haghighi M B 2011 Rock typing and
generalization of permeability- porosity relationship
for an Iranian carbonate gas reservoir Paper SPE
150819 presented at Nigeria Annual International
Conference and Exhibition Abuja Nigeria 2011
Tan Xuequn, Lian Peiqing 2013 Classification research
on rock typing of carbonate reservoir
Science
Technology and Engineer 13(14) 3963-3966
Tillero E 2012 Stepping forward: an automated rock type
index and a new predictive capillary pressure function
for better estimation of permeability and water
saturation Case study,Urdaneta-01 heavy oil reservoir
Paper SPE 151602 presented at SPE Latin America
and Caribbean Petroleum Engineering Conference
Mexico City Mexico 2012
Varavur S, Shebl H, Salman S M, et al 2005 Reservoir
rock type definition in a giant cretaceous carbonate
Paper SPE 93477 presented at SPE Middle East Oil
and Gas Show and Conference Kingdom of Bahrain
2005
Wang Leilei, Zhang Haibo, et al 2017 The quantification
of flow units and the preparation of water-control
development strategy for Lower Paleozoic gas
reservoirs in the southern area of Sulige Gas Field
Natural Gas Exploration and Development 12 90-95
Study on 3D Permeability Modelling of Carbonate Reservoir Based on Flow Unit Classification
551
