
Research of the Pore Structure Model of Low-temperature
Claus Catalyst
J J Li
*
, H G Chang, G Xiong, J L He, X X Zhang and C R Wen
Research Institute of Natural Gas Technology, Southwest Oil and Gas field Co,
PetroChina, Chengdu, Sichuan, P. R. China
Corresponding author and e-mail: J J Li, li_jj@petrochina.com.cn
Abstract. This paper simulated and calculated the process of low temperature reaction. Using
the principle of response surface method (RSM) Box-Behnken and central composite design,
the paper studied the effects of macroporous, mesoporous and microporous in the catalyst on
conversion rate of reaction process; it also created the relationship between the pore structure
of the catalyst and the efficiency of low temperature Claus reaction, and determined the
optimal pore structure parameters of low temperature Claus catalyst.
Low-temperature Claus technology [1-3], also known as sub-dew point (SDP) sulfur recovery
technology is one of the widely used sulfur recovery and tail gas treatment technology, and the
process characteristic of the technology is that the Claus reaction is carried out below the temperature
of SPD [4-6]. Currently, active alumina is the catalyst used in low-temperature Claus process, and a
number of studies in recent years have demonstrated that the efficiency of SPD Claus reaction is
closely related to the pore structure of active alumina catalyst, especially the large pore volume or the
porosity of macroporous which has been determined as an important parameter for measuring the
transforming activity of the catalyst [5-8].
1. Typical calculating process
The catalyst used for low-temperature Claus reaction has a large number of pores which are widely
distributed. Based on experimental data, the catalyst can be considered as a massive accumulation of
all kinds of single pores in the actual reaction process. Therefore, the conversion amount of H2S can
be calculated by the formula as follows:
(1)
(2)
N1, N2 and N3 represent the quantities of macroporous, mesoporous and microporous
respectively; c1, c2 and c3 represent the conversion amount of sulfur in macroporous, mesoporous
and microporous respectively; N1, N2 and N3 can be calculated as follows:
(3)
46
Li, J., Chang, H., Xiong, G., He, J., Zhang, X. and Wen, C.
Research of the Pore Structure Model of Low-temperature Claus Catalyst.
In Proceedings of the International Workshop on Materials, Chemistry and Engineering (IWMCE 2018), pages 46-51
ISBN: 978-989-758-346-9
Copyright © 2018 by SCITEPRESS – Science and Technology Publications, Lda. All rights reserved
Vi represents the total porous volume of a certain type of pore, and Vsi is single pore volume of a
certain type of pore; the volume of pore is approximated to a sphere, and can be calculated using the
formula of sphere as follows:
(4)
The total conversion amount of H2S under different pore-size distribution conditions can be
determined by solving the three simultaneous equations. Normalizing the above results with the total
amount of H2S involved in the reaction, the actual conversion rate of H2S can be obtained.
According to the experimental conditions, the concentration of H2S is 42%, SO2 is 2.1%, and the
other one is nitrogen in the reactant gas at constant pressure. The actual concentration of H2S is
about 1.875mol/m3 and SO2 is about 0.9375mol/m3. Therefore, according to the previous simulation,
if the concentrations of H2S and SO2 are assigned as 2mol/m3 and 1mol/m3 respectively, the process
of reaction is calculated as follows:
The radius of micropore, mesopore and macropore are assigned as r1, r2 and r3 respectively, and
the typical values of which are as follows:
(5)
The single pore volume with different corresponding pore diameter can be calculated according to
formula (4).
Thus, the total conversion amount and conversion rate can be obtained. Based on the experimental
results, putting the previous calculation results into the former formula, the results of the comparison
are displayed, as shown in Figure 1:
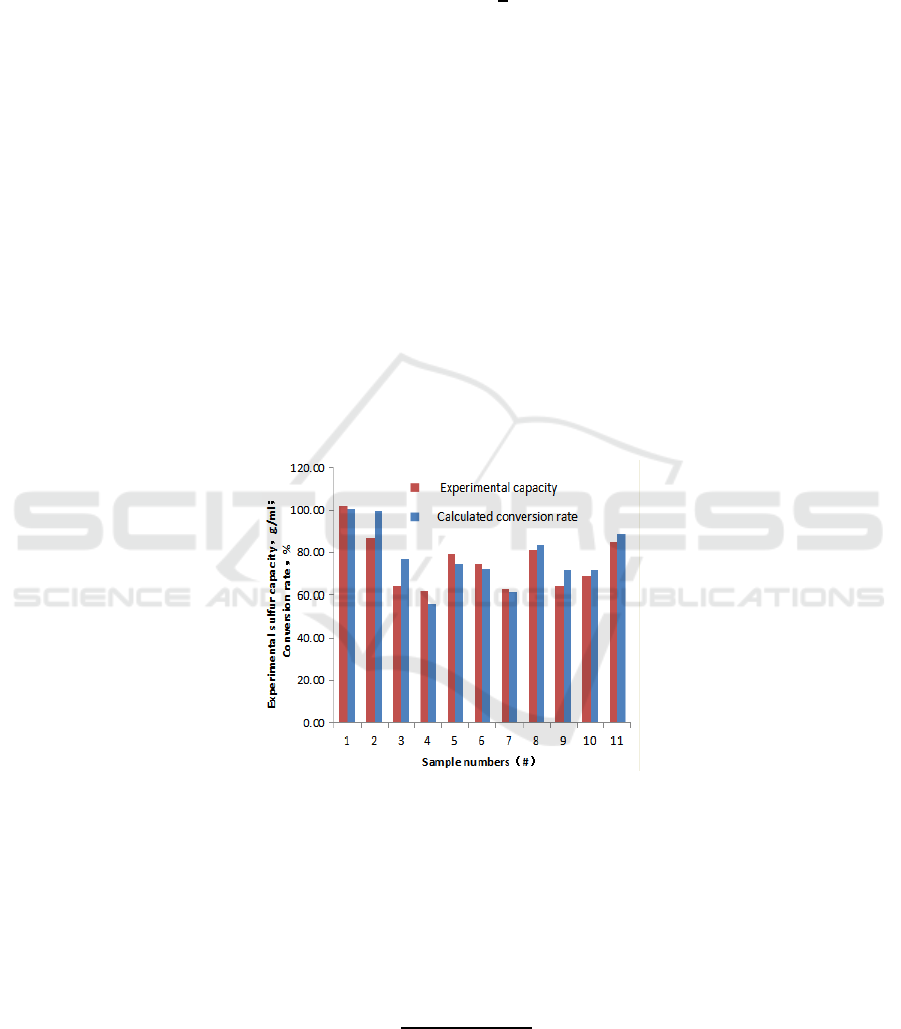
Figure 1. Results comparisons of experimental sulphur capacity and calculated conversion rate.
Based on the experimental data and simulation results, it shows that the sulfur capacity obtained
by experiments and the conversion rate gotten by simulation have a similar tendency.
2. Contributions of different pare diameter
The contribution of pores with different pore diameter of the different catalysts to the reaction
process can be calculated using formula as follows:
(6)
The comparisons of the previous results and conversion rate data are shown in Figure 2:
Research of the Pore Structure Model of Low-temperature Claus Catalyst
47
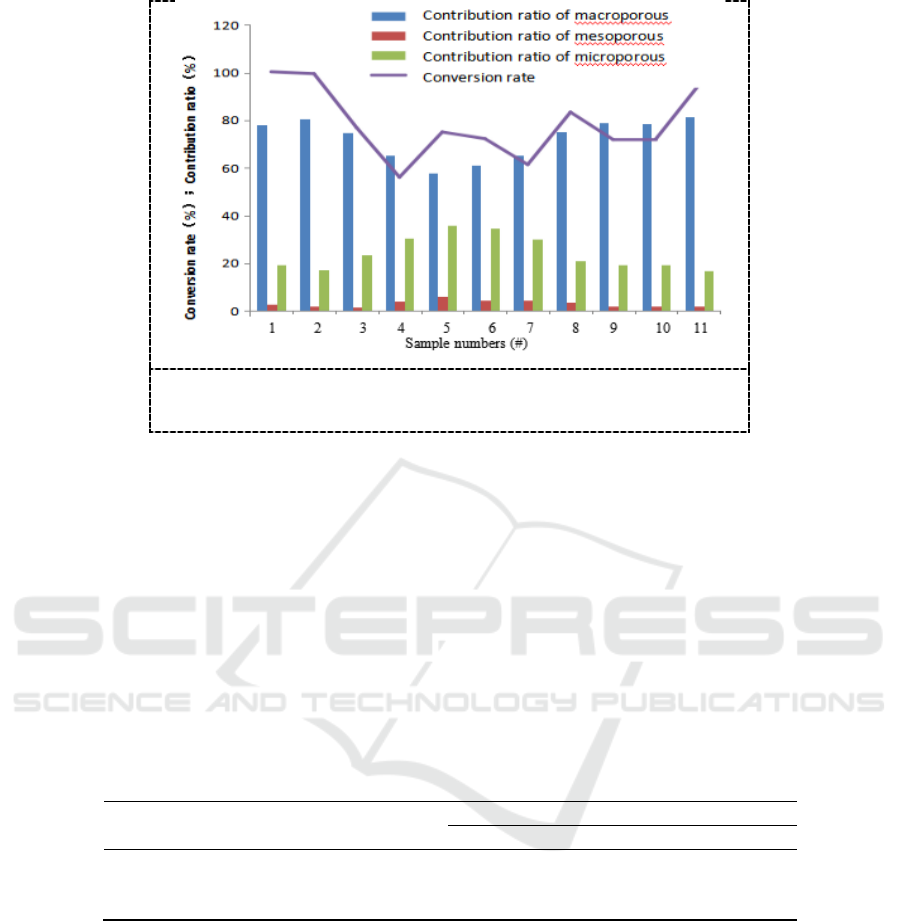
Figure 2. The calculated conversion rate and contribution ratios
of macroporous, mesoporous and microporous.
The results show that the macroporous with total volume ratio of 10%-30% in the catalyst
contribute conversion rate of 60%-80% to the reaction process, the microporous with total volume
ratio of 25%-35% contribute conversion rate of 20%-35%, and the role of mesoporous with volume
ratio of 5%-15% contributing conversion rate of 1%-6% can be ignored. The conversion rate of
sample 5# which has the maximum mesoporous volume ratio of 13.15% is only 72.26%.
3. Pore diameter optimization
The effects of macroporous, mesoporous and microporous in the catalyst on the conversion rate of
reaction process were studied using the principle of RSM Box-Behnken and central composite design.
Based on experimental data range, the optimal value is finally determined by means of 3 factors and
3 levels RSM, as shown in Table 1.
Table 1. Levels table of response surface method experimental factors
Factors
Levels
-1
0
+1
The total volume of macroporous
0.05
0.11
0.18
The total volume of mesoporous
0.03
0.05
0.07
The total volume of microporous
0.34
0.37
0.40
Taking the conversion rate as dependent variable Y, using letters A, B, and C standing for volume
ratios of macroporous, mesoporous and microporous respectively, the calculation scheme and result
of RSM can be obtained. Analyzing the various factors by RSM, the following equation can be
obtained:
Y = 5.55207+380.07101×A +50×B +50×C +617.75148×A2 (7)
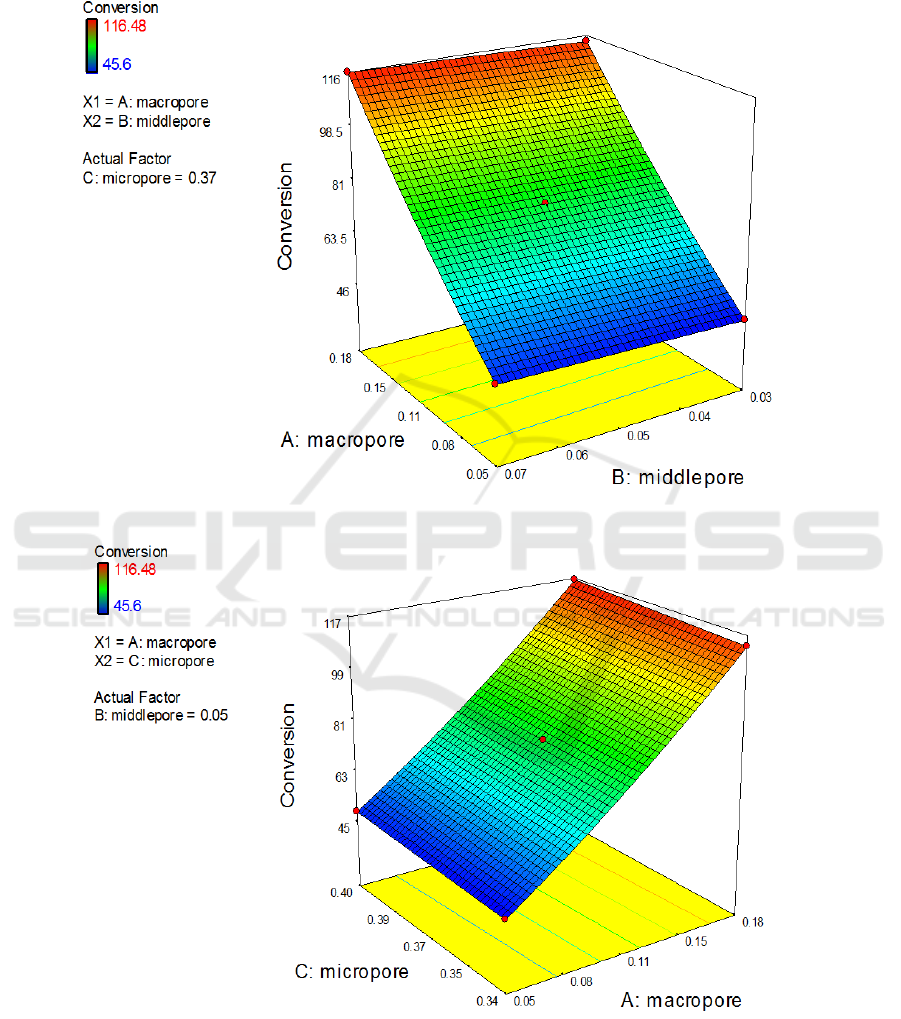
The response surface plots have been obtained by solving the model equation, as shown in Figure
3. and Figure 4. The graphs visually represent the effect of the other 2 variables and the interaction of
them on the response of conversion rate, when one of the variables gets to mid-point of the test. The
graphs also show that the volume ratio of macroporous plays a crucial role on the conversion rate of
the catalyst. When the volume ratio of macroporous is constant, the effect of changing the volume
ratio of mesoporous and microporous on the conversion rate of the catalyst can be ignored. Through
variance analysis of all factors, the results indicate that the model is significant (P<0.0001), the lack
IWMCE 2018 - International Workshop on Materials, Chemistry and Engineering
48
of fit is not significant P=0, and the multi-correlation coefficient
2
R
=0.9999, all of which illustrate
that the model is very useful for simulating the conversion rate of the catalyst. Therefore, the model
can be used for analysis and prediction of the reaction results.
Figure 3. The effects of interaction between macroporous and mesoporous on the conversion rate.
Figure 4. The effects of interaction between macroporous and microporous on the conversion rate.
Optimizing experimental conditions with the above-mentioned model, the graphs showing the
relationships between expected values and other influencing factors are plotted, and the results are
shown in Figure 5 and Figure 6.
Research of the Pore Structure Model of Low-temperature Claus Catalyst
49
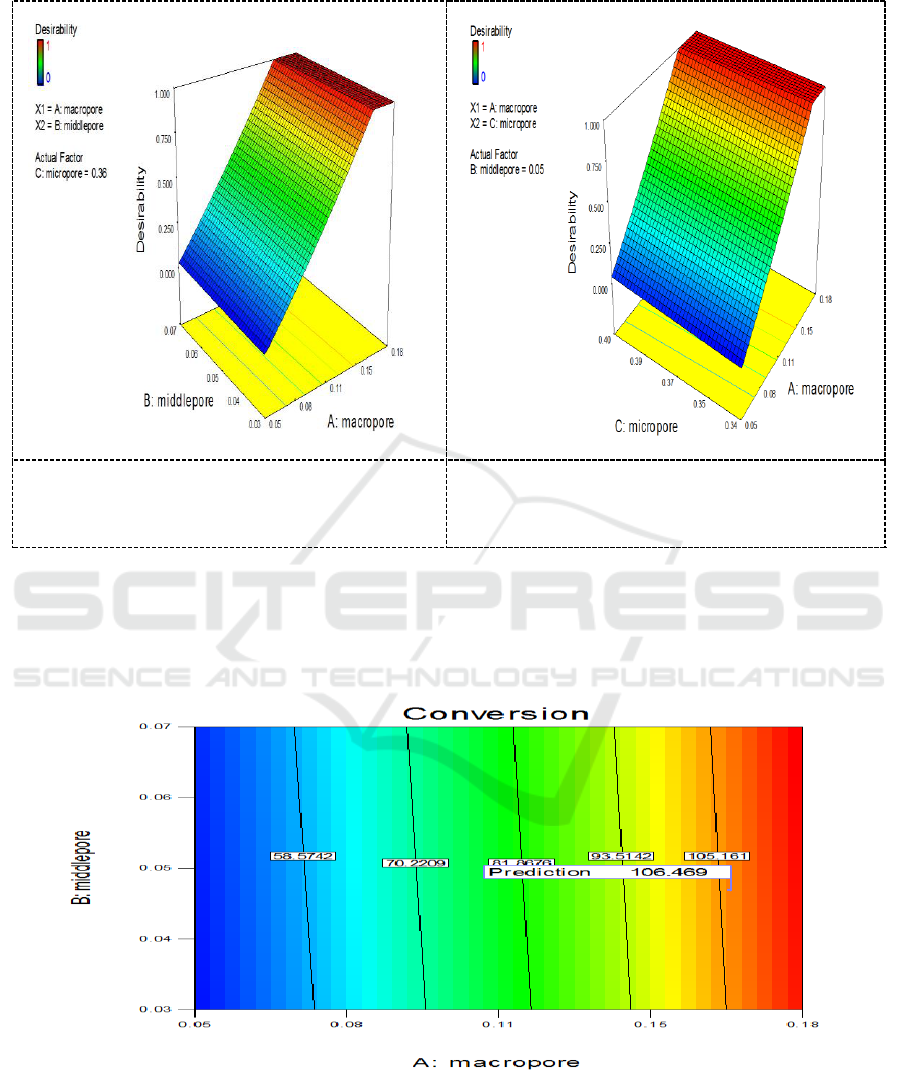
Figure 5. The effects of interaction between
macroporous and mesoporous on the expected
values.
Figure 6. The effects of interaction between
macroporous and microporous on the expected
values.
Based on the optimal conversion rate expectation determined by the expected value model, the
effects of macroporous, mesoporous and microporous are shown in Figure 7 and Figure 8:
Through calculation, the optimal results are that the volume ratios of macroporous, mesoporous
and microporous are 0.16 ml/g, 0.06 ml/g, and 0.36 ml/g respectively. According to the formula
calculation, the conversion rate can reach to 103.17%.
Figure 7. The optimization results of macroporous and mesoporous.
IWMCE 2018 - International Workshop on Materials, Chemistry and Engineering
50
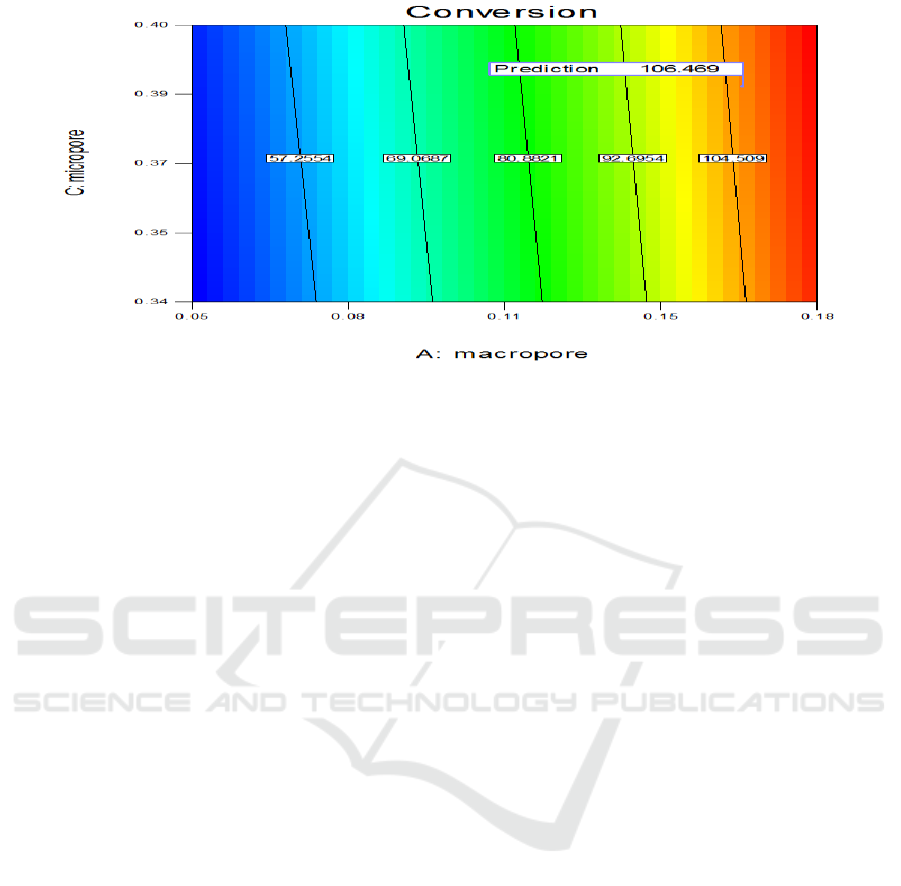
Figure 8. The optimization results of macroporous and microporous.
4. Conclusions
The effect of pore distribution in the catalyst on the conversion rate can be simulated by the equation
Y = 5.55207+380.07101×A +50×B +50×C +617.75148×A2. According to the optimization of the
equation, the optimal pore distribution is that the volume ratios of macroporous, mesoporous and
microporous are 0.16 ml/g, 0.06 ml/g, and 0.36 ml/g respectively. According to the formula
calculation, the conversion rate can reach to 103.17%.
Acknowledgements
We are thankful for the financial support from PetroChina Southwest Oil and Gas Field Company.
References
[1] Goddin C S, Hunt E B and Palm J W 1974 CBA process ups Claus recovery Hydrocarbon
Processing 53(10) 122-124
[2] Kunkel LV, Palm J W, Petty L E and Grekel H 1977 CBA for Claus tail gas cleanup US.
Patent 4035474
[3] Knudtson D K 1977 Amoco CBA process in commercial operation 27th Can. Chem. Eng.
Conf 23-27 Oct Calgary
[4] Tsbulevski A M, Morgun L V, Sharp M and Pearson M 1996 Catalysts macroporosity and
their efficiency in sulphur sub-dew point claus tail gas treating processes Applied Catalysis
A: General 145(1-2) 85-94
[5] Alvarez E, Mendioroz S, Munoz V and Palacios M J 1996 Sulphur recovery from sour gas by
using a modified low-temperature Claus process on sepiolite Applied Catalysis
B:Enviromental 9 179-199
[6] Pineda M and Palacios 1996 The performance of a γ-Al2O3 catalyst for the Claus reaction at
low temperature in a fixed bed reactor Applied Catalysis A: General 13 681-96
[7] Goar B G and Nasato E 1994 Large-plant sulfur recovery processes stress efficiency Oil and
Gas Journal 92 61
[8] Pearson M J 1977 Alumina Catalysts in Low-Temperature Claus Process Industry Engineering
Chemistry Product Research and Development 16(2) 154-158
Research of the Pore Structure Model of Low-temperature Claus Catalyst
51
