
Dynamic Simulation and Test Analysis of Space Truss
Structure
H T Luo
1
, P Wang
2
, N Chen
2, *
, S P Chen
2
, W Wang
2
, T K Wu
3
and H N Wang
2
1
Shenyang Institute of Automation Chinese Academy of Sciences, Liaoning,
Shenyang 110016
2
Northeastern University, Shenyang 110019, P.R. China
3
Shenyang Ligong University, Shenyang 110159, P.R.China
Corresponding author and e-mail: N Chen, chenning2017@126.com
Abstract. Aerospace products are subjected to vibration environment during launching
process. The dynamic characteristics of aerospace products play a decisive role in
environmental adaptability of products. This paper describes the design of a space truss
structure and the load, in order to get the dynamic characteristics, finite element modal
analysis and modal test is done on the structural model, through correlation analysis to
determine the degree of conformity of the finite element model with the experimental model,
the truss structure and load finite element modal and experimental modal similarity degree is
higher, the finite element the model is acceptable; The dynamic simulation of the structure is
carried out by the qualified finite element model, and the dynamic simulation results are
verified by the vibration test; The method for obtaining the dynamic characteristics of
aerospace products and the way of dynamic simulation for launching process is of great
reference value for the design of aerospace products.
1. Introduction
As the spacecraft moves towards a larger, more complicated direction. The space truss [1] is widely
used because of its easy disassembly, good technology and light quality, and it can be adjusted
according to specific needs. It is also an important part of the international space station. The
application of space truss in space was first launched on August 20 and September 5, 1977 by
Voyager 2 and 1 [2].
The random vibration is mainly caused by the exhaust noise of the engine during takeoff, the
aerodynamic noise of the transonic flight section and the pressure pulsation in the engine combustion
chamber. The low-frequency sinusoidal vibration [3]
is primarily a free oscillation of the low order
mode of the elastomers caused by pogo vibration and engine start, ignition quenching and the stage
separation; the turbulence caused by the shock wave of the wind and transonic flight segments, and
the low-order longitudinal oscillation caused by incomplete combustion of the engine.
This kind of low frequency vibration environment
[4-5] can make the space truss structure
damaged, loose connections, structural deformation, the phenomenon of performance degradation,
and the vibration can reduce photoelectric instrument accuracy, mechanical fatigue, circuit
instantaneous short circuit, open circuit, even function failure
[6].
56
Luo, H., Wang, P., Chen, N., Chen, S., Wang, W., Wu, T. and Wang, H.
Dynamic Simulation and Test Analysis of Space Truss Structure.
In Proceedings of the International Workshop on Materials, Chemistry and Engineering (IWMCE 2018), pages 56-63
ISBN: 978-989-758-346-9
Copyright © 2018 by SCITEPRESS – Science and Technology Publications, Lda. All rights reserved
Therefore, in space product design, it is particularly important to obtain the accurate dynamic
characteristics of the product, and the product dynamic characteristics are obtained mainly through
the finite element simulation and test method, while the advantages of the finite element simulation
are emerging.
If we can establish a benchmark finite element model that meets the requirements of engineering
precision and can accurately reflect the dynamic characteristics of the space test device, it will
undoubtedly play an important role in mastering the anti-vibration performance of the space products
in the launch section, as well as the research on the effective load test conditions
[7].
2. Design of truss and load structure
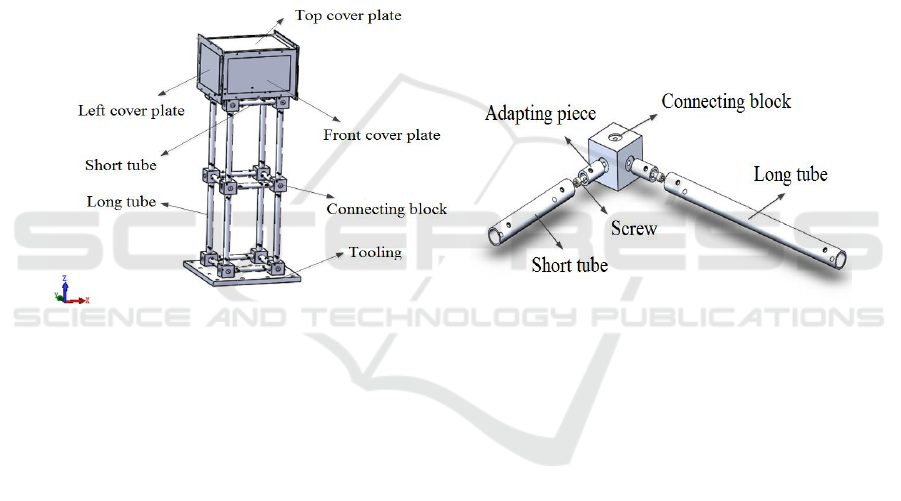
For space truss structure modeling and space load, as shown in Figure 1, Figure 2, the whole
structure is made up of long tube, before and after the short tube, cover up and down, left and right
sides cover plate, plate, connecting block many parts, fixtures and fittings, standard screw, weighs
15.848 kg, the material for AL7075.
Figure 1. Three-dimensional model. Figure 2. The connection of connecting block.
The structure of the space load box is made of a plate-like structure, with a hollow structure inside,
and a screw is used to connect the various surfaces. In addition to the eight faces of the structure of
the box structure, the center of the other surfaces has a circular groove with a diameter of 18 mm and
a depth of 2 mm. It is used for connecting pieces, connecting the long pipe, short pipe and connecting
block through the connecting piece.
3. Dynamic characteristics of truss and load
3.1. Finite element modal analysis
Modal analysis is a prerequisite for kinetic analysis, because the natural frequency and the modality
are the essential parameters of kinetic analysis, reflecting the vibrational properties of the structure.
Modal analysis is divided into theoretical modal analysis and experimental modal analysis. In the
finite element software, the theoretical modal analysis is carried out, which is also called
computational modal analysis. The principle is to use the finite element method to discrete the
structure, and then establish the vibration differential equation to solve the eigenvalue and
eigenvector of the equation, namely the natural frequency and modal mode of the structure. The basic
equation of modal analysis is:
i i i
=KM
(1)
Dynamic Simulation and Test Analysis of Space Truss Structure
57
In this case,
M
and
K
are the mass matrix and the stiffness matrix, and
i
and
i
are the
natural frequencies and modalities of the first model of the structure. Modal analysis is to solve the
equation (1) and obtain the natural frequency and modal mode of the structure.
The finite element model of truss and load adopts the right hand coordinate system, and the origin
o is located at the center line of the lower cover plate. The X-axis is in the direction of the space load
length, and the left cover plate points to the right cover plate. The Y-axis is in the direction of the
space load width, and the front cover plate points to the rear cover plate, and the z-axis is straight up.
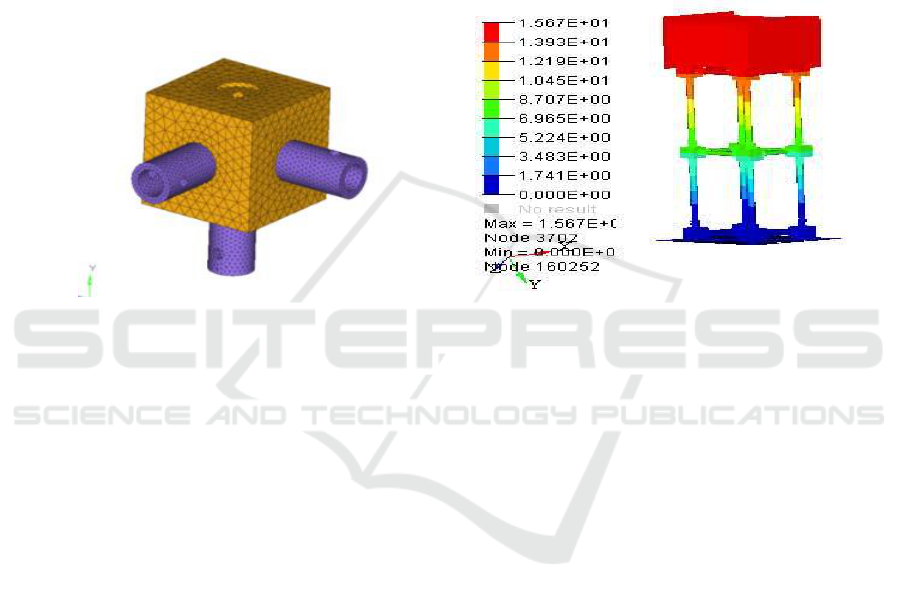
The grid cells are triangular and quadrilateral units, and the connection squares and connections are
divided by the body grid. As shown in Figure 3, the remaining parts are divided by the method of
shell grid, the number of units is 338564, the number of nodes is 162717, and the model weighs
15.23 kg.
Figure 3. Connecting block and adapting piece. Figure 4. The first-order mode.
The finite element modal analysis of space truss and space load structure is carried out, and their
natural frequencies are obtained, and the vibration mode of space truss and space load structure can
be observed intuitively by the mode cloud graph. In this paper, we give the first four order modal
type cloud image, as shown in Figure 4.
3.2. The modal test
The modal test of truss and load structure is carried out, and the truss structure is fixed to the
vibration table. The constraint boundary of the simulated truss structure is shown in Figure 5. The
test point layout is shown in Figure 6, with a total of 38 measurement points, and the excitation
method is used to stimulate. The minimum elastic frequency of the clamping device used for support
is much higher than the maximum analysis frequency of the specimen structure. Generally speaking,
it is easy to realize the constraint boundary of small and medium structures, but it is difficult to
realize the constraint boundary of large structures [8]. The quality of the truss structure in this paper
is 15.85 kg, the analysis frequency is 200 Hz, the vibration table is 4500 kg, and the first-order
resonant frequency is 2200 Hz, which satisfies the requirements of the truss structure constraint
boundary.
IWMCE 2018 - International Workshop on Materials, Chemistry and Engineering
58
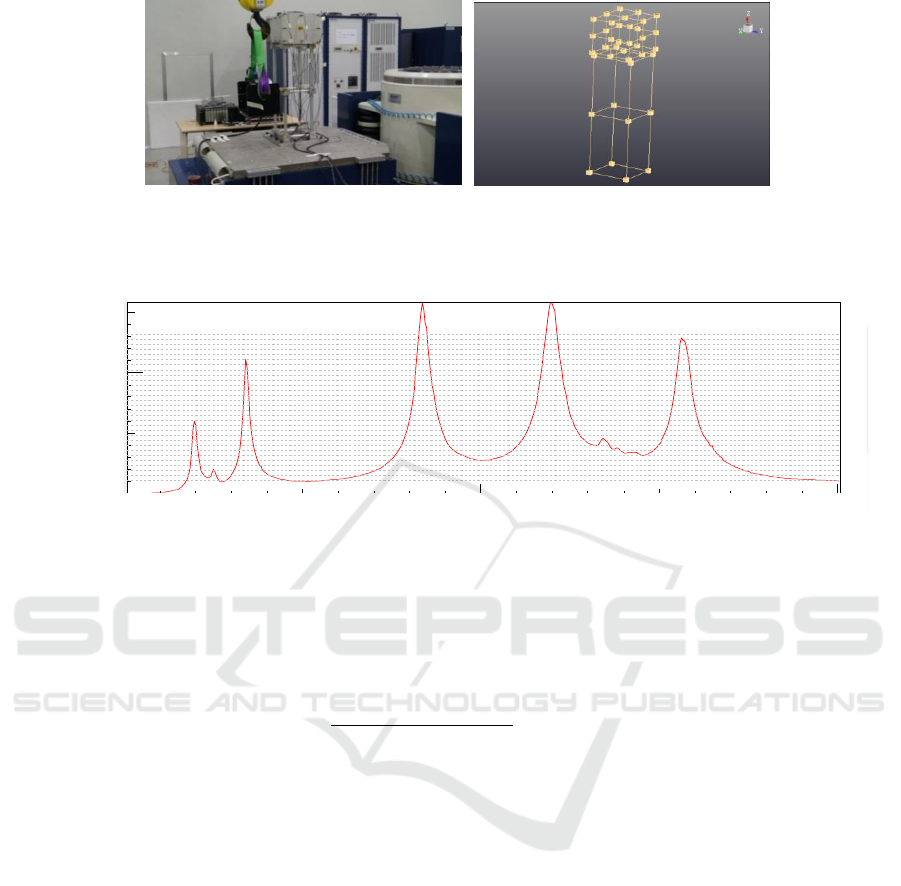
Figure 5. Modal test. Figure 6. Geometric model.
The modal test analysis bandwidth of truss structure is 200 Hz, the frequency resolution is 1 Hz,
and the steady-state diagram of the frequency response function is shown in Figure 7.
200.810.81 Linear
Hz
0.16
0.07e-3
Amplitude
g/N
o o o
v v v
v v v
o v v v
o v s s o s
v s s s v
s s s s s
s s s s o s
s s s o s v o
v s s s o v o v
v s s s v v
s s s s o s o v
s s s o s v s v v
v s vv v s v o s v v
s s vv v s v v s v v
s s v v v s v v s v v
s s s v s s s s s s v
s o s sv v sv s v s v
s s vv v vs v v s o v
s o s vv v sv s v s v o v
s s sv v sv v v s v o v v
s o s o vv v sv s v s s v v
s v s o o vv v sv v o s s v v v
s s s v v sv v ss s v s s s v s
s v s v sv v sv v v s s v v o v
s s s v sv v o sv s v s s s v v s
s v s o sv v sv s v s s s s s
s s s v ss s sv s s s s s s s
s s s o v ss v sv s v s s s v s
4
5
6
7
8
9
10
11
12
13
14
15
16
17
18
19
20
21
22
23
24
25
26
27
28
29
30
31
32
0.81 Linear 200.81
Hz
4
32
Amplitude(g/n)
0.7e-4
0.16
Figure 7. Steady state diagram of frequency response function.
3.3. Modal correlation analysis
In this paper, modal confidence criterion (MAC) in formula (2) is used as quantitative evaluation
index.
2
,
T
Test FE
Test FE
TT
Test test FE FE
VV
MAC
V V V V
(2)
In the formula,
test
V
and
FE
V
are the modal vectors of test mode and finite element modal; the
elements in
,Test FE
MAC
matrix represent the cosine Angle between two modes, reflecting the relative
degree of two modes. The MAC value should be between 0 and 1. When the MAC value is greater
than 0.8, it can be considered that the vibration mode
test
V
of the test mode is similar to the mode
FE
V
of the finite element calculation mode; When the MAC value is less than 0.2, it can be
considered that the vibration mode of the test mode and the mode of finite element calculation are
orthogonal.
In this paper, LMS Virtual. Lab software is used to conduct correlation analysis based on the
results of finite element modal analysis of truss and load structure and modal experimental results. As
shown in Table 2, The finite element modal is similar to the experimental mode, and the first two
order MAC values are all around 0.9, and the finite element model is acceptable.
Dynamic Simulation and Test Analysis of Space Truss Structure
59
4. Dynamic simulation and experiment
4.1. Dynamic simulation
The finite element model of the truss and the load structure has been proved to be acceptable. The
finite element model is used to carry out the dynamic simulation analysis of the truss and the load
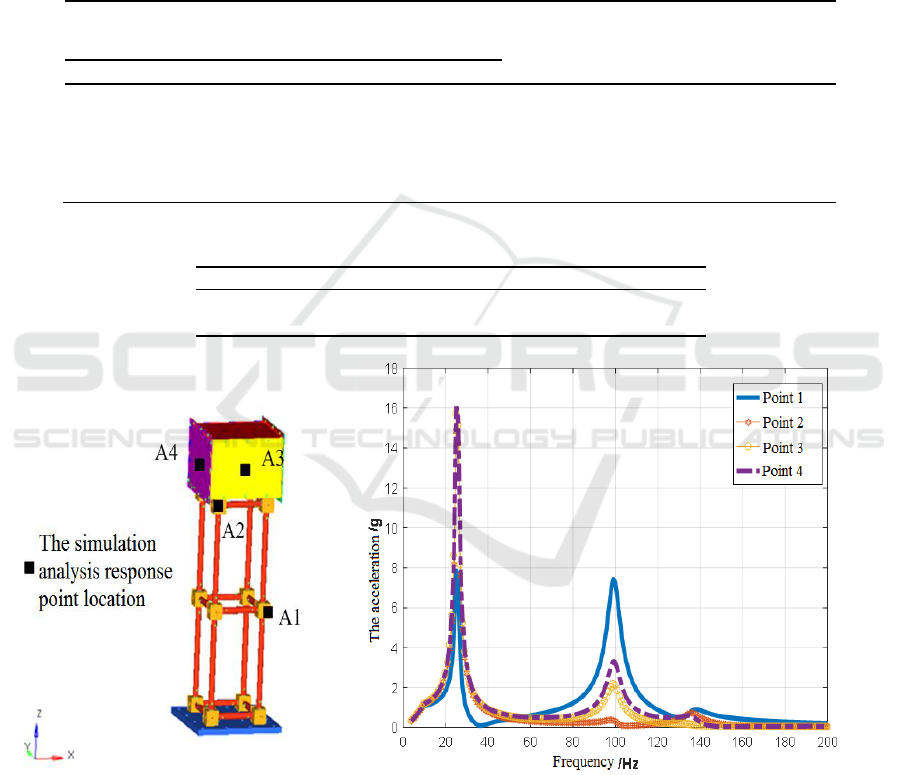
structure X to the harmonic response dynamics, to simulate the low-frequency sinusoidal vibration of
the rocket in the process of the rocket, and the conditions of the analysis are shown in Table 2, and
the response measurement points are shown in Figure 8.
Table 1. Modal mac values and frequency differences of modes.
Experimental
modal
The simulation mode
MAC value
Frequency difference
(Hz)
Order
Frequency(Hz)
frequency (Hz)
1
19.7
25.5
0.819
-5.75
2
24.9
25.5
0.924
-0.51
3
34.1
32.3
0.669
1.83
4
83.6
99.9
0.519
-16.3
Table 2. Dynamic simulation condition.
Loading direction
Frequency range (Hz)
Amplitude 0-P
x dimension
4-10
5 mm
10-200
1 g
Figure 8. Response point position. Figure 9. Response point simulation results.
The simulation results of the four response points are shown in Figure 9, and the structure is most
responsive at 25 Hz. The overall response of the structure at 25 Hz is shown in Figure 10 below. The
maximum response of the structure is 16.6 g, which occurs at the top of the load.
IWMCE 2018 - International Workshop on Materials, Chemistry and Engineering
60
4.2. Dynamic test
The simulation results were verified by X - directional sinusoidal sweep vibration test of the space
truss and load structure (as shown in Figure 10). The test conditions were consistent with the
dynamic simulation conditions (shown in Table 2.), and the sweep rate was 4oct/min. The
experiment uses two control points on the average control, and the position of the control points is
located in the work and the truss structure, and the response point is consistent with the dynamics
simulation response point.
Figure 10. Sinusoidal sweep vibration test.
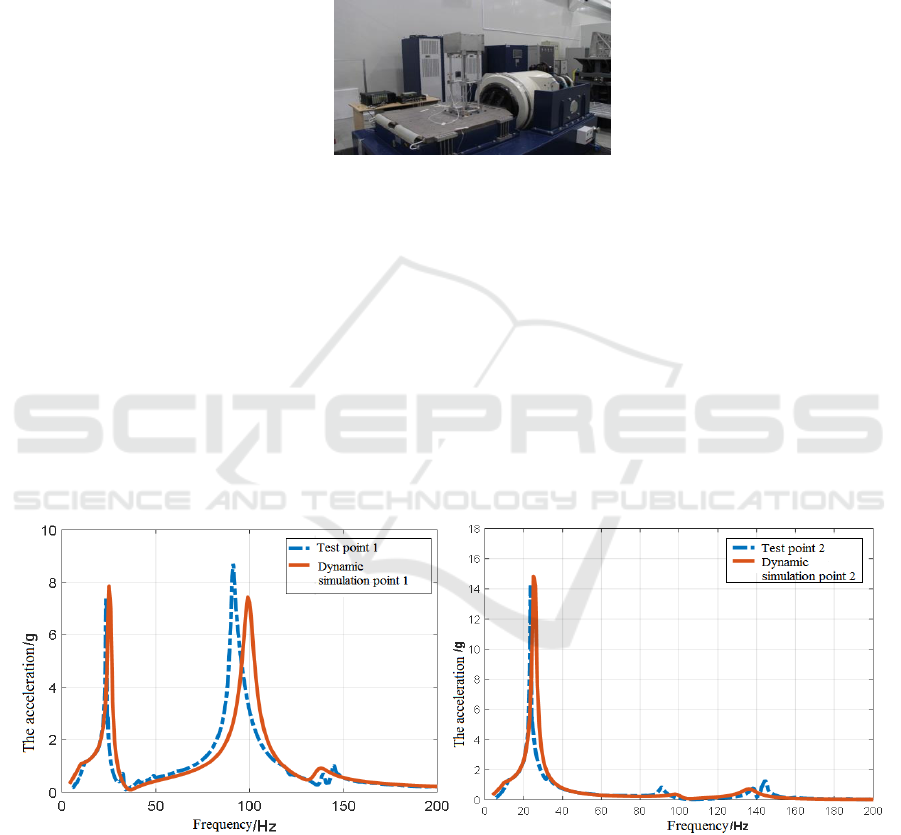
The dynamic simulation results and the vibration test results of the four response points of the
spatial truss and the load structure are shown in Figure 11. The frequency and amplitude response of
the first order response of the four response points are shown in Table 3. The first order acceleration
response frequency of the four test point frequency response analysis is larger than that of the
vibration test, and the error is 5.4%. This is because the magnitude of the vibration test is larger, and
it is difficult to avoid the phenomenon of loose and weak twisting between the components, which
leads to the reduction of the stiffness. Through the comparison of the finite element simulation
analysis and the vibration test data, it can be seen that the difference of the acceleration response
value between the simulation and the test at the corresponding test point is small, and the finite
element analysis data is a little bigger than the test data. From the data in Table 3, the first order error
is 4.3%, the second order error is 2%%, the third order error is 10%%, and the fourth order error is
3.8%.
a) 1 response point b) 2 response point
Dynamic Simulation and Test Analysis of Space Truss Structure
61
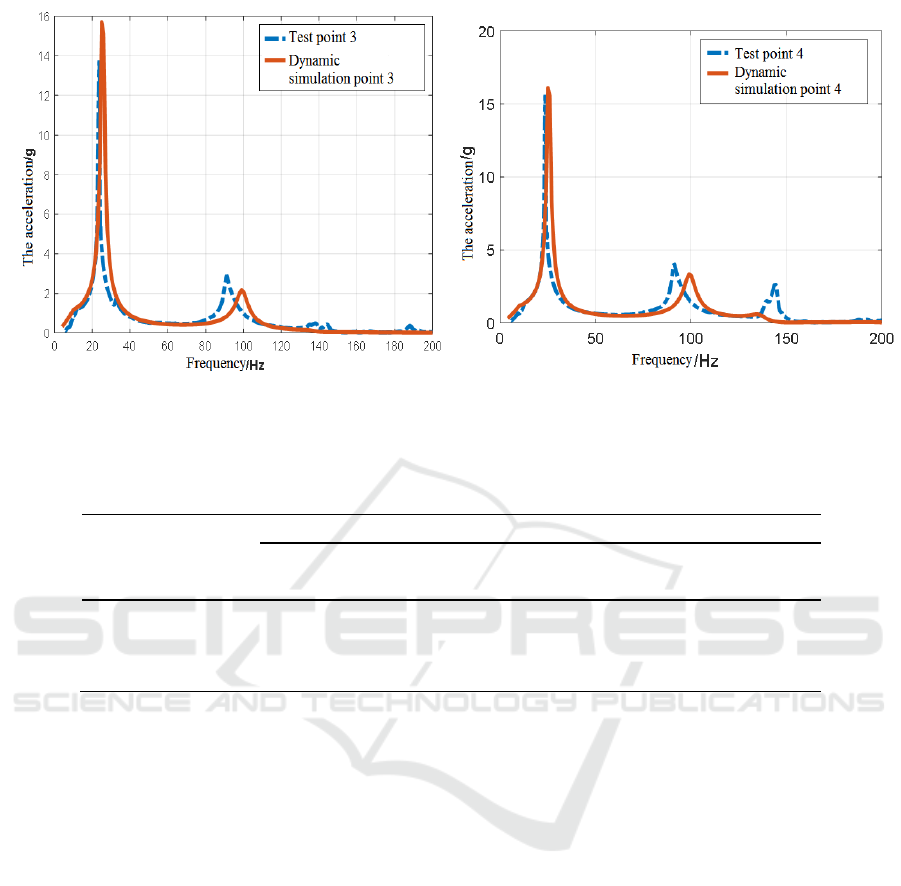
c) 3 response point d) 4 response point
Figure 11. Comparison of dynamic simulation results and vibration test results.
Table 3. First order peak comparison of X direction and test.
Measurement point
A first order frequency
The first-order peak
The simulation
(Hz)
Test
(Hz)
Error
(%)
The simulation
(g)
Test
(g)
Error
(%)
1
25
23.7
5.4
7.86
7.53
4.3
2
25
23.7
5.4
14.83
14.53
2
3
25
23.7
5.4
15.8
14.3
10
4
25
23.7
5.4
16.1
15.6
3.8
5. Conclusions
In this paper, we design a space truss structure and load, in order to get the dynamics characteristics
of the structure of the finite element modal analysis and modal test, through determining finite element
modal and test modal similar degree is higher, the former two order MAC values are around 0.9, finite
element model is acceptable; using the finite element model to perform the dynamic simulation of the
structure, and using the vibration test to test the dynamics simulation results, the empirical evidence
dynamics simulation results are less than the test results.
Acknowledgment
This work was supported by National Natural Science Foundation of China (No.51505470) and Youth
Innovation Promotion Association, CAS.
References
[1] Zhang Y T 2014 Xi 'an China Design and simulation analysis of the deployable structure of
fixed truss Doctoral dissertation Xi 'an university of electronic science and technology
[2] Li H F 2007 Changsha China Analysis of mechanical properties and passive vibration control
of large flexible space truss Doctoral dissertation National University of Defense
Technology
[3] Bao X D 1982 Analysis of low-frequency vibration environment conditions of foreign carrier
rocket Missile and space vehicle technology Vol 4 pp 0-6
[4] Wang Q Z and Liu B 1995 Research on prediction and control technology of space accident
IWMCE 2018 - International Workshop on Materials, Chemistry and Engineering
62

and dynamics environment Environment technology Vol 4 pp 1-6
[5] Xia Y L and Wu J J 1998 Low-frequency vibration environment of space launch and its
simulation Intensity and environment Vol 1 pp 1-8
[6] Xu J H, Fan B and Lian H D 2015 The application of viscoelastic constrained damping in large
aperture reflector Space return and remote sensing Vol 2 pp 32-38
[7] Wang A P and Shang L B 2017 Analysis of modal analysis and model optimization of space
science test device Engineering and experiment Vol 3
[8] Li Z X, Li X Q and Chen X D 2008 Study on the influence of boundary conditions on modal
influence in finite element analysis Chinese mechanical engineering Vol 19 pp 1083-1086
Dynamic Simulation and Test Analysis of Space Truss Structure
63
