
Comparative Analysis on the Filtering Methods of Human
Kinematics Data
Hongbing Ba
1
, Jihe Zhou
2
1
IAba Teachers University,Shuimo Town, Aba Prefecture , China
2
Chengdu Sport Institute,Chengdu City,Sichuan , China
Keywords: Kinematics data,Filtering Method,Comparison analysis.
Abstract: In this paper, the infinite pulse filter was analyzed in the comparative experiment method. Through the
experimental analysis: In particular, the need to deal with extreme values of human motion data, to give
priority to low-pass filter, the data changes are relatively smooth to consider using infinite pulse filtering.
Due to the continuity of human motion and given that the data end distortion rate is higher than the initial
one, it is necessary to take some extra frames after the action keyframes to reduce the error caused by end-
of-sequencedistortion.
1 INTRODUCTION
Human kinematics data obtained by sports
biomechanics needs to be smoothed by low-pass
filter generally. In this paper, the infinite pulse filter
was analyzed in the comparative experiment
method, in order to understand the effect of the two
methods in obtaining the human kinematics data.
2. RESEARCH METHODS
2.1 Research Object
The research object of this paper is the FIR filter,
including low pass filter (fourth-order butter worth
filter) and IIR filter (the standard filter function is
butter worth filter).
Usually, data collected from human kinematics
can be classified into three basic motion forms:
linear motion, quadratic function type motion and
trigonometric function type motion. In this
study[1],the horizontal (X) motion data in oblique
motion was used as linear signal data , the vertical
(Y) motion data was used as two quadratic function
type (parabolic type) signal data and the horizontal
(X) motion data in the swing was used as triangular
function type data.
2.2 Experimental Analysis Method
2.2.1 Experimental Data Acquisition
Two BASLER A6 high-speed cameras were used to
shoot balls (tennis) respectively for oblique motion
and simple pendulum motion with shooting
frequency of 200 Hz, and the trajectories of balls
should be closely and parallel to the vertical and flat
wall with potable paper.
2.2.2 Experimental Data Processing
The high- titanium 3D V1.0C video analysis system
produced by Beijing Senmiaoxin Company was used
to analyze and process the image data, and dot with
vibration amplitude (i.e. output frequency of
100Hz), and two kinds of filtering methods were
used to smooth respectively. The differences
between the results were compared after the
processing of two filtering methods. The data after
processing were processed with Excel 2003 and
SPSS17.0.
2.2.3 Reference Standard
The image with sampling frequency of 200Hz was
processed by the Adobe Photoshop CS2 9.0 software
frame by frame, dotted amplitude by amplitude after
image magnification. The coordinates (pixels) of the
center of the ball were recorded accurately, and then
converted to the actual coordinates.
Then the EXCL was used to trace point and
connect lines, and then the Adobe Photoshop CS2
9.0 software was used again to obtain the coordinate
of the center of the balls, which was the reference
standard.
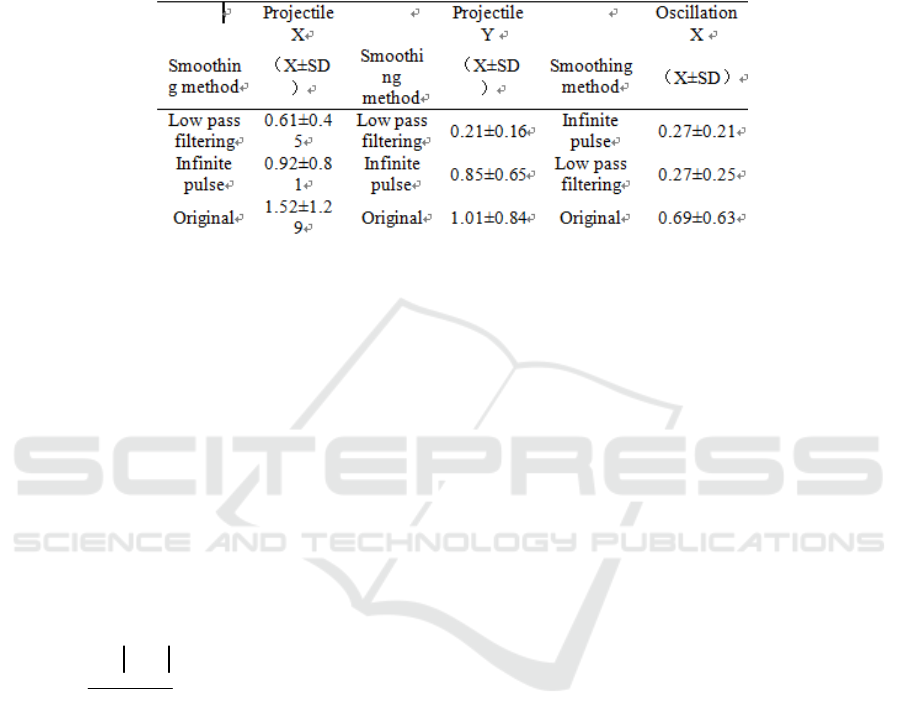
Table 1: the average deviation of data processed by different smoothing methods (units: centimeters).
The reasons for choosing it as the reference were
that:
(1) It was easy to mark the center of the ball by
magnifying the ball, and it is of high accuracy to
identify the coordinates by the pixel coordinates.
(2) The image with acquisition frequency of
200Hz is more accurate than that of 100Hz in actual
processing.
2.2.4 Error Evaluation Method
The average deviation was used to evaluate the
error, that is, the average displacement difference
between the position and the corresponding
reference standard position in each frame was the
average deviation. That is:
(1)
( was the distance between the displacement and the
reference standard displacement after the
smooth treatment at )
3 RESULTS AND ANALYSIS
3.1 Comparative Analysis on the
Smoothing Errors of the Two
Filtering Methods
The three types of data were processed by two kinds
of filtering methods with the cut-off frequency of
6Hz. Considering the distortion rate of the end of
filtering, the data at the end part was truncated, with
5 frames and 10 frames in the slanting motion (90
frames left), 10 frames and 40 frames in the
oscillating motion, (390 frames left), and then the
error of the result was compared to determine the
effect of various filtering methods.
From table 1, it can be concluded that, in general,
two kinds of filtering methods were different in
dealing with the error of three kinds of signal data
types, and the low-pass filtering method was better
in effect. For the three kinds of signal types, the
error of oblique horizontal motion (X direction) was
the largest, that of the oblique vertical motion (Y
motion) was the second, and that of the swing
horizontal motion (X motion)was the smallest.
In the linear data signal type, the filtering effects
had significant difference. In the case of the same
cut frequency, the effect is that the low pass filter is
better than the infinite pulse filter.
In the processing of the quadratic function type
data, the effect of the low pass filter is better in the
two filtering methods.
3.2 Phase Analysis
The high efficiency of IIR filter is at the expense of
nonlinearity. The IIR filter with better selecting
performance will be worse in phase characteristic,
but the FIR filter can get a strict linear phase. So the
IIR filter is used for data processing with low phase
requirement. If the phase request is strict, FIR filter
is better than IIR filter in performance and economy.
IIR filter is used in speech processing with low
phase requirements, while FIR filter is used in the
processing of relative sensitive image data signals
[2] .
The horizontal displacement (X direction
motion) in the projectile motion, oblique vertical
1
n
i
i
d
D
n
=
Δ
=
∑
i
t
displacement (Y direction motion) and swing
horizontal displacement (X direction) data were
taken as the research objects respectively, and
filtered by two different filtering methods (cut
frequency of 8Hz).
In order to quantify the difference, the 90 frame
data of the oblique projectile X direction motion
were selected for linear programming. The
programming model is as follows:
(2)
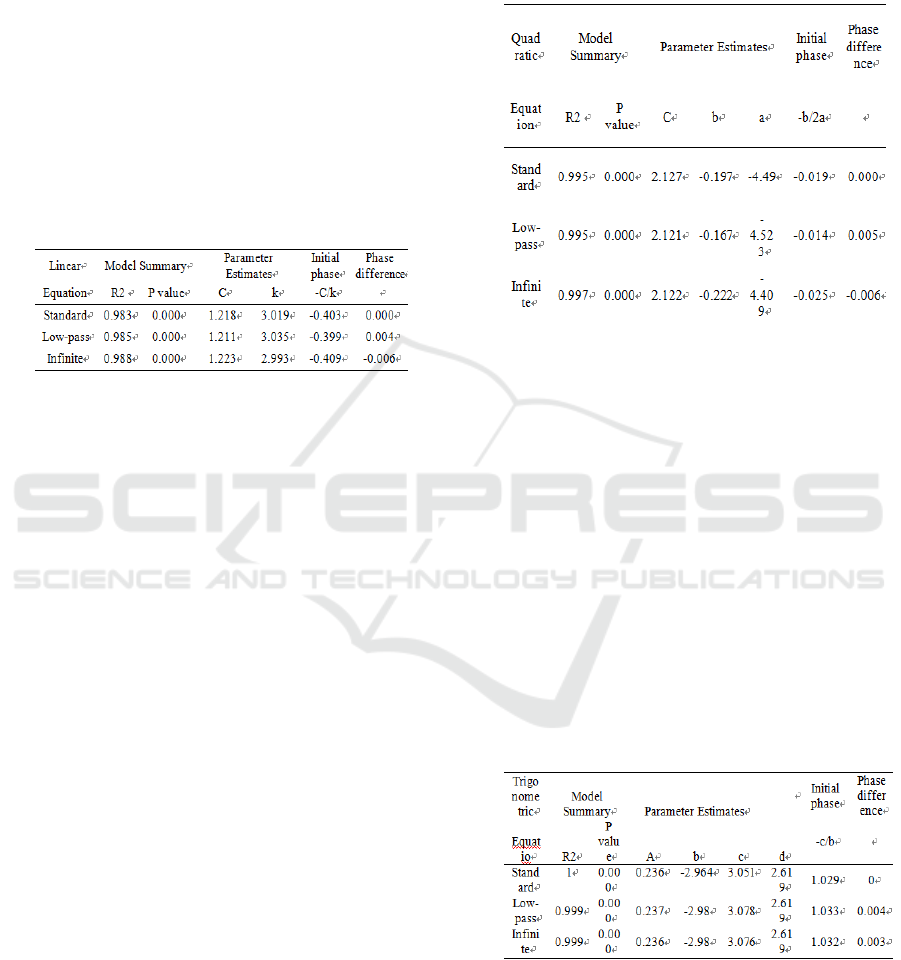
Table 2 :Linear programming after data processing of
oblique projectile X direction motion .
(The P value is 0.000, indicating that only the
first three decimal digits are displayed after
computer computing)
It can be seen from Table 2 that the correlation
coefficient R2 was greater than 0.98, and the
probability was less than 0.001, so the fitting of data
after the processing of various methods was very
significant. The comparison of slope k showed that
low pass filtering was closer to the slope of
reference standard and the slope of infinite pulse is
less than standard. The comparison of phase
difference showed that infinite pulse filtering had
obvious phase retardation.
Therefore, in the case of the overall rising trend,
the slope of infinite pulse filter is the least, and it can
delay the change of data in the data processing.
The first 90 frame data of the oblique projectile
X direction motion was selected for quadratic
programming. The programming model was as
follows:
(3)
It can be seen from table 3 that the correlation
coefficient R2 was greater than 0.99, and the
probability P was less than 0.001, so the fitting of
data after the processing of various methods was
very significant. According to the law of the
parabolic function image, it can be known that the
value of the coefficient a was negatively correlated
with the size of the opening. It can be concluded that
the low pass filter was equivalent to the reference
standard, and the opening of the infinite pulse was
slightly larger than the standard.
Table 3 :Quadratic programming after data processing of
oblique projectile X direction motion.
(The P value is 0.000, indicating that only the
first three decimal digits are displayed after
computer computing)
Therefore, in the case of the overall downward
trend, the opening of the image was downward while
the opening of the infinite pulse filter was the
smallest. As a result, the downward trend was
slower and the phase was delayed, so the change of
data was delayed too.
The first 400 frames data of the oblique
projectile X direction motion was selected for
nonlinear programming. The programming model
was as follows:
(4)
Table 4: Nonlinear programming after data processing of
wobble X direction motion.
(The P value is 0.000, indicating that only the
first three decimal digits are displayed after
computer computing)
It can be seen from table 4 that the correlation
coefficient R2 was greater than 0.998, and the
probability P was less than 0.001, so the fitting of
data after the processing of various methods was
X
kt C=+
2
Yat btC=++
sin( )XA btcd=++
very significant. The value of the parameter B in the
table showed the frequency of the signal data after
various processing, and it can be seen that the
difference between the low pass filter and the
infinite pulse was small. The comparison of phase
difference showed there is little difference in the
whole, and the infinite pulse was slightly backward
than the low pass filter phase.
3.3 Endpoint Distortion Analysis
The data after the processing of filtering and
smoothing was distorted[3], and the related research
has confirmed that the distortion rate at the end of
the data sequence was larger than that at the
beginning of the data sequence [4]. We are
discussing the degree of the distortion at the end
now. The degree of distortion was measured by an
average deviation of D in this experiment. The
original data of oblique horizontal motion (X
motion), oblique vertical motion (Y motion) and
swing horizontal motion (X motion) was filtered by
various filtering methods (cut frequency of 8Hz),
and then compared with reference standard data. The
average deviation between the first 10 frames and
the last 10 frames was selected to compare.
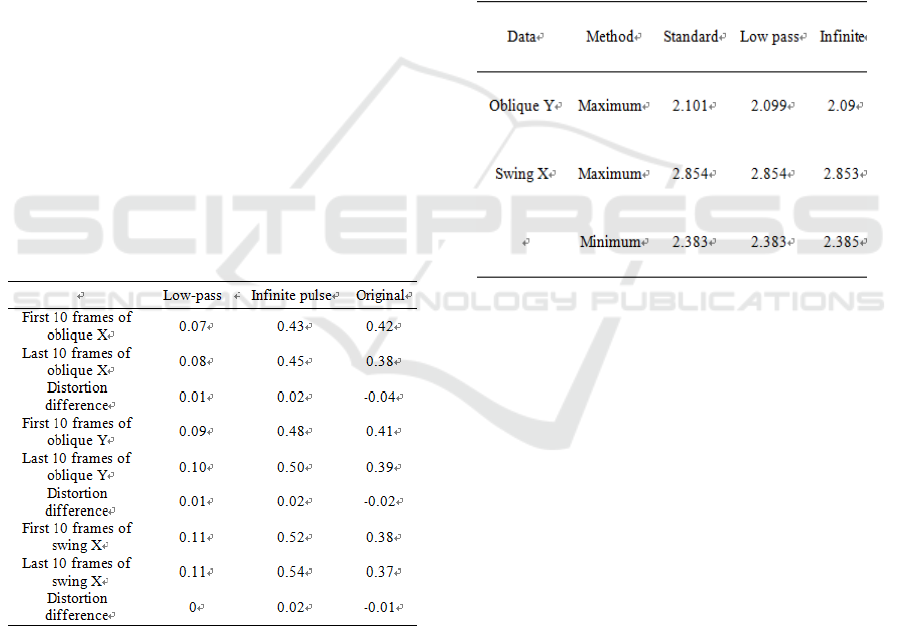
Table 5 :Comparison of beginning and end distortion after
filtering processing (unit: cm).
It can be seen from table 5 that the degree of
distortion of the beginning and the end was ranked
according to size as infinite pulse filter and low pass
filter. In the case that the filtered data was distorted
at the beginning of the original data sequence larger
than the end of the sequence, the distortion of the
end of the two filtered data was greater than the
beginning, and the distortion of low pass filter was
the smallest.
3.4The Influence on the Extremum
Generally, smoothing the data will have an effect on
the maximum and minimum[5]. Over smoothing
will weaken the extreme value, that is, the minimum
value will increase and the maximum value will
decrease. The higher the truncation frequency is, the
more extreme the value is weakened. Different
processing methods have different effects on the
extremum. In this study, these two filtering methods
(cut frequency of 8Hz) were used to compare the
extreme values obtained by smoothing the oblique Y
motion and the swing X motion data with extreme
values and the reference extreme values.
Table 6 The influence of different filtering methods on the
extremum (unit: meter).
(Due to only the Oblique Y motion had a
maximal value, and the swing X motion had
maximum and minimum in the data collected, so
only the three extremums were discussed)
It can be seen from the data in Table 6 that the
data of oblique Y motion reduced after the
processing of low-pass filter and infinite impulse
filter, and reduced a lot after the smoothing of
infinite impulse; as for thedata of swing X emotion,
the maximum and minimum was equal to the
standard after the processing of low pass filter, the
maximum after the processing of infinite impulse
filter became small and the minimum became large.
In the two filtering methods, the extremum-
keeping of the low pass filter was stronger and the
infinite impulse filter weakened the extremum
greatly.
4 CONCLUSIONS AND
SUGGESTIONS
Through the above analysis, the following
conclusions and suggestions are obtained:

4.1 Conclusions
In general, no matter what data is processed, the
performance of low-pass filtering is better; when
dealing with trigonometric data, there is basically no
difference between low-pass filtering and infinite
pulse filtering.
Low-pass filter can maintain a good phase,
infinite pulse filter phase delay more obvious
changes more slowly, the mutation of the data has a
stabilizing effect.
There are data distortion problems in both filters.
Generally, the distortion rate of the filter results at
the end of the sequence is slightly larger than the
distortion rate at the beginning.
Under the same cut-off frequency, the low-pass
filter has the ability to maintain the extreme value,
and the infinite pulse filter to the extreme weaken.
4.2 Suggestions
In particular, the need to deal with extreme
values of human motion data, to give priority to low-
pass filter, the data changes are relatively smooth to
consider using infinite pulse filtering.
Due to the continuity of human motion and given
that the data end distortion rate is higher than the
initial one, it is necessary to take some extra frames
after the action keyframes to reduce the error caused
by end-of-sequence distortion.
REFERENCES
1. Xu Kejun. Signal Analysis and Processing[M].
Beijing: Tsinghua University Press, 2006, 4
2. Zhang Xiaohong. Digital signal processing[M].
Beijing: Chian Machine Press, 2005, 1
3. Zhou Liqing,Su Fei. Basis of Digital Signal
Processing[M]. Beijing: Beijing University of Posts
and Telecommunications Press, 2005, 9
4. Cleve B.Moler.Numerical computing with
MATCAB[M].society for Industrial Applved
Mathematics . 2004.
5. Liu Weimin and others.Effect of Data Smoothing on
the Extremum in Kinematic Data--taking the digital
low pass filtering method as an example[J]. Shandong
Sports Science & Technology, 2000, 12 (4)
