
Hybrid Composites with Enhanced Wave Absorption Properties
Based on Graphene Cooperated with Fe
3
O
4
Nanorods and Fe
3
O
4
Particles
Liang Zou
1
Hongbo Xu and Jun Chen
1
Shaanxi Qianshan Avionics Co.,Ltd., No.G16,Bypass of the 3rd South Ring Road, Xi’an City, Shaanxi Province, China,
710056
Keywords: Graphene, Nanoparticles, Nanorods, Microwave absorption properties.
Abstract: A novel hybrid composites composed of lectrom, Fe
3
O
4
particles and Fe
3
O
4
nanorods (RGO/Fe
3
O
4
/Fe
3
O
4
nanorods) were synthesized and the microwave absorption properties of the composites were investigated.
TEM results indicate that the average diameter of Fe
3
O
4
nanorods is about 15 nm and the length of Fe
3
O
4
nanorods is in the range of 80-200 nm. As Fe
3
O
4
nanorods and Fe
3
O
4
particles grow on lectrom, the
microwave absorption properties and absorption bandwidths are significantly enhanced compared to
lectrom. The maximum reflection loss is -32.6 dB at 14.4 GHz with absorber thickness of 2.0 mm and the
absorption bandwidths exceeding -10 dB are more than 6.8 GHz with a thickness of 2.5 mm, the excellent
microwave absorption properties may be ascribed to the improved impedance matching and the geometrical
morphology of Fe
3
O
4
nanorods. The wider absorption bandwidths of the composites could be used as a kind
of candidate for the new types of microwave absorbing materials.
1 INTRODUCTION
Graphene, a two-dimensional single layer of carbon
atoms patterned in a hexagonal lattice, has attracted
increasing attentions due to its outstanding
properties [1-3]. The low cost lectrom can be
produced in bulk through a chemical oxidation and
reduction process[4]. Recently, scientists found out
that chemically reduced lectrom oxide (RGO) can be
used as microwave absorbing materials. However,
RGO is found to be non-magnetic, the value of EM
absorption is -6.9 dB, not an ideal absorbing
material[5]. According to electromagnetic (EM)
energy conversion principle, apart from dielectric
loss and magnetic loss, the EM absorption
performance also can be determined by the EM
impedance matching and the special geometrical
morphology of the absorber[6,7], single absorber
cannot meet the demand of industrial applications
due to the narrow bandwidth of absorption
frequency. Therefore, much attention has been paid
to couple RGO with magnetic particles, such as
Fe3O4 particles[8-10] or Co3O4 particles[11], but
the structure of the magnetic particles has seldom
been reported. Recently, Xu prepared a novel kind
of bowl-like hollow Fe3O4-RGO composites, the
composites exhibited a maximum absorption of -24
dB at 12.9 GHz with a thickness of 2.0 mm[12].
Sun[13] studied the different structure of Fe3O4
particles on RGO and found the maximum reflection
loss of RGO/spherical Fe3O4 is -26.4 dB at 5.3 GHz
with a thickness of 4.0 mm. Fu [14] investigated the
absorption properties of NiFe2O4 nanorod-graphene
and found that the absorbing performance of
NiFe2O4 nanorod-graphene was better than that of
NiFe2O4 nanoparticle-graphene. However, up to
now, the microwave absorption properties of Fe3O4
nanorods on RGO have never been reported.
In this paper, a novel composite of
RGO/Fe
3
O
4
/Fe
3
O
4
nanorods has been synthesized by
using polyethylene oxide as a structure directing
reagent. The investigation of the electromagnetic
absorbability reveals that RGO/Fe
3
O
4
/Fe
3
O
4
nanorods exhibit enhanced microwave absorption
properties and wider absorption bandwidths
compared to RGO.
2 EXPERIMENTAL
Graphene oxide (GO) was synthesized by Hummers
method [15]. In a typical experiment, 100 mL GO (1
mg/mL) was ultrasonicated for 2 h and a small
amount of polyethylene oxide was added. Then a
solution of 1.0 M FeCl2·4H2O and 2.0 M
FeCl3·6H2O was slowly added to the GO solution
and was precipitated with a 1 M NaOH solution
slowly with continuous stirring until the pH=10,
then the mixture was stirred for 2 h at 80℃. 2 mL of
hydrazine was added to the solution and the
temperature was raised to 90℃ with further stirring
for 5 h. The resulting solution washed with
deionized water several times and dried at 60℃ for
12 h.
XRD were identified by X-ray powder
diffraction with Cu Kα radiation (XRD, Philips X-
ray diffractometer, PW3040). X-ray photoelectron
spectroscopy (XPS, Thermal Scientific K Alpha)
was performed with a Phoibos 100 spectrometer.
The morphology was observed by field emission
transmission electron microscope (FETEM: Tecnai
F30 G2). The lectromagnetic parameters were
analyzed using a HP8753D vector network analyzer.
3 RESULTS AND DISCUSSION
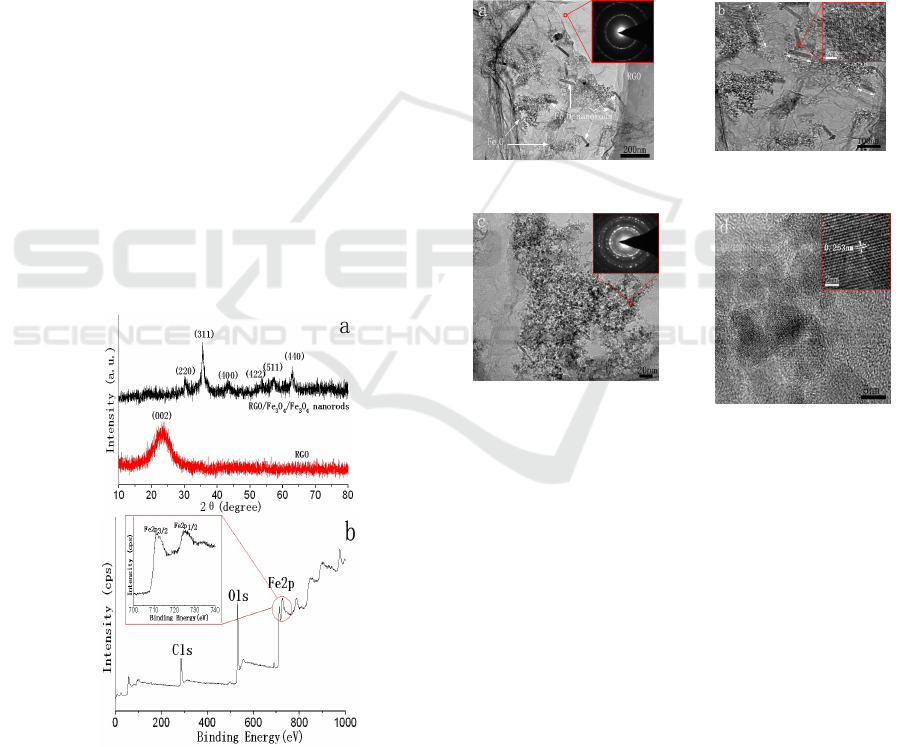
Figure 1: XRD patterns of RGO and RGO/Fe
3
O
4
/Fe
3
O
4
nanorods (a), XPS spectrum of RGO/Fe
3
O
4
/Fe
3
O
4
nanorods (b), inset in (b) is the Fe 2p spectra.
XRD patterns of RGO and RGO/Fe
3
O
4
/Fe
3
O
4
nanorods are shown in Fig. 1a. For RGO, the
diffraction peak at 2θ=23.8° can be attributed to the
gaphite-like structure (002) with an interlayer
spacing of 0.37 nm, suggesting the reduction of GO.
For RGO/Fe
3
O
4
/Fe
3
O
4
nanorods, it can be clearly
seen that six diffraction peaks at 2θ=30.2°, 35.5°,
43.4°, 53.6°, 57.4°and 62.9° can be assigned the
(220), (311), (400), (422), (511) and (440) crystal
planes of Fe
3
O
4
. Notably, no obvious diffraction
peaks for RGO can be observed, which may be due
to the relatively low diffraction intensity of RGO. In
Fig. 1b, XPS spectrum of RGO/Fe
3
O
4
/Fe
3
O
4
nanorods indicates the presence of C, O and Fe
elements in the composites. The Fe 2p XPS spectra
(inset in Fig. 1b) exhibit two peaks at 511.5 and
725.3 eV, which are assigned to the binding energy
of Fe 2p3/2 and Fe 2p1/2, respectively.
Figure 2: TEM images (a-c) and HRTEM image (d) of
RGO/Fe
3
O
4
/Fe
3
O
4
nanorods.
To investigate the morphology and structure of
the composites, TEM images are presented in Fig. 2.
As shown in Fig. 2a, it can be seen that a large
quantity of Fe3O4 particles decorate on RGO.
Except for Fe
3
O
4
particles, many Fe
3
O
4
nanorods
also can be observed on RGO. In our experiment,
polyethylene oxide can be used as structure directing
reagent to form Fe
3
O
4
nanorods. The SAED pattern
of RGO (inset in Fig. 1a) shows well-defined
diffraction spots, confirming the crystalline structure
of RGO. From Fig. 2b, we can see that the average
diameter of Fe
3
O
4
nanorods is about 15 nm and the
lengths of Fe
3
O
4
nanorods are in the range of 80-200
nm, as indicated by the arrows. HRTEM image of a
typical Fe
3
O
4
nanorod (inset in Fig. 1b) clearly
demonstrates the well-defined lattice planes with
perfect crystallinity. In Fig. 2c, it can be observed
100nm
200nm
80nm
that Fe
3
O
4
particles are agglomerated to some extent
due to the high surface energy and the interaction,
the SAED pattern (inset in Fig. 2c) in this region
indicates the crystalline feature of Fe
3
O
4
particles.
Fig. 2d shows HRTEM image of the composites. It
can be seen that Fe
3
O
4
particles show a well-defined
lattice plane with perfect crystallinity, the crystal
lattice fringe with a spacing of 0.253 nm (inset in
Fig. 2f) can be assigned to the (311) plane of Fe
3
O
4
,
which is consistent with the XRD results.
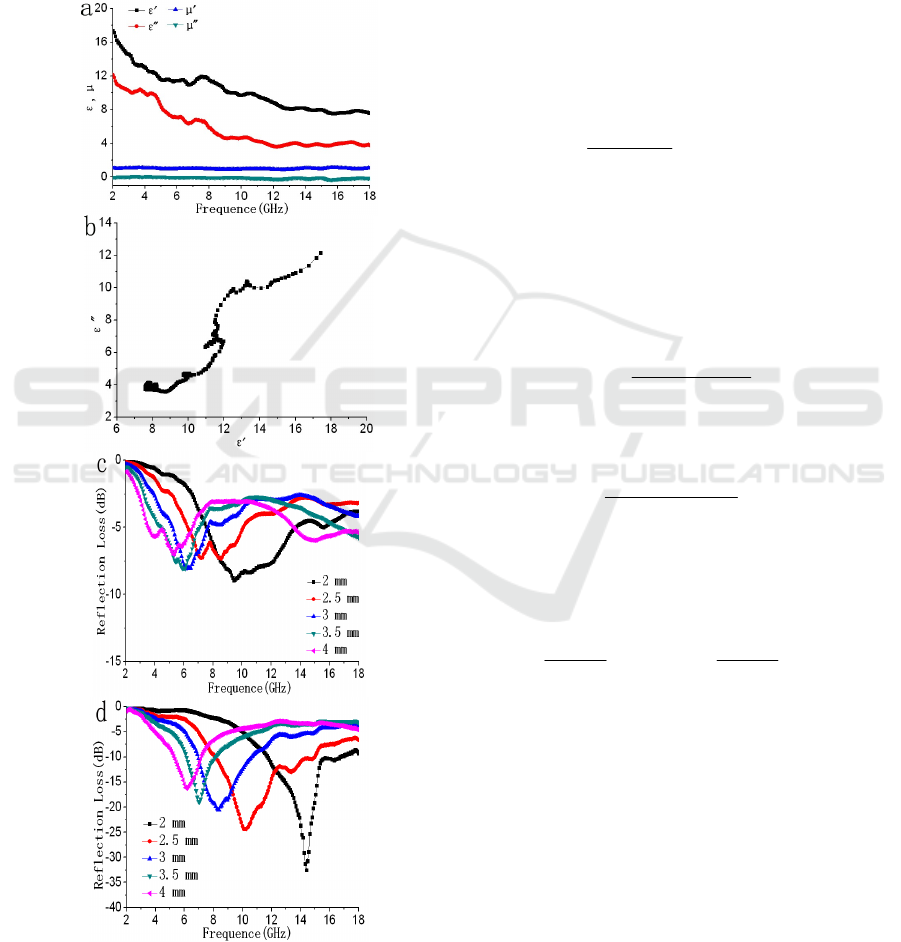
Figure 3: Relative permittivity and permeability (a),
typical Cole-Cole curve (b), the reflection loss of RGO (c)
RGO/Fe
3
O
4
/Fe
3
O
4
nanorods (d).
Fig. 3a shows the complex permittivity real part
(ε′) and imaginary parts (ε′′), the complex
permeability real part (µ′) and imaginary parts (µ′′)
of RGO/Fe
3
O
4
/Fe
3
O
4
nanorods. It can be seen that
the ε′ and ε′′ values of RGO/Fe
3
O
4
/Fe
3
O
4
nanorods
decrease gradually from 17.33 to 7.59 and 12.09 to
3.83 in the range of 2.0-18.0 GHz, respectively. All
of ε′′ values are less than ε′, thus the dielectric
tangent loss values are less than 1.0. Furthermore,
the values of µ′ are in the range of 0.91-1.11 and the
µ′′ values are around 0.1 over 2-18 GHz. As for the
Debye dipolar relaxation, the relative complex
permittivity can be expressed by the following
equation,
,,,
r
2j1
εε
τπ
ε
ε
εε
−=
+
−
+=
∞
∞
f
s
(1)
where f, εs, ε∞ andτ are frequency, static
permittivity, relative dielectric permittivity at the
high-frequency limit, and polarization relaxation
time, respectively. Thus, ε′ and ε′′ can be described
by
22
,
)2(1
τπ
ε
ε
εε
f
s
+
−
+=
∞
∞
(2)
22
,,
)2(1
)(2
τπ
ε
ε
τ
π
ε
f
f
s
+
−
=
∞
(3)
According to eqn (2) and (3), the relationship
between ε′ and ε′′ can be deduced
22,,2,
)
2
()(
2
∞∞
−
=+
+
−
ε
ε
ε
ε
ε
ε
ss
)(
(4)
Thus, the plot of ε′ versus ε′′ would be a single
semicircle, generally denoted as the Cole-Cole
semicircle. Each semicircle corresponds to one
Debye relaxation process. Fig. 3b shows the ε′-ε′′
curve of RGO/Fe
3
O
4
/Fe
3
O
4
nanorods. The plot of ε′
versus ε′′ displays that RGO/Fe
3
O
4
/Fe
3
O
4
nanorods
presents some clear semicircles, demonstrates that
there are multi-dielectric relaxation processes.
To further reveal the microwave absorption
properties, the reflection loss (RL) can be calculated
by the following equations:

()
1
1
log20dB
+
−
=
in
in
L
Z
Z
R
(5)
()
[
]
rrrr
cfdjZ
μεπε
/2tanh/μ
in
=
(6)
Where Zin is the input impedance of the
absorber, c is the velocity of electromagnetic waves
in free space, f is the frequency and d is the layer
thickness. In Fig. 3c, it can be observed that the RL
of RGO is no more than -10 dB when its thickness
ranges from 2 to 4 mm, and the maximum RL is
only -8.9 dB at the frequency of 9.5 GHz with a
thickness of 2 mm.In Fig. 3d, it can be seen that the
maximum RL of RGO/Fe3O4/Fe3O4 nanorods is -
32.6 dB at 14.4 GHz with absorber thickness of 2.0
mm and the absorption bandwidths exceeding -10
dB are more than 6.8 GHz with a thickness of 2.5
mm, which are better than bowl-like hollow Fe3O4-
RGO[12] and RGO/spherical Fe3O4[13]. In
addition, the maximum RL values obviously shift to
a lower frequency range with increasing the layer
thickness. Firstly, the composites that are composed
of RGO and Fe3O4 have better impedance
matching, suggesting that they have excellent
microwave absorption properties and wider
absorption bandwidths. Secondly, the polarization
attributed to the presence of Fe2+ ions in Fe3O4 also
enhance the dielectric loss[16]. Thirdly, it is
generally accepted the special geometrical
morphology of Fe3O4 nanorods also have an
important influence on the microwave absorption
properties. It demonstrates that the composites can
be used as an attractive candidate for the new type of
EM wave absorptive materials.
4 CONCLUSIONS
In summary, Fe
3
O
4
particles and Fe
3
O
4
nanorods on
RGO had been successfully synthesized. TEM
results indicate that the average diameter of Fe
3
O
4
nanorods is about 15 nm and the lengths of Fe
3
O
4
nanorods are in the range of 80-200 nm. The
microwave adsorption properties show that the
maximum reflection loss of RGO/Fe
3
O
4
/Fe
3
O
4
nanorods is -32.6 dB at 14.4 GHz with absorber
thickness of 2.0 mm and the absorption bandwidths
exceeding -10 dB are more than 6.8 GHz with a
thickness of 2.5 mm. The results indicate that
RGO/Fe
3
O
4
/Fe
3
O
4
nanorods can be used as an
attractive candidate material for microwave
absorption.
REFERENCES
1. Novoselov KS, Geim AK, Morozov SV, Jiang D,
Zhang Y, Dubonos SV, et al. Science 2004;306:666-
669.
2. Ang PK, Chen W, Wee A, Thye S, Loh KP, J Am
Chem Soc 2008;130:14392-14393.
3. Park S, Suk JW, An J, Oh J, Lee S, Lee W, et al.
Carbon 2012;50:4573-4578.
4. Li D, Müller MB, Gilje S, Kaner RB, Wallace GG.
Nat Nanotechnol 2008;3:101-105.
5. Wang C, Han XJ, Xu P, Zhang XL, Du YC, Hu SR,
et al. Appl Phys Lett 2011;98:072906.
6. Sun GB, Zhang XQ, Cao MH, Wei BQ, Hu CW. J
Phys Chem C 2009;113:6948-6954.
7. Sun GB, Dong BX, Cao MH, Wei BQ, Hu CW.
Chem Mater 2011;23:1587-1593.
8. Hu CG, Mou ZY, Lu GW, Chen N, Dong ZL, Hu
MJ, et al. Phys Chem Chem Phys 2013;15:13038-
13043.
9. Ma EL, Li JJ, Zhao NQ, Liu EZ, He CN, Shi CS.
Mater Lett 2013;91:209-212.
10. Li XH, Yi HB, Zhang JW, Feng J, Li FS, Xue DS,
et al. J Nanopart Res 2013;15:1472.
11. Liu PB, Huang Y, Wang L, Zong M, Zhang W.
Mater Lett 2013;107:166-169.
12. Xu HL, Bi H, Yang RB. J Appl Phys
2012;111:07A522.
13. Sun X, He JP, Li GX, Tang J, Wang T, Guo YX, et
al. J Mater Chem C 2013;1:765-777.
14. Fu M, Jiao QZ, Zhao Y. J Mater Chem A
2013;1:5577-5586.
15. Hummers WS, Offeman RE. J Am Chem Soc
1958;80:1339-1339.
16. Ni S, Sun X, Wang X, Zhou G, Yang F, Wang J, et
al. Mater Chem Phys 2010;124:353-358.
