
Drying Shrinkage Characteristics of Mortar Incorporating Different
Mineral Admixture
Fares Ali Ali Al-sairafi
1
, Jin Chen
1
,MinWei
1
, Yizhi Wang
1
and Peiqi Li
1
1
Jiangsu Key Laboratory of Coast Ocean Resources Development and Environment , Hohai University, NO. 1 Xikang Road
, Nanjing 210098, China
Keywords: Mineral Admixtures, Fly Ash, GGBS, Drying Shrinkage, Microstructure.
Abstract: This paper presents an experimental study of the effects of fly ash and ground granulated blast furnace slag
(GGBS) on drying shrinkage of mortar. Two equations that can reasonably predict the drying shrinkage
were also proposed. The test results reveal that mortar samples incorporating fly ash or GGBS exhibit
greater lower drying shrinkage compared to the plain sample. The drying shrinkage decreases significantly
with the increase in the fly ash content. While for GGBS, there is an optimal content of GGBS to restrain
drying shrinkage. The prediction equations for the shrinkage strain of fly ash and GGBS mortar were
proposed according to the dependent variable, which verified good accuracy compared to the test results.
1 INTRODUCTION
Drying shrinkage, one of the causes of cracks in
concrete structures, can be defined as the volumetric
change due to the drying of concrete (Zhang, et al.,
2015). If not appropriately considered in the design
state, the cracks can adversely affect the structural
performance when environmental conditions are
quite severe (e.g., high temperature, low humidity,
high wind velocity) (Zhang, et al., 2012). Therefore,
it is vital to study the shrinkage and shrinkage
compensation of cement mortar or concrete.
Many methods(Han, et al., 2016; Sonebi, et al.,
2015 have been proposed to restrain drying
shrinkage such as using fibers, expansion admixture,
mineral admixture, shrinkage reducing admixture
and so on. Mineral admixtures are the by-product of
some industries, which is specified as promoting
green procurement for the global environment.
Therefore, using mineral admixture such as fly ash
and GGBS to replace part of the cement is the most
economical and environmentally friendly method.
Research results showed that the concrete with
mineral admixture addition performed better in
reducing drying shrinkage and improving
workability compared to the plain concrete. Hu et al.
found that the most obvious advantage in adding fly
ash was not only a considerable reduction in
shrinkage cracking width, but also a significant
delay in first visible cracking. The shrinkage of
mortar containing 25% fly ash decreased 12.6% and
the initial cracking time was decreased by 28%
compared with the control mortar.
The experimental program in this study was
designed to assess the main drying shrinkage
behavior involving the addition of mineral
admixture. The objectives of this study are to (1)
clarify and comparison the influences of GGBS
powder and fly ash on the drying shrinkage
evolution of cement mortar, (4) propose equations
according to the dependent variable that can
reasonably predict the drying shrinkage behavior.
2 EXPERIMENTAL PROGRAMS
2.1 Materials
Jiangnan Onoda Cement Plant provided Portland
cement of Grade-52.5with a Bertrand specific
surface area of 365m2/kg and a density of
3.13g/cm3. The natural river sand was used as fine
aggregates. First grade fly ash, of fineness
modulus5.2%, with a specific surface of 457 m2/kg
and, density 2.22g/cm3produced by Huaneng
Thermal Power Plant production of primary fly ash
was used in this study. And the GGBS of
ZhongShan brand S95, of specific surface 425m2/kg
and of density 2.84g/cm3 obtained was used in the
experiment.
2.2 Mixing and Curing
The cement, river sand, fly ash or GGBS were
initially mixed dry in a mixer for about 2 minutes
until they were homogenous throughout. Then, the
entire amount of mixing water was added and the
mixing process lasted for another 3minutes, leading
to a total mixing period of 5 minutes. Finally, the
freshly mixed materials were cast in the molds and
vibrated by a mechanical vibrating table for about
1min. After that, the samples produced were cured
in air at 20 ± 3℃in molds covered by a polyethylene
film to prevent moisture loss. After 24 h, the
samples were removed from the molds and
transferred to a standard condition with T = 20 ±
3℃and RH = 50 ± 4% until the testing age.
In the current study, equivalent substitution
method was used to design mixing proportions. For
all mixtures, the mixing proportions of samples are
given in Table1.
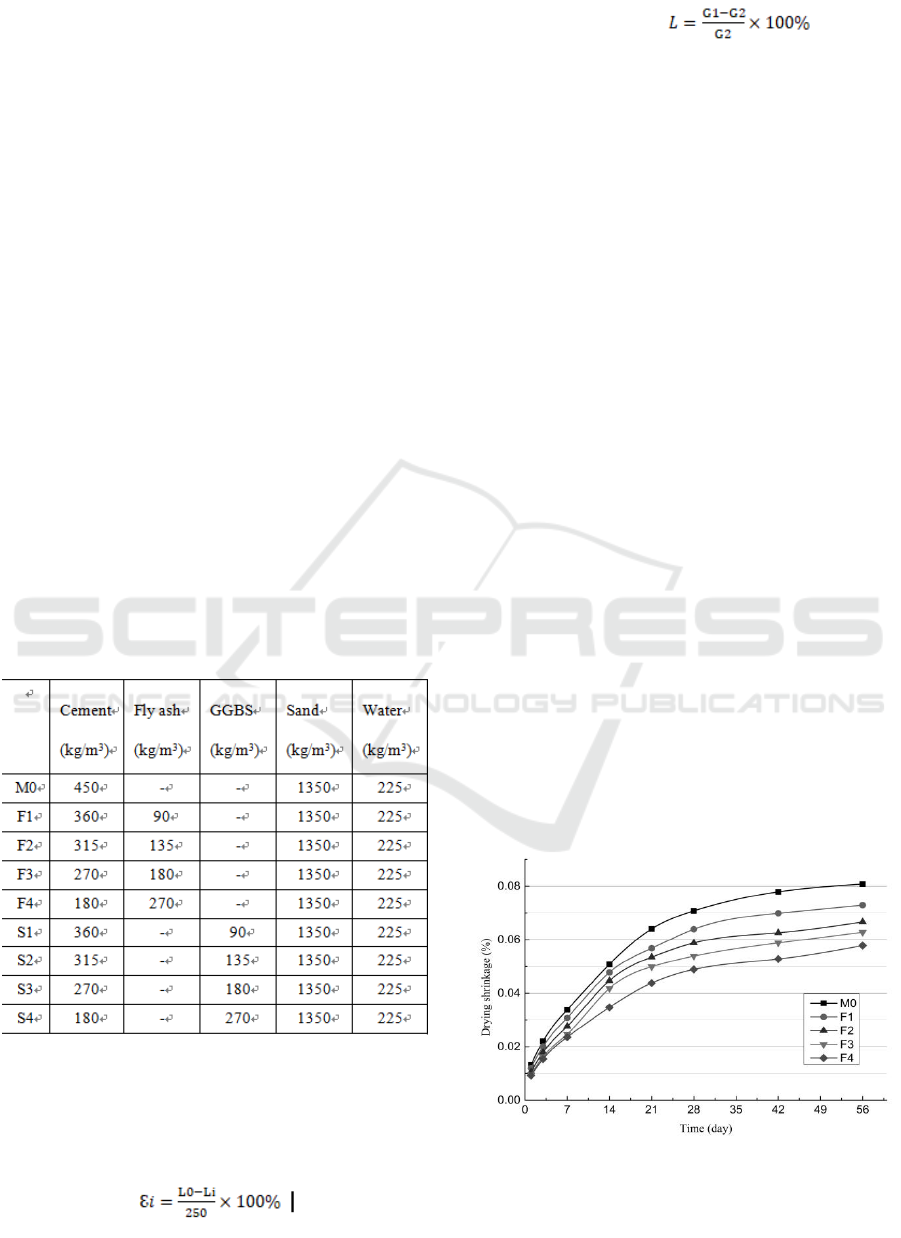
Table 1: The mix proportions of mortars with mineral
admixtures.
2.3 Testing Methods
The drying shrinkage is calculated from
following equations respectively:
(1)
(2)
where Si, ɛi and L are the mass loss rate, drying
shrinkage and loss on ignition of the mortar sample
respectively, W0 and L0 are the initial weight and
initial length and of sample respectively, Wi and Li
are the weight and length of sample after water loss
at different days respectively, G1 is the weight of
sample before combustion and G2 is the weight of
sample after combustion.
3 RESULTS AND DISCUSSION
3.1 The Influence of GGBS on Drying
Shrinkage of Mortars
The drying shrinkage of cement mortars that
increase with the age is presented in Fig.2. It can
been observed that when the replacement amount of
fly ash is 90kg/m3, 135kg/m3 and 180kg/m3, the
drying shrinkage of mortar is 0.0639%, 0.0588%
and 0.0539%,respectively, compared with the plain
sample 0.0708% at 28 days. The obtained results
show that the drying shrinkage of mortar decreases
evidently with the increasing content of fly ash. This
is mainly due to the content of cement reduces and
content of fly ash increases in mortar incorporating
fly ash. The hydration rate of fly ash is slower, so
the hydration rate of mortar incorporating fly ash
decreases. Moreover, the unreacted fly ash particles
play a role to keep a stable skeleton and restrain
deformation, which decreases the drying shrinkage
of mortar significantly.
Fig. (a)
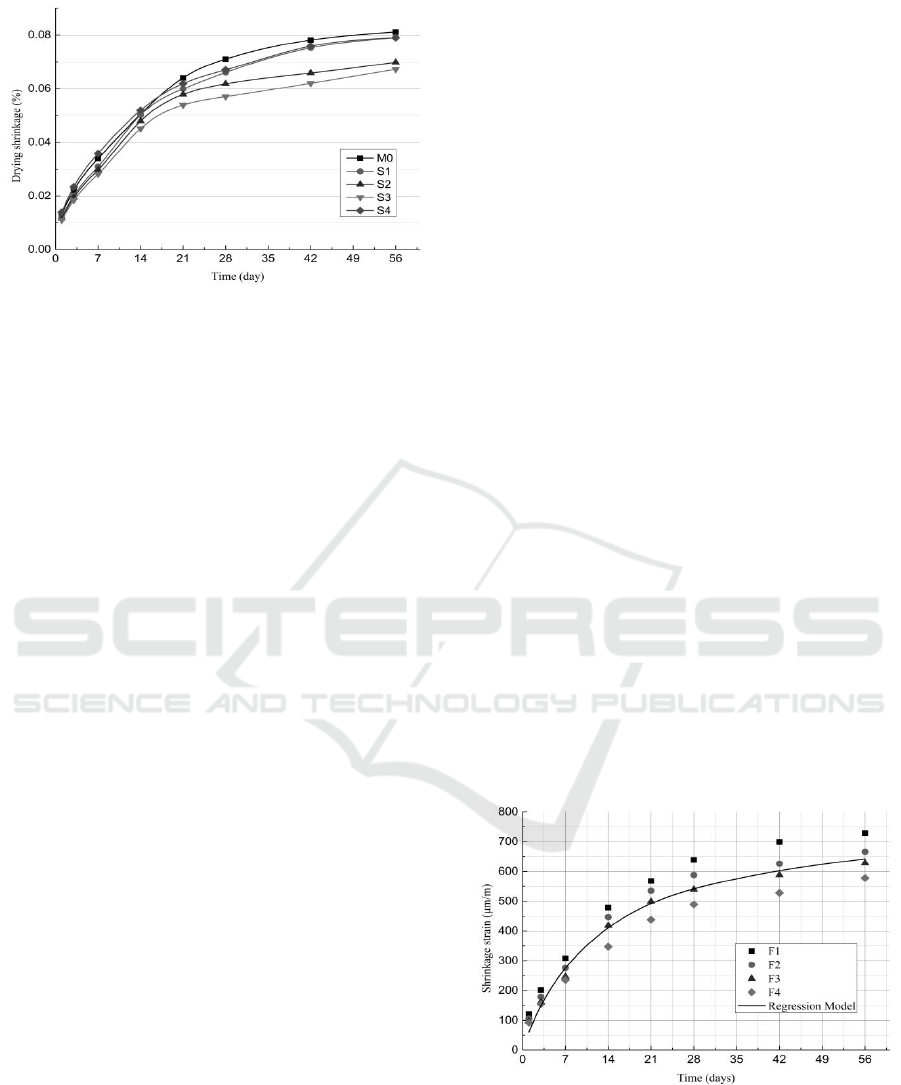
Fig. (b)
Fig.1: The effect of mineral admixture on the drying
shrinkage of mortars: (a) fly ash and (b) GGBS.
Similarly, Fig.1 (b) shows that the drying
shrinkage of mortar decreases with the increase of
the replacement amount of GGBS within a certain
range. When the replacement amount of GGBS is
90kg/m3. 135kg/m3 and 180 kg/m3, the drying
shrinkage of mortar is 0.0660%, 0.0618% and
0.0570%, respectively, compared with the plain
sample with a drying shrinkage of 0.0710% at 28
days. However, the drying shrinkage of mortar is
0.0670% at 28 days when the replacement amount of
GGBS is 270kg/m3, which is slightly higher than
that of the replacement amount of 135 kg/m3 and
180 kg/m3. The results reveal that there is an
optimal content of GGBS to restrain drying
shrinkage. It can be explained that the GGBS has
potential activity and using the GGBS to replace
cement will decrease the content of cement thus the
total hydration rate of products of cementations
materials will change. Furthermore, the part of the
unreacted GGBS particles plays a role of micro-
aggregate which restrains the drying shrinkage.
However, when the content of GGBS exceeds a
certain amount, the ability of autogenous shrinkage
of mortar exceed the ability to restrain drying
shrinkage of GGBS causing the drying shrinkage of
mortar to increase, but is still lower than that of
mortar without mineral admixture. This
phenomenon has been analyzed by some previous
research, which indicated that autogenous shrinkage
of mortar incorporating GGBS increased with the
increase content of GGBS. Tazawa et al. reported
that the autogenous shrink age of mortar relatively
rapid increased with the amount increasing of GGBS
when the replacement content of GGBS between of
50 ~ 70%.
3.2 Shrinkage Model
Quantification of concrete shrinkage allows the
designer to design concrete that meet the
construction requirements based on the shrinkage
model. So it is necessary to find the most suitable
shrinkage model. There have been some American
and European empirical models that predict the
shrinkage strain of Portland cement concrete. These
models were developed and calibrated based on
some experimental measurements involving
different types of concrete mixes. The objective of
these models was to predict the long-term shrinkage
strain based on few short-term measurements. There
are two well-known models, ACI 209 and CEB-FIB
1990 that were considered in this study to validate
and/or adapt their use for compared cement mortar.
Fernandez-Gomez and Lands berger confirmed that
these methods were applicable.
3.2.1 56 Days Shrinkage Measurements
Shrinkage of the four mortar samples shown in
Table 3 were monitored over a 56 days period and
the results are shown in Fig.1. In those figure, the x-
axis represents the age of the samples at which the
shrinkage measurement are taken, while the y-axis
shows the measured shrinkage strain for the different
samples. Fig.1 (a) shows that the shrinkage strains of
fly ash mortar for the four samples were in the same
order of magnitude and varied between 570 and
730μm/m for an age of 56 days. The figure shows
also that shrinkage strain increases rapidly during 56
days. Fig.1 (b) indicates that the GGBS mortar has
similar tendency.
Fig. (a)
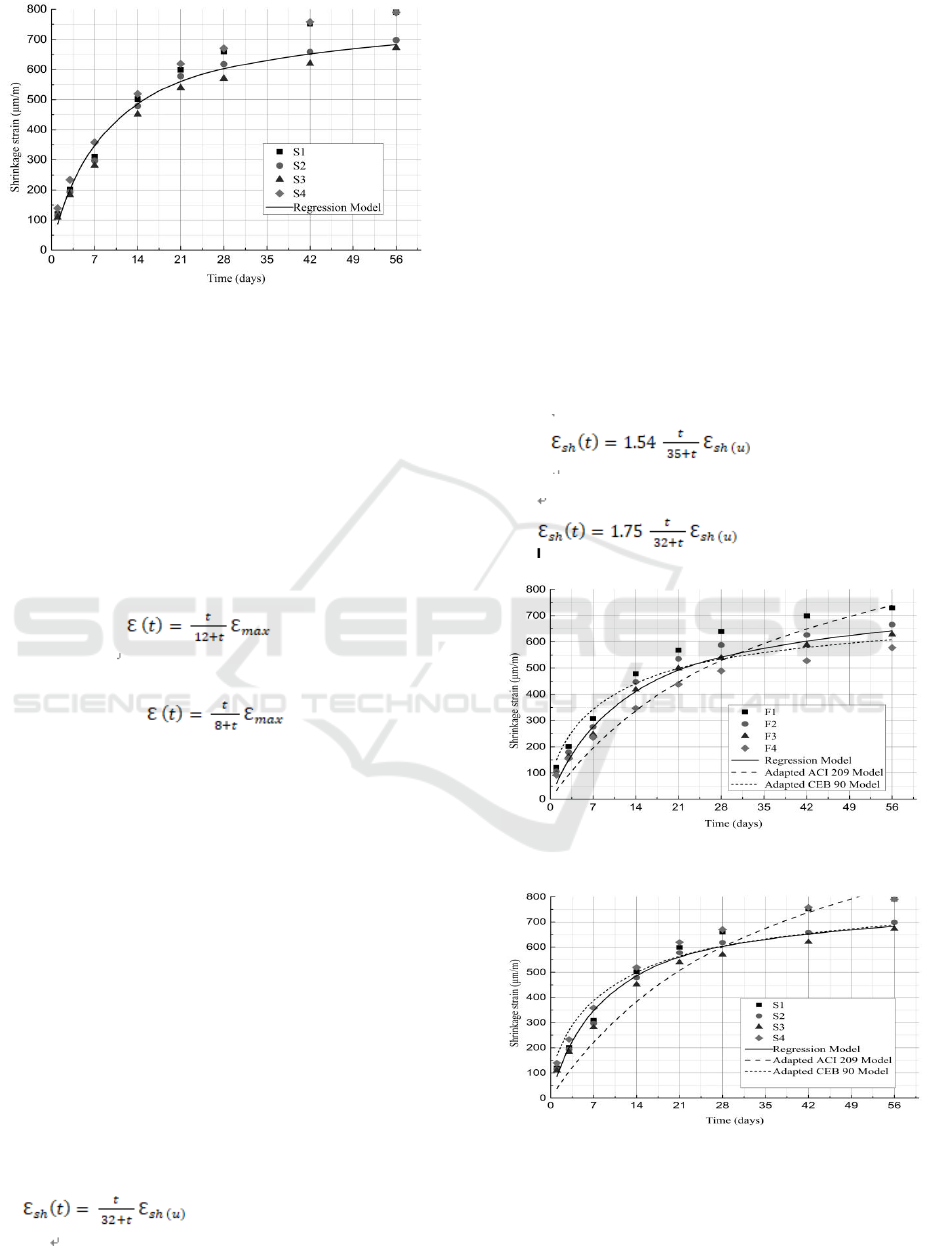
Fig. (b)
Fig.2: Average measured shrinkage strain over a 56 days
period: (a) fly ash and (b) GGBS.
Since the four mixes presented roughly the same
trend for their shrinkage strain evolution with
respect to time, two regression models were
developed to fit all measured date. For mortar
incorporating fly ash and GGBS, the models are
shown by solid curve in Fig.2 (a) and (b) and are
represented by Equation(3) and Equation(4).
(3)
(4)
Where t is the mortar concrete age in days, and
ɛmax represents the long-term shrinkage strain,
which is found to be equal to 780μm/m. For fly ash
mortar, the model had a coefficient of determination
R2 of 0.997 and a standard error of 20μm/m. For
GGBS mortar, with a coefficient of determination
R2 of 0.990 and a standard error of 34μm/m was
obtained. These mean that Equation(3) and Equation
(4) describe well the shrinkage behaviour of mortar
incorporating fly ash or GGBS.
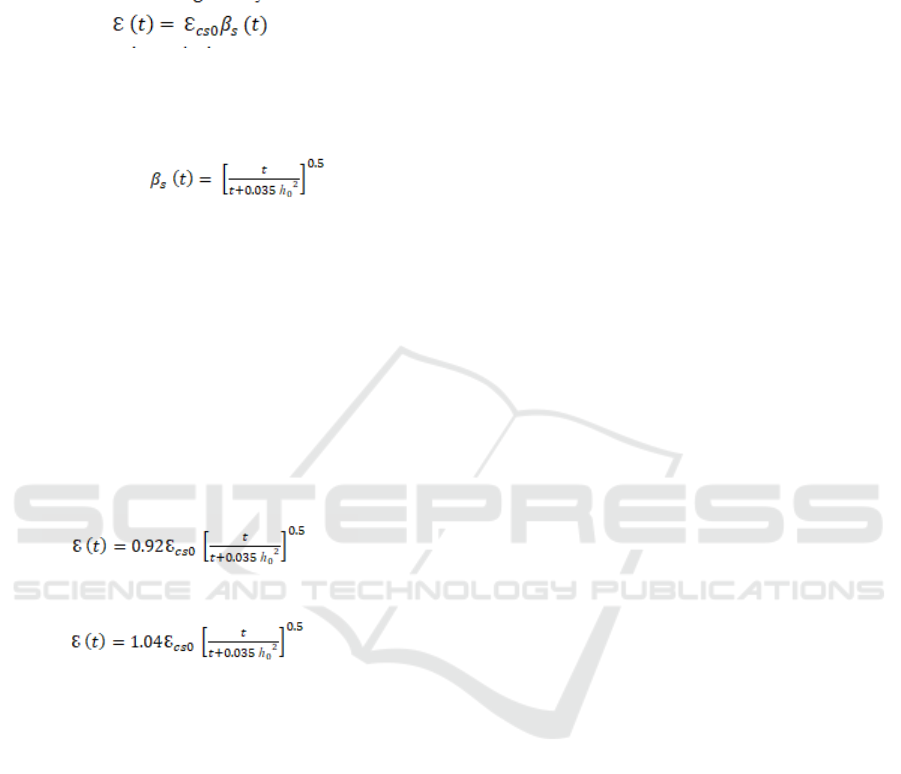
3.2.2 ACI 209 Shrinkage Model
The American Concrete Institute proposed the
ACI 209 shrinkage model in 1992. The shrinkage
strain as a function of time, ɛsh (t), is calculated as
follows:
(5)
Where ɛsh(u) is the ultimate shrinkage strain,
which is equal to 780μm/m for ordinary Portland
cement concrete. The Portland cement concrete ACI
209 model did not fit well with mortar incorporating
fly ash or GGBS experimental shrinkage date.
However, when two correction factor of 1.54 for fly
ash mortar and 1.75 for GGBS mortar were applied
to the model, the corrected ACI 209 model fit well
the measured experimental data as shown in Fig.3
(a) and (b). Therefore, for mortar incorporating fly
ash or GGBS, the adapted ACI 209 model could be
represented by Equation (6) and Equation (7). The
calculated coefficient of determination, R2 ,for this
model of fly ash mortar was 0.986 while the
calculated standard error was 67μm/m , for GGBS
mortar, the model had a coefficient of determination
R2 of 0.986 and a standard error of 79μm/m.
(6)
(7)
Fig. (a)
Fig. (b)
Fig.3: Experimental shrinkage data with developed
prediction models: (a) fly ash and (b) GGBS.
3.2.3 CEB 90 Shrinkage Model
For CEB-FIP model, the shrinkage strain as a
function of time is given by
(8)
Where t is the concrete age in days, ɛcs0 is the
ultimate shrinkage strain, and βs (t) is given by
Equation (9).
(9)
Where h0 is the effective thickness of the
specimen in mm. Two correction factor of 0.92 for
fly ash mortar and 1.04 for GGBS mortar were
applied to the model, the adapted CEB-FIP model
could be represented by Equation(10) and
Equation(11). The calculated coefficient of
determination, R2 , for this model of fly ash mortar
was 0.992 and the calculated standard error was
49μm/m, for GGBS mortar, the model had a
coefficient of determination R2 of 0.993 and a
standard error of 51μm/m.
(10)
(11)
3.2.4 Interpretation of Results
The figures from Fig.3 (a) and (b) show that the
measured experimental date and the three models
developed to fit the date. It is noted that the two
regression models predict better the average
measured shrinkage strain over time than the
ordinary Portland cement concrete adapted models.
This observation is proved by the calculated
standard errors of three models. For fly ash or
GGBS mortar, the regression models had the lowest
standard error of 20μm/m and 34μm/m, respectively.
4 CONCLUSIONS
The mortar samples incorporating fly ash or GGBS
exhibits greater lower drying shrinkage compared to
that of the mortar samples without mineral
admixture.
The result shows that the drying shrinkage of
mortar decreases obviously with the increasing
content of fly ash. While there is an optimal content
of GGBS to restrain drying shrinkage, a replacement
content of 180kg/m3for GGBS, the sample presents
the lowest drying shrinkage. The drying shrinkage
became greater with the increase in water
evaporation. A greater mass loss resulted in a greater
drying shrinkage.
Shrinkage strain of mortar incorporating fly ash
or GGBS could be predicted using the well-known
ACI 209 and CEB 90 shrinkage models after
applying minor correction factors. Two rational
equations (Equation (3) and Equation (4)) can
predict the shrinkage strain of mortar incorporating
fly ash or GGBS. And two regression models predict
better than the ACI 209 and CEB 90 shrinkage
models.
REFERENCES
1. Han J G, Jia D, Yan P Y. 2016. Understanding the
shrinkage compensating ability of type K expansive
agent in concrete. Journal of
construction and building materials, 116, pp 36-44.
2. Sonebi M, Garcia-Taengua E, Hossain K M A, Khatib
J, Lachemi M. 2015. Effect of nanosilica addition on
the fresh properties and shrinkage of mortars with fly
ash and superplasticizer Journal of construction and
building materials. ,85, pp 269-276.
3. Zhang W Y, Hama Y, Na S H. 2015. Drying shrinkage
and microstructure characteristics of mortar
incorporating ground granulated blast furnace slag and
shrinkage reducing admixture. Journal of construction
and building materials, 93, pp267 – 277.
4. Zhang W, Zakaria M, Kishimoto Y, Hama Y. 2012.
Drying shrinkage and microstructure characteristics of
ground granulated blast furnace slag-cement mortar.
Journal of construction and building materials, 34 pp
388-393.
