
The Microstructure and Hardness of ZrO2
R
einforced 24CrNiMoY
Alloy Prepared by SLM
Chaofan Shi
1
, Suiyuan Chen
1*
, Qing Xia
1
and Zhuang Li
1
1
Key Laboratory for Anisotropy and Texture of Materials, Ministry of Education, Key Laboratory for Laser Application
Technology of Liaoning Province. School of Materials and Engineering, Northeastern University, Shenyang, Liaoning,
China
Keywords: Selective laser melting, Brake disc, 24CrNiMoY steel, Microstructure, Hardness.
Abstract: In this paper, 1.5% ZrO
2
was added in 24CrNiMoY alloy steel powder to form a composite powder, and the
alloy steel sample was prepared by selective laser melting technology. Effects of different laser power and
scanning speed on the microstructure and hardness of the fabricated sample were studied by OM, XRD,
SEM and hardness test. The results show that when the optimized laser power is 1700 W and scanning
speed is 10mm/s, the phase structure is composed of martensite, bainite, ferrite and carbide. The
microstructure is uniform and fine, there are no cracks in the fabricated sample, the porosity is 0.96%. The
average hardness is 467 HV, ZrO
2
plays a role on improving the hardness. The alloy steel sample prepared
by SLM has a fine microstructure and high hardness, which provides a basis for laser additive
manufacturing of high-speed brake disc.
1 INTRODUCTION
High-speed rail brake discs are one of the key parts
that guarantee the safe operation of high-speed rails.
Many studies have focused on the manufacturing of
brake discs [1, 2]. At present, the rail brake discs are
mainly prepared by traditional methods of casting,
forging and heat treatment. This method has some
problems such as high manufacturing cost,
complicated heat treatment process, limited
mechanical processing equipment [3]. Selective
laser melting is a new technology for the preparation
of complex metal parts. It has the characteristics of
rapid manufacture, and the structure and
performance can be designed and controlled [4, 5].
Therefore, SLM is one of the main research
directions to prepare the brake disc with high
hardness.
Zirconia is a good reinforcement phase, and its
strengthening mechanism has been explored in a
variety of papers. Lei et al. [6] used plasma spraying
to prepare HA-30% ZrO
2
coating layer. Compared
to the pure coatings, microhardness and wear
resistance were improved. Gao et al. [7] studied the
effect ZrO
2
content on the properties of Cu-ZrO
2
composites. The results show that when the ZrO
2
content was 7%, the hardness and tensile strength
are significantly improved. However, the
strengthening and toughening mechanism of
zirconium oxide in 24CrNiMoY alloy steel has not
been studied.
24CrNiMo alloy steel is the main material for the
preparation of high-speed rail brake discs, which has
the advantages of stable friction characteristics and
good wear resistance at high temperature. In our
previous studies, the hardness of the 24CrNiMo
alloy steel fabricated by SLM technology is 346 HV
[8], its hardness is not enough to meet the surface
material requirements of brake discs. So we used the
vacuum induction melting atomization method to
prepare 24CrNiMo steel powder with yttrium added
firstly. Then, the laser power and scanning speed
was optimized to fabricated 24CrNiMoY steel with
ZrO
2
. The purpose is to provide a theoretical basis
for the preparing of high-speed rail brake discs via
SLM.
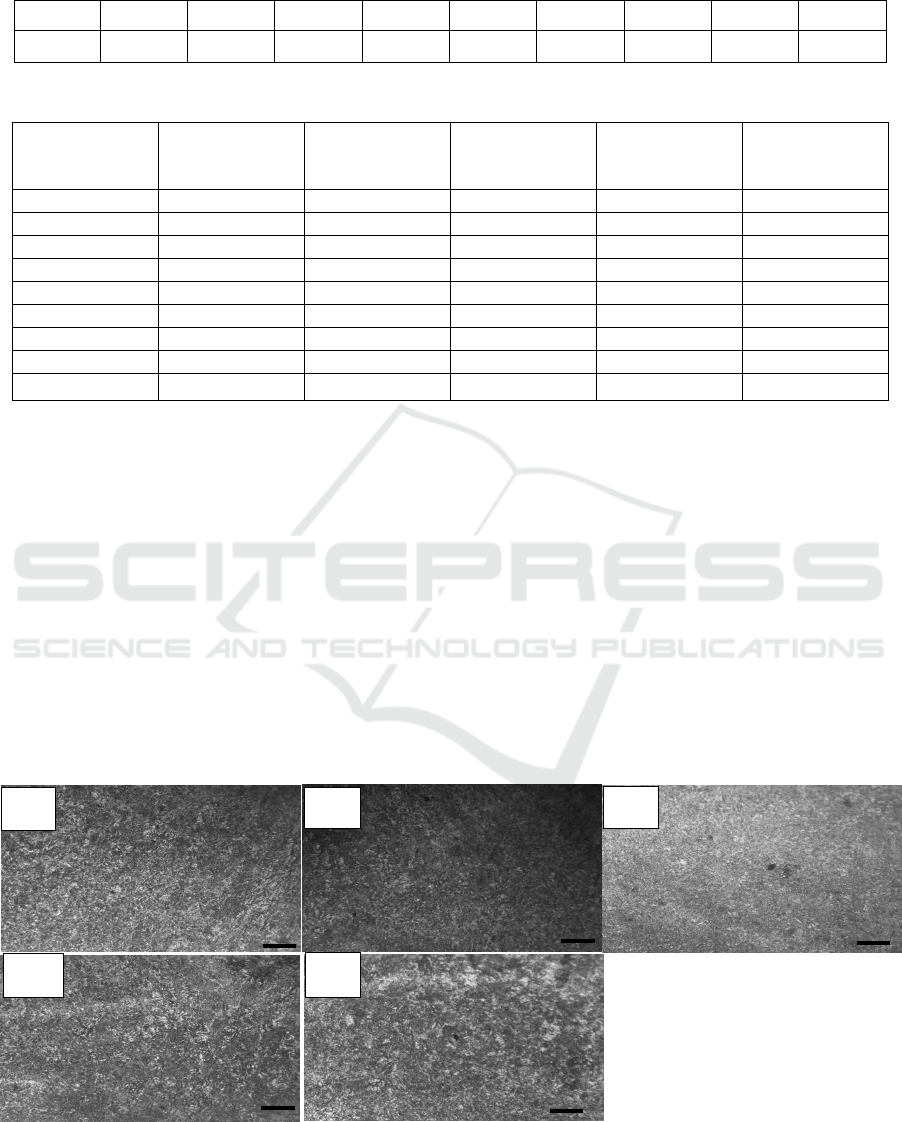
Table 1: The alloy composition of each element.
Table 2: Parameters of the fabricated sample process.
2 EXPERIMENTAL
MATERIALS AND METHODS
2.1 Experimental Materials
The substrate material was Q235 steel. Before the
experiment, the surface of Q235 steel plate with
dimensions of 100 mm × 100 mm × 10 mm was
polished to a roughness of Ra 6.5. The composite
powder used for SLM is 24CrNiMoY powder
containing 1.5% ZrO
2
. The composition of
24CrNiMo powder is shown in Table 1. Composite
powder were ball milled using the QM-5 Roller Ball
Mill.
2.2 Experimental Methods
The prepared alloy steel powder is uniformly spread
on the substrate, and the laser scanning path is
controlled to completely melt the powder layer.
After each layer is melted, the forming cylinder is
lowered by one powder layer thickness, re-powdered
and the laser is then completely melted according to
a present path. In this experiment, different layers of
laser scanning paths were perpendicularly
intersected to reduce defects in the laser cladding
process. The specific process parameters are shown
below.
Figure 1: Fabricated sample morphology under different scanning speed. (a) S1 Sample, (b) S2 Sample, (c) S3 Sample, (d)
S4 Sample, (e) S5 Sample.
element Fe C Cr Ni Mo Mn O Si Y
wt.% 94.74 0.24 0.89 0.937 0.503 0.989 0.02 0.382 1.3
Sample
Numble
Overlap
ratio
(%)
Powder
thickness
(mm)
Spot
diameter
(mm)
Scanning
speed(mm/s)
Power
(W)
S1 35 0.4 4 7 1800
S2 35 0.4 4 8 1800
S3 35 0.4 4 9 1800
S4 35 0.4 4 10 1800
S5 35 0.4 4 11 1800
B1 35 0.4 4 10 1600
B2 35 0.4 4 10 1700
B3 35 0.4 4 10 1900
B4 35 0.4 4 10 2000
(e)
200μm
(a)
200μm
(b)
200μm
(d)
200μm
(c)
200μm
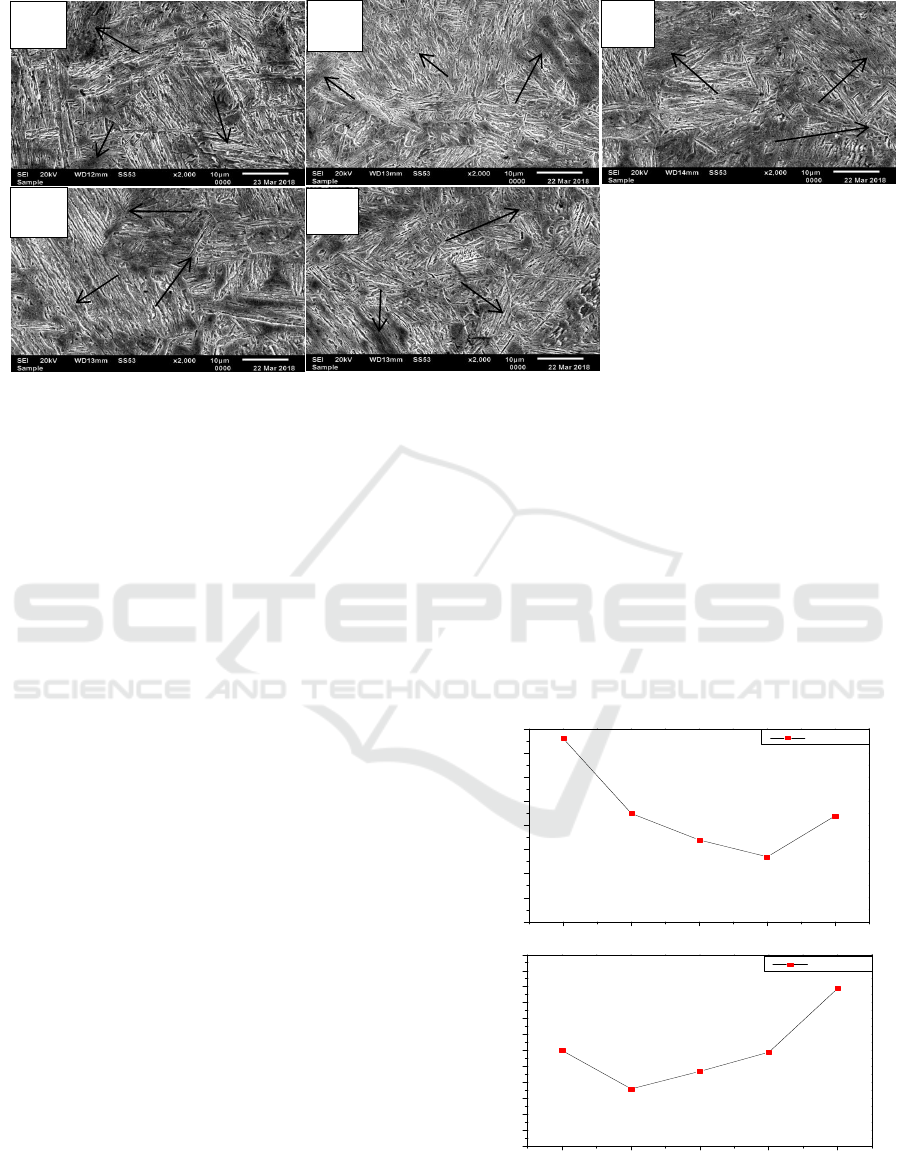
Figure 2. SEM figures of specimens at different laser power. (a) B1 Sample, (b) B2 Sample, (c) S4 Sample, (d) B3 Sample,
(e) B4 Sample.
3 EXPERIMENTAL RESULTS
AND ANALYSIS
3.1 Effect of Scanning Speed on
Microstructure of the Fabricated
Sample
Figure 1 shows the metallographic images of the
cladding layer at different scanning speeds. It can be
seen from the metallographic image that when the
power and other process parameters are kept
constant, with the change of scanning speed, the
number and size of pore defects in the fabricated
layer have changed.
3.2 Effect of Power on SEM Pictures of
the Fabricated Sample
Figure 2 shows the SEM images of the alloy steel
cladding layer under different power. The SEM
images show that the phase composition of the
cladding layer under different power conditions are
martensite, lath bainite and ferrite. During the
cooling process of high-temperature austenite,
proeutectoid ferrite (PF) grows first at the austenite
grain boundary nucleation. Since laser cladding is a
rapid cooling process, when austenite is subcooled
to the bainite and martensite transformation
temperatures, most of the carbon is dissolved in
alpha ferrite, so bainite and martensite grows inside
austenite crystals.
3.3 Effects of Laser Power and
Scanning Speed on Porosity and
Hardness of Fabricated Sample
It can be seen from Figure 3 that when the laser
power of 1800 W. When the scanning speed is
10mm/s, The porosity of the coating reached a
minimum of 1.07%. And at the scanning speed of
10mm/s, when the laser power is 1700 W, the
porosity of the fabricated sample reached a
minimum of 0.96%.
Figure 3: Porosity rate under different scanning speed and
laser power.
7891011
0.8
0.9
1.0
1.1
1.2
1.3
1.4
1.5
1.6
Porosity(%)
Scannin
g
s
p
eed
(
mm/s
)
Porosity
16001700180019002000
0.6
0.7
0.8
0.9
1.0
1.1
1.2
1.3
1.4
1.5
1.6
1.7
1.8
Porosity (%)
Laser power (W)
Porosity
(a)
lath Bainite
Martensite
PF
10μm
(d)
lath Bainite
Martensite
PF
10μm
(e)
lath Bainite
Martensite
PF
10μm
(b)
10μm
(c)
Martensite
PF
10μm
lath Bainite
Lath Bainite
Martensite
PF
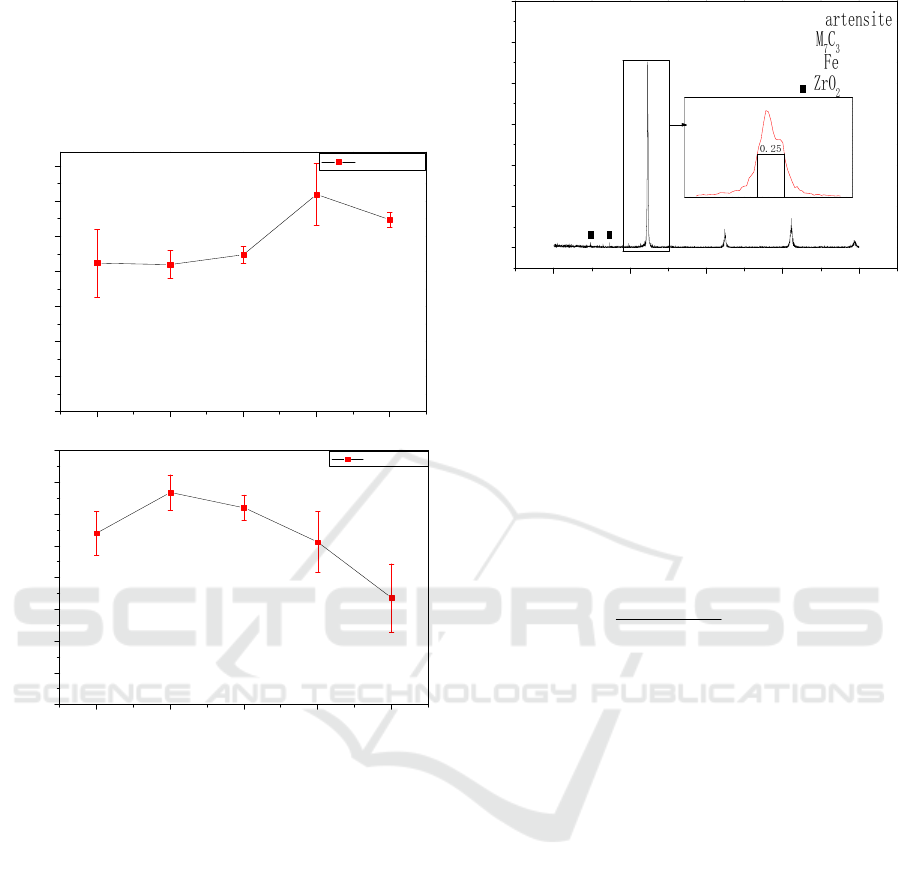
Figure 4 shows the hardness of the forming layer
at different scanning speeds and laser powers. When
the laser power is 1800 W, the fabricated sample has
the highest hardness when the scanning speed is 10
mm/s, and when the scanning speed is determined as
10 mm/s, With the power of 1700 W, the fabricated
sample has the highest hardness.
Figure 4: Microhardness of the fabricated sample at
different laser power and scanning speed.
Based on the above analysis of the porosity and
hardness of the fabricated sample, the optimum
power for the SLM process is 1700 W, and the
optimal scanning speed is 10 mm/s. The porosity of
the fabricated sample under optimal parameters is
0.96% and the hardness is 467 HV.
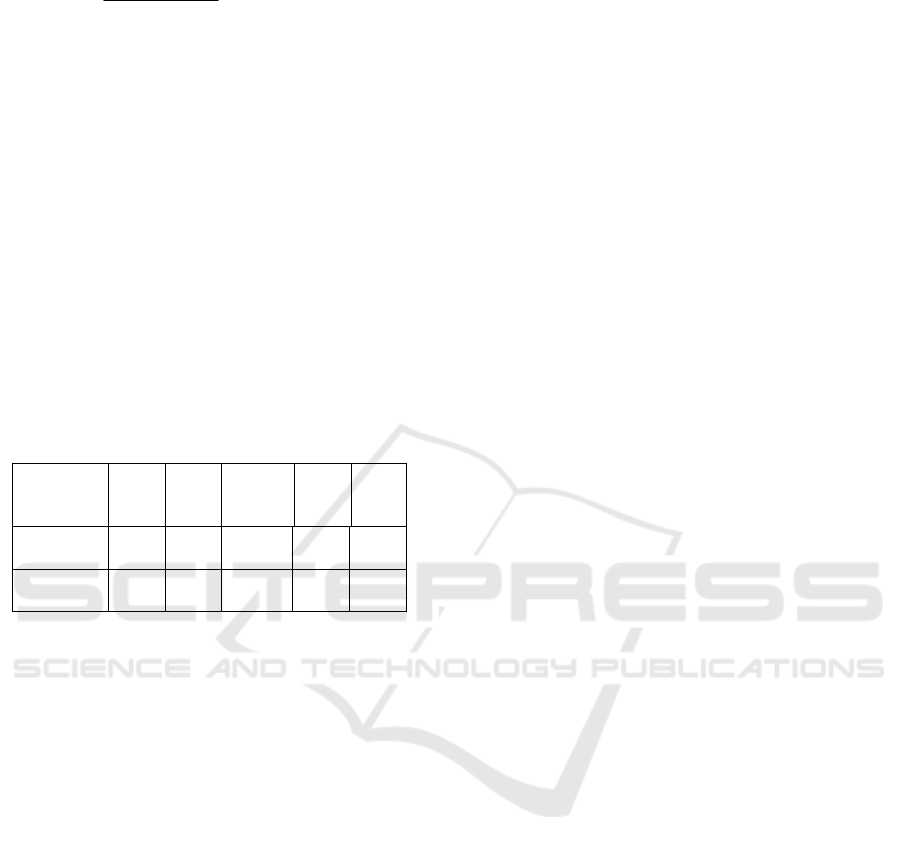
Figure 5 shows the XRD pattern of the fabricated
sample when the laser power is 1700 W and the
scanning speed is 10mm/s. It can be seen from the
pattern that the main phase of 24CrNiMoY alloy
steel is α-Fe(M), and M represents the element C,
Cr, Ni, Mo, etc. in the alloy steel. Pre-eutectoid
ferrite PF is α-Fe phase with a solid solution carbon
content of 0.0218% or less. lath bainite is composed
of bainitic ferrite BF phase and carbide phase M
7
C
3
.
Martensite is a supersaturated solid solution of C in
α-Fe.The peak of zirconia can also be seen, zirconia
is dispersed in the alloy steel as a compound.
20 40 60 80 100
0
100
200
300
400
500
600
I
n
t
ens
it
y
(
a.u.
)
2
θ
(deg)
•⎯
Μ
♦⎯
⎯
⎯
♦
♦
♦
•
•
•
(b)
(a)
α
Figure 5: XRD pattern of cladding layer with laser power
of 1700 W.
3.4 Analysis and Discussion of
Experimental Results
The main process parameters that affect the quality
of the fabricated sample include laser power P,
scanning speed V, spot diameter D, overlap ratio
W, and powder coating thickness H. The energy
absorbed per unit volume of the cladding layer is
generally expressed according to formula (1).
VHWD
P
E
)1( −
=
(1)
When the laser power is 1600 W, the laser
radiation energy is too low, and the energy volume
density per unit area of the molten pool is not
enough, resulting in insufficient melting of the
powder and increasing the probability of generating
porosity in the fabricated sample. When the laser
power increases to a certain threshold (1700 W in
the experiment), as the energy density increases,
the depth of the molten pool increases, and the
surrounding metal liquid flows to the porosity so
that the number of pore is reduced. When the
output power of the laser is is too high, a large
amount of matrix material will be melted so that
the dilution of the alloy of the cladding layer will
increase, the stirring of the molten pool will
intensify, and the elements of the matrix element
and the fabricated sample will mutually diffuse.
Resulting in increasing chance of causing
porosity.The XRD diffraction peak width can be
used to determine the grain size. If the grain size is
small, the diffraction direction will be diffused,
which cause a broadening of the diffraction peaks
[9]. Therefore, the crystal grain size can be judged
by the broadening analysis of XRD diffraction
peaks.
7891011
300
325
350
375
400
425
450
475
Hardness (HV)
Scanning speed (mm/s)
Hardness
1600 1700 1800 1900 2000
300
325
350
375
400
425
450
475
500
Hardness(HV)
Power(W)
Hardness
(
2
)
The value of k is generally taken as 0.89. It can
be seen from formula (2) that the larger the half-
height width hkl, the smaller the grain size Dhkl.
Figure 5(b) shows the analysis of the XRD
diffraction peaks at a power of 1600 W cladding. In
accordance with the same method for the analysis of
XRD diffraction peaks at other powers, the results
are shown in the table. It can be seen from the table
that as the power increases, the half-width of the α-
Fe diffraction peak first increases and then
decreases, indicating that when the power is from
1700 W to 1800 W, the grain refinement is more
obvious.
Table 3: XRD diffraction peak half-height widths of the
fabricated sample at different power.
The grain size under different powers was
calculated by Image software. The grain size first
decreased with increasing power and then increased,
the grain size reaches a minimum at 1700 W. When
the laser power is low, the absorbed heat in the
molten bath is relatively reduced, the dilution of the
fabricated sample is small, and the Fe element of the
substrate is less in the cladding layer, so the content
of (NiFe) in the cladding layer is low, and the
carbide is hard, the higher content of the phase and
the tendency to agglomerate to form larger needle-
like and strip-like hard phases, as a result of which
the grain size of the microstructure increases.
Therefore, in a certain range of increasing the laser
power, the microstructure of the fabricated sample
tends to be dense, and the crystal grains are finer.
When the laser power is too large, the solution in the
molten pool absorbs more energy and the cooling
rate decreases, so that the tissue particles will
increase compared to the tissue particles at the
moderate scan speed. Which also verifies the the
results of statistical analysis using XRD diffraction
peak broadening. It can also explain that when the
laser power is 1700 W, the grain size refinement is
most obvious, and the hardness of the forming layer
is the highest.
4 CONCLUSIONS
(1) The 24CrNiMoY alloy steel with ZrO
2
added
cladding layer obtained by SLM has good
formability, no obvious crack defect, and a small
amount of porosity defects. And the defects has a
tendency to change as the process parameters
change.
(2) When the scanning speed of 10 mm/s and the
laser power of 1700 W, the defects of the cladding
layer are minimal and the microstructure is uniform,
the grain size refinement is most obvious. The grain
size is 9.6 μm and the hardness value can reach a
maximum value of 467 HV.
(3) By analyzing the SEM images of the cladding
layer, it can be concluded that the phase composition
of the cladding layer under different power is
martensite, bainite and α-ferrite, and the phase
composition is uniform.
ACKNOWLEDGEMENTS
This work was financially supported by National
Key R&D Program of China (2016YFB1100201),
Green Manufacturing System Integration Project of
the Industry and Information Ministry of China
(2017), Project 201710145047 Supported by
National Training Program of Innovation and
Entrepreneurship for Undergraduates.Research and
development, plan for the future emerging industries
in Shenyang(18-004-2-26).
REFERENCES
1. Bartys, H., Guerin, J.D., Watremez, M., Bricout, J.P.,
2013 Surface Engineering. 17(2) 127-130.
2. Nouby, M., Abdo, J., Mathivanan, D., Srinivasan, K.,
2011 Tribology Transactions. 54(4) 644-656.
3. Kim, D.J., Seok, C.S., Koo, J.M., We, W.T., Goo,
B.C., Won, J.I., 2010 Fatigue & Fracture of
Engineering Materials & Structures. 33(1) 37-42.
4. Ali, H., Ghadbeigi, H., Mumtaz, K., 2018 Materials
Science & Engineering A. 712 175–187.
5. Davidson, K., Singamneni, S., 2016 Materials and
Manufacturing Processes. 31(12) 1543-1555.
6. Fu, L., Khor, K.A., Lim, J.P., 2000 Surface and
Coatings Technology. 127(1) 66-75.
7. Gao, J., Zheng, J., Li, Q.Y., Hou, C.K., 2006 Heat
Treatment of Metals. 31(1) 40-42.
8. Shi, C.F., Chen, S.Y., Xia, Q., Li, Z., 2018 Powder
Metallurgy. 61(1) 73-80.
9. Koker, M.K.A., Welzel, U., Mittemeijer, E.J., 2013
Philosophical Magazine. 93(22) 2967-2994.
Sample
serial
numbe
r
B1 B2 S4 B3 B4
Laser
p
owe
r
160
0
170
0
1800
190
0
200
0
Half-
width
0.22 0.25 0.24 0.23 0.22
hklhkl
k
hkl
D
θβ
λ
cos
=
