
Ship Fuel Usage Monitoring System Based on Big Data Technoloy
Yi ran Shi
1
and Liang xiong Dong
1
1
ZheJiang Ocean University, ZhouShan 316022, China
Keywords: Big data; Ship fuel consumption; Self-network.
Abstract: In order to meet the compulsory requirements of IMO on fuel consumption data recorded by ships, the
monitoring parameter set based on ship oil-engine-environment system was analyzed in this paper and a fuel
consumption monitoring system based on big data technology was established. In this paper, the factors
affecting the fuel consumption of marine power plant and navigation environment are discussed, it presents
the monitoring modes of instantaneous fuel consumption, displacement fuel consumption and average fuel
consumption of ships, then uses zigbee technology to build a monitoring network with adaptive function
and designs a method of network formation and transformation and an algorithm of network time
synchronization.
1 INTRODUCTION
The 69th meeting of the IMO Marine and
Environmental Committee (MEPC) raised the
mandatory requirement for ships to record and report
their fuel consumption figures. According to IMO
regulations, the data on fuel consumption collected
by the ship is reported to the flag State at the end of
each calendar year and the flag State then forwards
the data to the IMO Ship Fuel Consumption
Database(IMO Ship Fuel Consumption Database).
The IMO will then conduct data analysis and
provide SEEA with environmental, energy
efficiency and other analytical results. The
mandatory data collection requirements are passed at
the 70th SEA. As a general rule, the mechanism
should be implemented after the amendment enters
into force. The first reporting period should be 2019,
which will have an impact on the fuel consumption
of the ship's management monitoring and improving
energy efficiency measures put forward higher
requirements. Ship management, fuel management is
long-standing problem management staff affected by
the vagaries of the marine environment, the vessel
has a fuel consumption of "uncertainty, difficult to
manage," the phenomenon[1]. Traditional
monitoring of ship fuel consumption only considers
the economy of marine power plant, but due to the
fact that it is affected by the performance and natural
conditions of diesel engine, the factors such as cargo
turnover, transportation cost and emission
performance must be considered. Therefore, a big
data set, the introduction of big data technology in
fuel consumption management is an effective way.
Fuel management of big data technologies include
ship resource acquisition, storage management,
mining analysis, visualization techniques to show, in
view of the self-organizing, fault tolerance and
flexible networking of wireless sensor networks. It
designed ships fuel monitoring system that based on
big data technology to effectively solve the problem
of the applicability of fuel consumption monitoring.
2 BIG DATA SET BASED ON SHIP
OIL-ENGINE-ENVIRONMENT
SYSTEM
Ship fuel consumption management big data set
refers to all the possible data used in decision-
making fuel consumption problem. It is
characterized by a huge amount of data, diverse
sources, diverse types. It is a complicated
comprehensive plan of oil-engine-environment, Ship
fuel consumption is a collection IMO proposed the
use of large data sets and large data support the
consumption decision-making activities[2]. In order
to get under what circumstances the ship is fuel-
efficient, and how to adjust to a fuel-saving state, it
is necessary to conduct investigation, statistics and
analysis on fuel consumption of different areas and
types of ships so as to determine the factors affecting
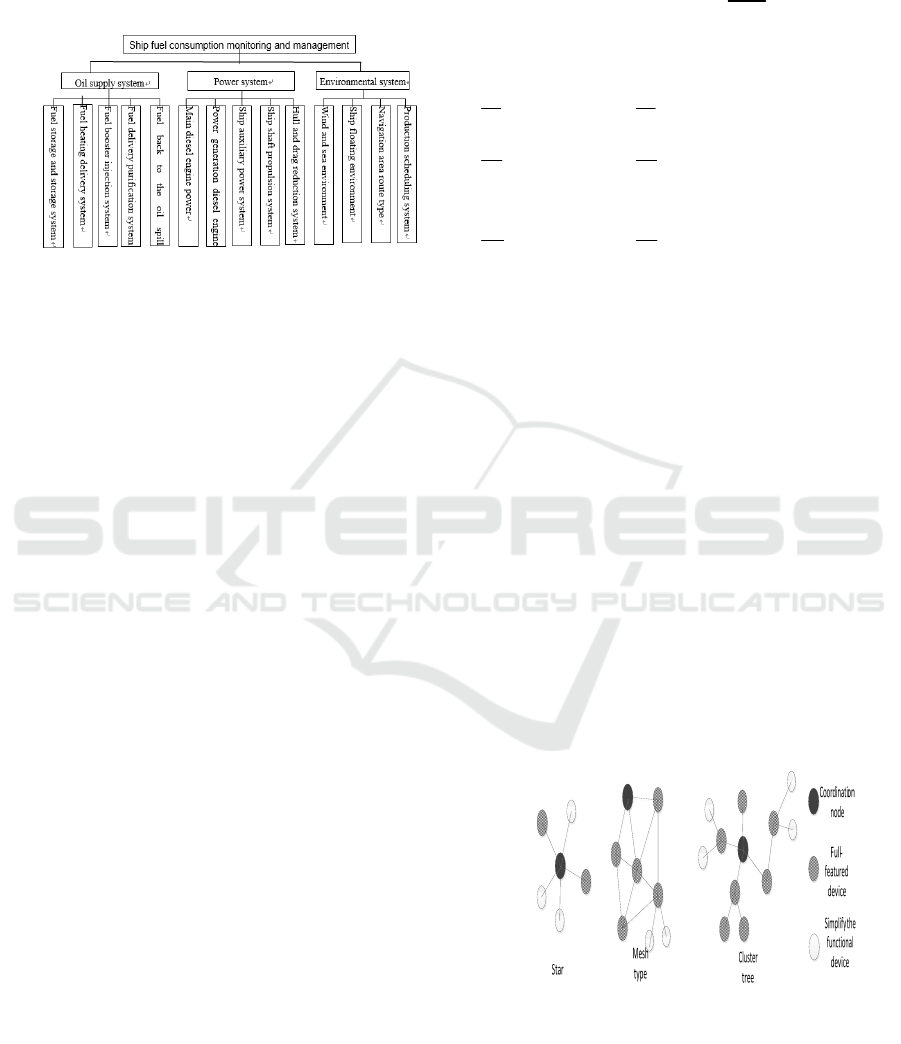
the fuel consumption of the ship. In order to describe
these factors more clearly, these factors can be
divided into oil-engine-environment system and the
structure shown in Figure 1.
Figure 1 . Ship oil - machine - environment system
diagram.
There is no doubt, if we take a single monitor
fuel flow and calculated manner, the actual situation
is that accurate measurement is difficult to achieve.
Although precise measurement of the actual ship
fuel consumption is difficult, but measurable
parameter is very large, therefore, can be collected
according to the ship and the parameter value related
to fuel consumption, the use of large data processing
technology on the ship fuel consumption value is
determined and data processing, to obtain a more
precise Fuel consumption value.
3.SHIP FUEL CONSUMPTION
MONITORING PARAMETERS
ANALYSIS
In the ship oil - machine - environment system, the
subsystems actually have an impact on fuel
consumption in a coordinated manner. To
accommodate the diversity required data on fuel
consumption, it is necessary to change the sampling
frequency parameters flexible fuel consumption
monitoring mode, the adjustment of the correlation
between the large parameter data, set the number of
system subsystems
m
, use
i
Q
for a parameter in the
system, this subsystem affects the size of the ship's
fuel consumption, due to the system's relevance, any
i
Q
will be affected by
1
Q
to
m
Q
, thus
i
Q
is a
function of all. Also any
i
Q
is affected by all other
i
Q
and systems, this effect can be expressed by
equation (1). According to different fuel
consumption monitoring methods, pick n
subsystems to form equation (2), The steady state of
the system is again characterized by the
disappearance of the variable
i
dQ
dt
, which can be
described by equation (3).
1
1
112
112
112
22
212
212
212
1
n
1212
(, ,... ) (, ,...)
( , ,... ) 0
(, ,...)0
( , ,... )
( , ,... )
(,
( , ,... )(, ,... )
m
n
n
n
m
n
n
m
nnmm
dQ
dQ
fQQ Q fQQ Q
dt
dt
fQQ Q
dQ
dQ
fQQ Q
fQQ Q
fQQ Q
dt
dt
fQQ
dQ
dQ
fQQ QfQQ Q
dt
dt
⎧
⎧
==
⎪⎪
=
⎪⎪
⎪⎪
=
=
=
⎪⎪
⇒⇒
⎨⎨
⎪⎪
⎪⎪
⎪⎪
==
⎪⎪
⎩⎩
M
M
M
(1)(2)
2
,... ) 0
n
Q
⎧
⎪
⎪
⎨
⎪
⎪
=
⎩
(3
)
Among them, equation (3) has many sets of
solutions, which represent the existence of a number
of states of the system, which is the mathematical
model for calculating the fuel consumption of ships.
It can be seen from the above that the interaction
between the parameters collected and monitored by
the fuel consumption monitoring system of the ship
is coupled with each other, and the appropriate
acquisition precision and frequency must be selected
and adjusted in real time according to the correlation
between the parameters. Therefore, this system
selects the acquisition system based on the ZigBee
chip of the internet of things. ZigBee technology is a
short-range wireless communication technology
with uniform technical standards, and can coordinate
and communicate among many tiny sensors. The
technology uses the 2.4-GHz IEEE 802.15.4
standard, it is a standard which is a wireless network
protocol control network designed for the low-rate,
typically has three topologies: Star, Mesh, and
Cluster Tree are shown in Figure 2:
Figure 2.Zigbee network structure.
Star network topology networking technology is
simple, but its communication range is very limited;
Mesh network topology using peer-to-peer peer-to-
peer communications, the router will not only send
beacons on a regular basis, but also can improve
network fault tolerance, However, the problem of
time synchronization and the adaptability of the
network must be solved. Because the cluster tree
network topology facilitates the synchronization by
periodically sending beacons, it can reduce system
power consumption and extend the life of the entire
network. In the marine fuel consumption monitoring
system network structure, due to the great difference
between the acquisition accuracy of various
monitoring parameters and the frequency, in order to
improve the computational efficiency of the
network, so, it is necessary to adopt the
corresponding network structure according to the
fuel consumption calculation demand.
4 BIG DATA BASED FUEL
CONSUMPTION MONITORING
NETWORK DESIGN
3.1 Monitoring Network Formation
Requirements
At present, not only the IMO put forward the fuel
data collection requirements, but also the EU MRV
regulations regulate the annual fuel consumption,
CO2 emission and shipping management of the ship.
China has also formulated the fuel consumption
calculation and evaluation for shipping vessels
National Standard (GB7187.1-2010), which takes
into account factors such as speed of ship,
navigation environment, oil, loading and distance[4].
In order to meet the requirements of these codes, the
system adopts the following data processing modes
of fuel consumption .
1) A power plant operating conditions calculated
instantaneous fuel consumption rate. By means of
the power failure identification instantaneous fuel
consumption of ships, such as oil, or deterioration of
combustion state, the instantaneous consumption
rate of the main propulsion device by monitoring the
main parameters calculated with high accuracy and
the sampling frequency acquisition requirements.
2) Ship fuel consumption value is calculated
from the displacement conditions of ship sailing.
The optimum working point of ship power plant
performance can be calculated by displacement oil
consumption value. The displacement fuel
consumption value is mainly calculated by
monitoring the ship sailing performance parameters,
which has lower acquisition precision and sampling
frequency requirements.
3) Calculate the average ship oil consumption
according to the ship's operation management. Based
on this value, the operation mode and speed of the
ship can be optimized and managed. The average
fuel consumption can be obtained by data fusion
using instantaneous fuel consumption and
displacement fuel consumption.
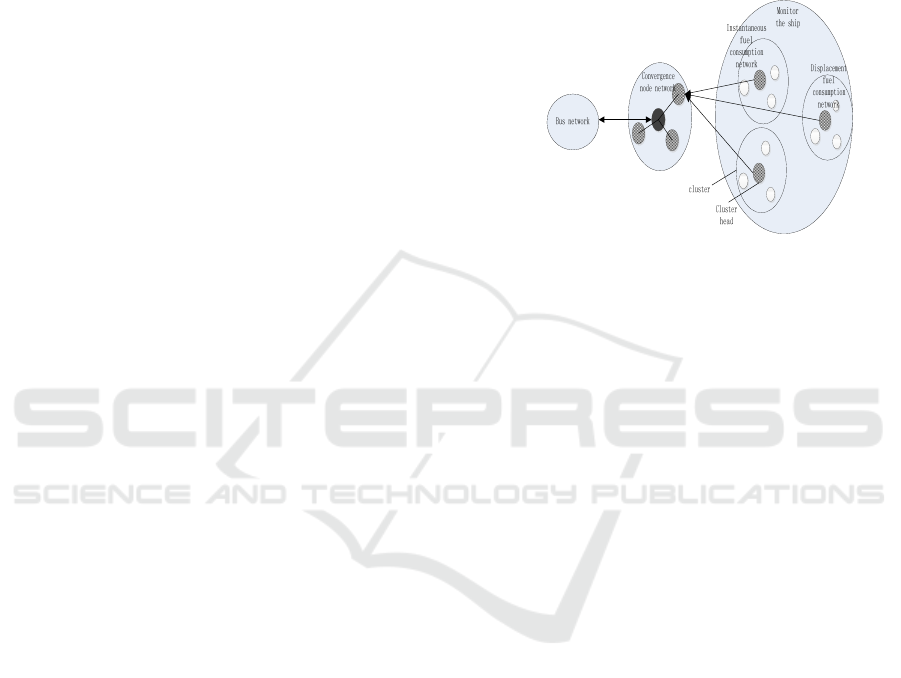
Figure 3 . Ship fuel consumption monitoring system
structure.
In order to adapt to the different fuel
consumption monitoring modes of the above ships,
this system designs a multi-hop self-organizing
monitoring network with adaptive function so that
the network can be transformed in network, tree, star
and other models to meet the needs, as shown in
Figure 3 .
In Figure 3, the system consists of a control
center, a wireless network, a sink node and a cluster
node network. A plurality of sensors in the fuel
consumption parameter of the ship form a cluster,
and each cluster has a cluster head node. The
collected data is transmitted to the cluster head node
first. Then transmitted to the sink node of the
network. The cluster head node represents the
specific fuel consumption value calculated by the
sensor network. The sink node receives the data
transmitted by each cluster and transmits the data to
the control center through the wireless network. The
control center calculates various fuel consumption
values by using various big data fusion algorithms.
3.2 Monitoring Network Formation
Method
In the established sensor network, the data sampling
accuracy and sampling frequency of different cluster
nodes network are different, and the influence
weight of network output value on fuel consumption
value is also not the same. Therefore, according to
the influence weight of network output on fuel
consumption value to select monitoring network.
Considering the many factors that affect the cluster
node weight, including the accuracy, relevance and
sensitivity of the monitoring parameters, it is
difficult to accurately measure the weight of cluster
nodes. Therefore, this paper adopts the weight
adjustment process based on the minimum variance
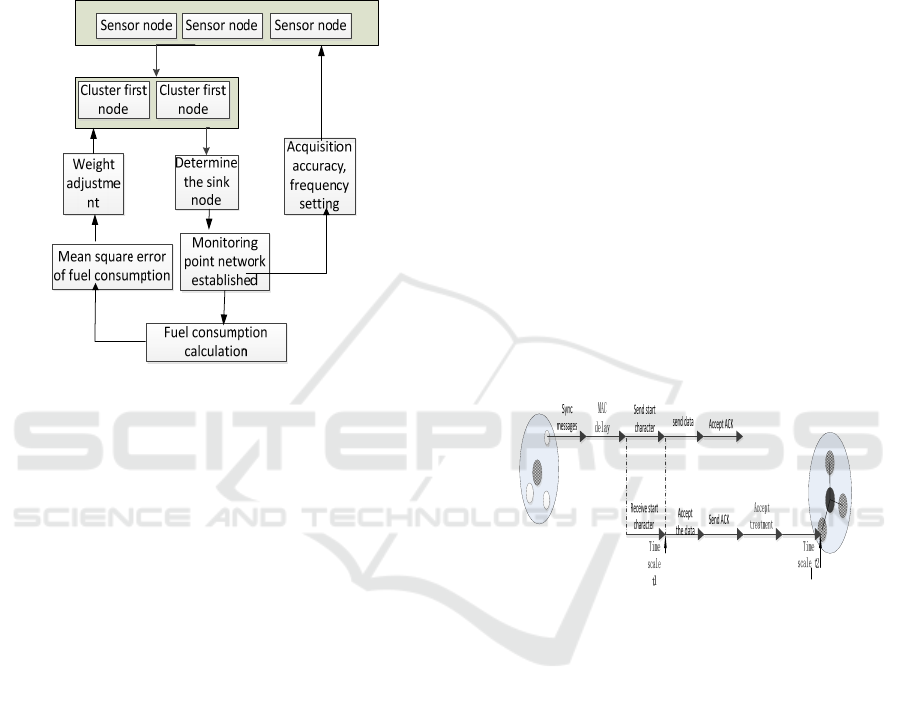
of fuel consumption, as shown in Figure 4 .
Figure 4 . Sensor network formation process.
1.Each cluster head node based fuel consumption
are measured
12
,,
n
X
XXL
, the corresponding
weights are
12
,,
n
ωω ω
L
, the measurement variance
are
22 2
12 n
σσ σ
L,,
,the weighted fusion algorithm of
nodes in a cluster is used to calculate the fuel
consumption value as
1
ˆ
n
ii
i
x
X
ω
=
=
∑
,network output
value of the mean square error can be expressed as:
2222
1
ˆ
(( ) )
n
ii
i
Ex x
σωσ
=
=−=
∑
(4)
2. In order to minimize the mean square error of
the network output value, we should minimize the
value of
2
σ
when calculating the weight value. The
Lagrangeian adjoint equation can be established by
solving Lagrange's extremum
value:
()
2
1,
11
,1
nn
niii
ii
f
ωωλ ωσλ ω
==
⎛⎞
⋅⋅⋅ = − −
⎜⎟
⎝⎠
∑∑
(5)
The equation can be obtained on the node
optimized weighting coefficients, according to the
weight and thus the formation of sensor nodes in the
network, so that the fuel consumption of the network
output of the right weight accuracy and frequency
match network data collection, monitoring to ensure
the accuracy of fuel consumption.
3.3 Network Time Synchronization
Method
In the ZigBee mesh topology constructed by this
system, because the router does not send beacons
periodically, the unicast beacons are only required
when the equipment in the network requires it.
Although the fault tolerance of the network is
improved, the nodes in the network. It is difficult to
achieve synchronization; on the other hand, due to
the different frequency of data collection in different
cluster networks, to improve the effectiveness of
data fusion of fuel consumption, we must solve the
time synchronization problem of node network.
Currently ZigBee network clock synchronization
algorithm mainly RBS synchronization algorithm,
PSN synchronization algorithm, LTS algorithm, etc.,
the system uses a DMTS algorithm, the algorithm
mechanism shown in Figure 5.
Figure 5 .Time synchronization algorithm
In FIG. 5, when the channel is idle, the sink node
adds the current timestamp 1, the start character and
the preamble to the broadcast data packet, sets the
sent information as 2 bits and sends the required
time for each bit as 3, calculate the start character
and preamble sending time is 4, the receiving node
in the broadcast packet arrival time stamp 5, record
the time at this time 6, then the receiving end of the
receiving processing delay is 7, and then adjust their
own clock is 8 . The receiving node adjusts the clock
from 9 to 10. This clock through the receiving node
to adjust the entire network to achieve the time
synchronization.

5 CONCLUSIONS
In order to meet the requirements of IMO for ships
to collect fuel consumption data, energy efficiency
management of ships is strengthened. In this paper,
aiming at the present situation of fuel consumption
deviation caused by the influence of fuel system,
power plant and navigation environment on ships, a
fuel consumption monitoring and management
system based on big data is designed. Based on the
analysis of oil-engine-environment-based
monitoring model of ship fuel consumption and
corresponding network requirements of nodes, a
multi-hop self-organizing monitoring network with
adaptive function was constructed by using zigbee
technology to ensure fault tolerance and flexibility.
In this paper, a weight-based data fusion method is
used to set up and transform the network. At the
same time, the network time synchronization
algorithm is used to ensure the validity of the data.
This method can be applied to both oil consumption
monitoring under various ship operating conditions.
And it also satisfies the needs of current ship fuel
consumption monitoring and management.
ACKNOWLEDGEMENTS
This research was supported by Zhejiang Province
College students' innovation and entrepreneurship
incubation project
(2018).
REFERENCES
1. Xiong Lin. Design of Ship Fuel Consumption
Management System Based on Compass Satellite
Communication[D]. Xiamen: Jimei University, 2015.
2. http://www.eworldship.com/html/2016/ship inside and
outside 0703/117079.html.
3. Liu Qing, Wu Yanzi. Establishment of the
forewarning management system of highway traffic
safety. Journal of Wuhan University of Technology:
Traffic Science and Engineering Edition, 2003, 27(3).
4. Shi Jingli. Global collection mechanism of ship fuel
consumption debut [J]. China Ship Inspection, 2016,
(6)42-45.
5. GUO Jian - guo, CHEN Liang.Design of Long - range
Monitoring System for Ship Fuel Consumption in
Ninghuan Shipyard[J]. Technology wind, 2013, 13:48-
49.
6. Lin Rongmou. Research on Ship Energy Consumption
Assessment Method and Energy Consumption
Prediction[D]. Xiamen: Jimei University, 2012.
APPENDIX
Shi Yiran (1994-), female, Ocean Data Mining and
Application Lab, Zhejiang Ocean University, No.1,
Haida Nan Road, Lincheng Street, Dinghai District,
Zhoushan City, Zhejiang Province.
mailbox:2579992917qq@.com,
