
High Speed online Detection of Fabric Density Based on
Multi-resolution Wavelet Basis
Ya’nan Zhao
1
,Liming Wu
1
and Qi Chen
1
1School of Electromechanical Engineering, Guangdong University of Technology, Guangzhou, China
Keywords: Fabric detection, Wavelet basis, Warp and weft density.
Abstract: The textile industry is a pillar industry in China. Domestic demand and foreign exports are huge. With the
improvement of living standards, the public demanded that textiles be both aesthetical and comfortable.
New indexes should be added to the processing of fabrics, which increase the difficulty to detect. Density
detection is an important part of fabric quality inspection. However, the current detection methods still rely
heavily on labour, with high error and low detection efficiency. Wavelet basis combines machine vision are
introduced to achieve high speed automatic detection. Firstly, the images are preprocessed, and several
wavelet basis reconstruction effects are compared. The wavelet transform is used to extract the feature
information in both latitude and longitude directions, and binarization and smoothing processing are
performed for better calculation of density information. Finally, the density of fabric is obtained. The results
show that the method can detect the density of the fabric quickly, and the speed and efficiency are high.
1 INTRODUCTION
Density inspection is an essential task in the fabric.
Many experts have studied this issue. A foreign
scholar combined the optical field with fabric
organization for the first time and studied the
structure of fabrics by diffraction images, and
calculated the interval through the highlights of the
photo (Akiyama R, 1986).The two-dimensional
spectrum of the fabric was obtained through the Fast
Fourier Transform (FFT), and the feature was
extracted through the frequency analysis of the
fabric images to obtain the density of the fabric (Xu
B, 1996). Taiwan scholar calculated the gray level
co-occurrence matrix according to the different
intervals and angles of pixels, and obtained the
eigenvalues. Then the fabric density of circular
arrangement can be calculated (Huang C, 2000).
Domestic scholars added adaptive filtering to the
fabric image to obtain a picture containing only the
longitudinal and latitudinal texture information. (He
Feng,2007). According to this research, a detection
method was proposed which combining wavelet
image decomposition and Radon transform for the
image texture of the inclined image. The method can
classify fabrics and measure density (Shen
Jianqiang, 2007). For the fabrics with different
texture patterns on both sides, a two-sided fusion
technique was proposed. A double-sided imaging
system is applied to obtain images containing front
and back information of fabrics, and affine and
wavelet transform are used to fuse two-sided fabric
images. A fast Fourier transform is performed to
measure the warp and weft yarn densities of the
fabric in the frequency domain (Zhang R, 2016). In
this paper, the high speed online detection of fabric
density based on multi-resolution wavelet basis is
proposed. It can not only save time, reduce labor,
but also improve efficiency while ensuring accuracy.
2 PRINCIPLE OF DWT
Wavelet transform is a time-frequency analysis
method, which has multi-resolution characteristics
and can provide a time-frequency window with
frequency. The discrete wavelet transform(DWT) of
the size image is defined as follows:
11
0
00
1
0
MN
(,m,n)
xy
W ( ,m,n ) f ( x,y ) ( x,y )
MN
ϕ
ϕ
−−
==
=
∑∑
(1)
11
00
1
MN
ii
( j ,m,n )
xy
W(j,m,n) f(x,y) (x,y)
MN
ϕ
ϕ
−−
==
=
∑∑
(2)
{
}
iH,V,D=
where
W(j,m,n)
ϕ
and
i
W(j,m,n)
ϕ
are low and high
frequency approximation coefficients of images
respectively.
i
(j,m,n)
(x,y)
ϕ
is scaling and translation
transformation of wavelet functions in horizontal,
vertical and diagonal directions.
When the 2D wavelet transform is applied to
image processing, it can be decomposed into two
steps: horizontal wavelet transform and vertical
wavelet transform. The wavelet and scale functions
are applied to the rows and columns of the image
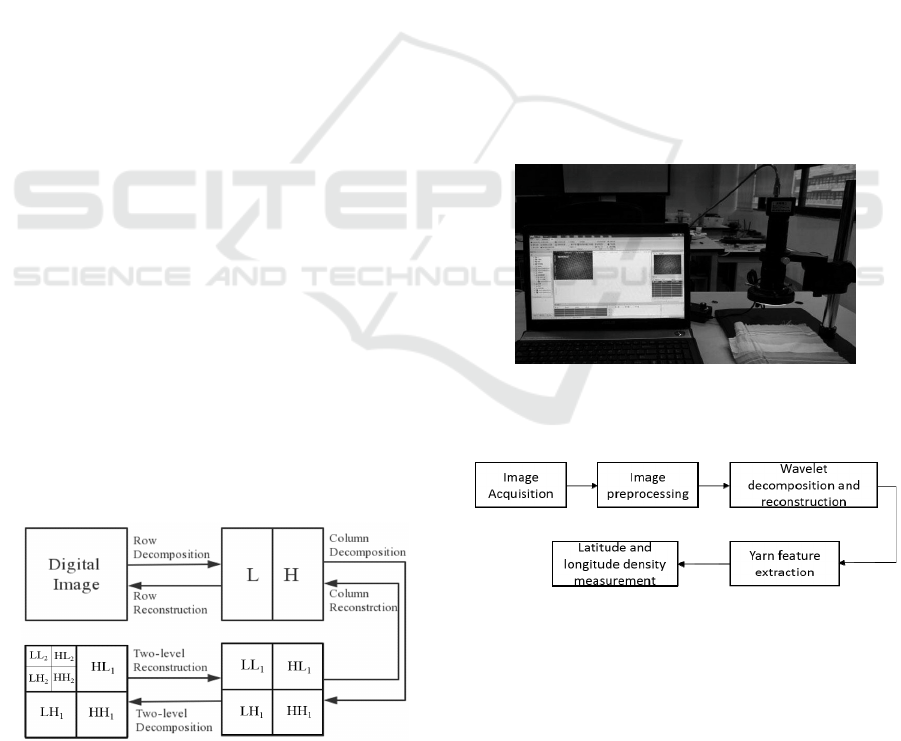
respectively. The figure 1 shows the two-
dimensional discrete wavelet decomposition and
reconstruction process of the image. The
decomposition process can be described as follows:
Firstly, one-dimensional DWT is performed on each
row of the image to obtain the low-frequency
component L and high-frequency component H of
the original image in the horizontal direction. And
then one-dimensional DWT is carried out on each
column of the transformed data to obtain the four
parts of the original image: Low-frequency
components LL in the horizontal and vertical
directions, Low-frequency in the horizontal direction
and High-frequency in the vertical direction LH,
High-frequency in the horizontal direction, and
Low-frequency in the vertical direction HL, and
High-frequency components HH in both horizontal
and vertical directions. The reconstruction process
can be described as follows: Firstly, IDWT is
performed on each column of the transform result.
Then one-dimensional IDWT is performed on each
row of the transform data, and a reconstructed image
can be obtained. It can be seen from the above that
the wavelet decomposition of an image is a process
of separating a signal in accordance with low-
frequency and directed high-frequency. Further
decomposition of the acquired LL component can be
performed according to the requirements in the
Figure 1: Two-dimensional discrete wavelet
decomposition and reconstruction process of the image.
decomposition process until the requirement is
satisfied.
The warp and weft yarns in the fabric are
perpendicular to each other according to certain
rules. The texture information of the warp and weft
can be obtained after the fabric image is
decomposed. Since the information is distributed in
the high frequency regions, the vertical high
frequency subimage and horizontal high frequency
subimage after wavelet decomposition can be used
to analyze the fabric density.
3 IMAGE PROCESSING
3.1 Image Acquisition
As shown in the figure 2, an area array CCD
industrial camera is used for image acquisition, with
an optical zoom lens and a ring light source to
facilitate the adjustment of the detection system. For
better measurement, the collected objects are clean,
neat and clear texture. The collected image samples
are shown in figure 2.
Figure 2: Collected image samples.
The workflow chart is as figure 3:
Figure 3: Workflow chart.
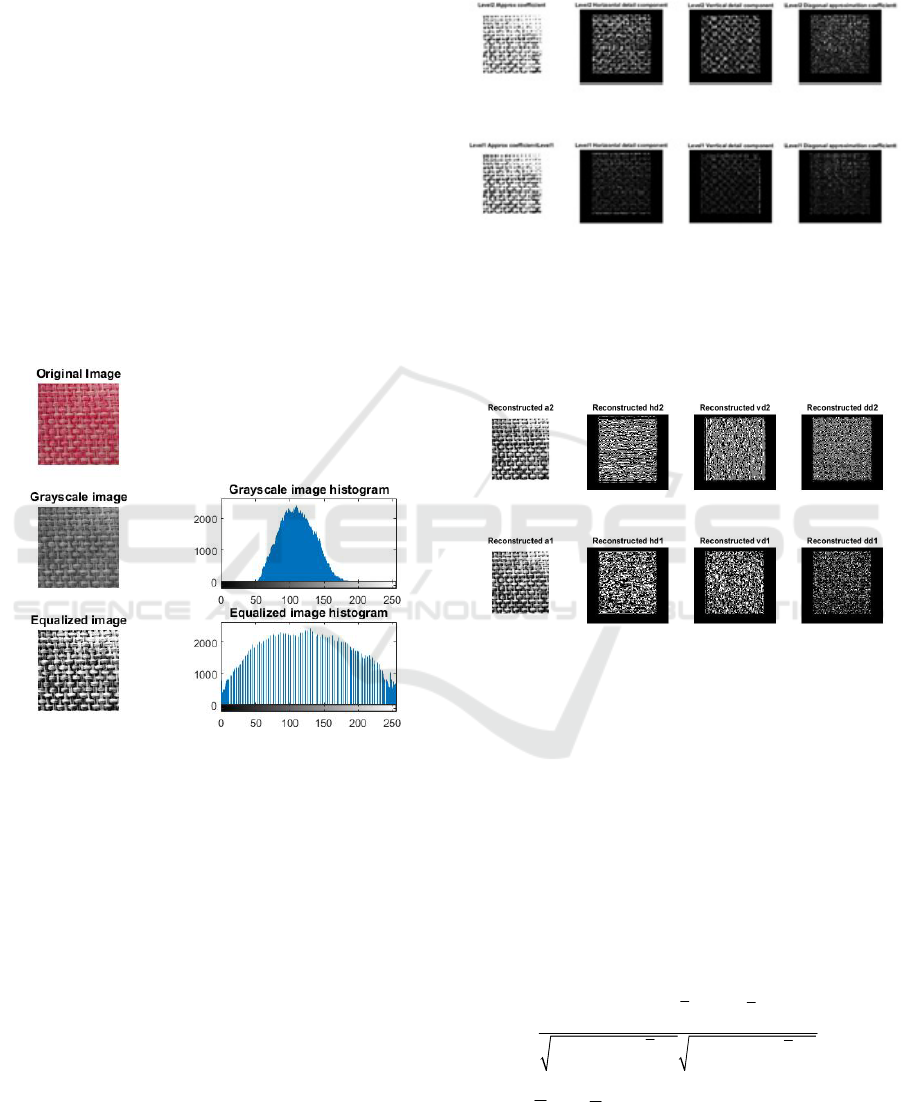
3.2 Image Pre-processing
In the process of image acquisition, the imaging
quality is affected by many factors, such as uneven
illumination, distortion of the optical system, and
noise pollution. It is difficult to meet the detection
requirements. After obtaining the target image, the
acquired image sample needs to be pre-processed to
improve the image quality (Ji Shi, 2012). The pre-
processing process includes the following steps: (1)
Transform the color space. The color of the image
affects the image quality and needs to be converted
into a grayscale image; (2) Histogram equalization
process .It can enhance the contrast of the original
image and makes it evenly distributed; (3) Noise
removal. It can suppress background; noise and
preserve image details as much as possible. Median
filter is used for noise reduction; (4) Local
enhancement, which can increase the contrast of the
image; (5) Image correction. The Canny edge
detector is used to extract the edge information of
the fabric warp and weft yarn, and then Hough
transform is used to detect the angle of the fabric
image to correct it (Kaicheng Fu, 2016).The
equalized image is shown as figure 4.
Figure 4: Equalized image.
3.3 Feature Extraction of Latitude and
Longitude
Multi-level wavelet decomposition of fabric images
is required in order to obtain clearer images of warp
and weft yarns. The Mallat wavelet basis function is
applied to multidimensional wavelet decomposition
of fabric images. It is found that the four-layer
wavelet decomposition has the best effect. The two-
dimensional decomposition effect is shown in figure
5. After wavelet decomposition, the approximate
component, horizontal component, vertical
component and diagonal component of the fabric
image are obtained, and the horizontal component
and vertical component are selected for wavelet
reconstruction. As shown in Figure 6, the first half is
the result of first order wavelet decomposition, and
the second half is the result of two level wavelet
decomposition.
Figure 5: Two-dimensional wavelet decomposition of
fabric images.
The warp and weft yarn information in the fabric
image is best retained in the high-frequency
horizontal and vertical reconstruction map of a
certain layer.
Figure 6: Two-dimensional wavelet reconstructed of fabric
images.
The number of layers selected during
reconstruction affects the correctness of the final
result directly. When determining the level of
reconstruction, the correlation coefficient method
can be used to determine the optimal level of
reconstruction. After multi-level decomposition of
the image, the correlation coefficients between the
horizontal and vertical reconstruction map of the
layer and the original image are calculated. The
highest correlation coefficient is used as the
coefficient of reconstruction. The correlation
coefficient between A and B as equation (3).
22
mn mn
mn
mn mn
mn mn
(A A)(B B)
t
( (AA))( (BB))
−−
=
−−
∑
∑
∑∑ ∑∑
(3)
where A and
B
are the average gray value of the
two images. A and B are the gray scale matrices of
the images, which have the same dimension of
mn×
.
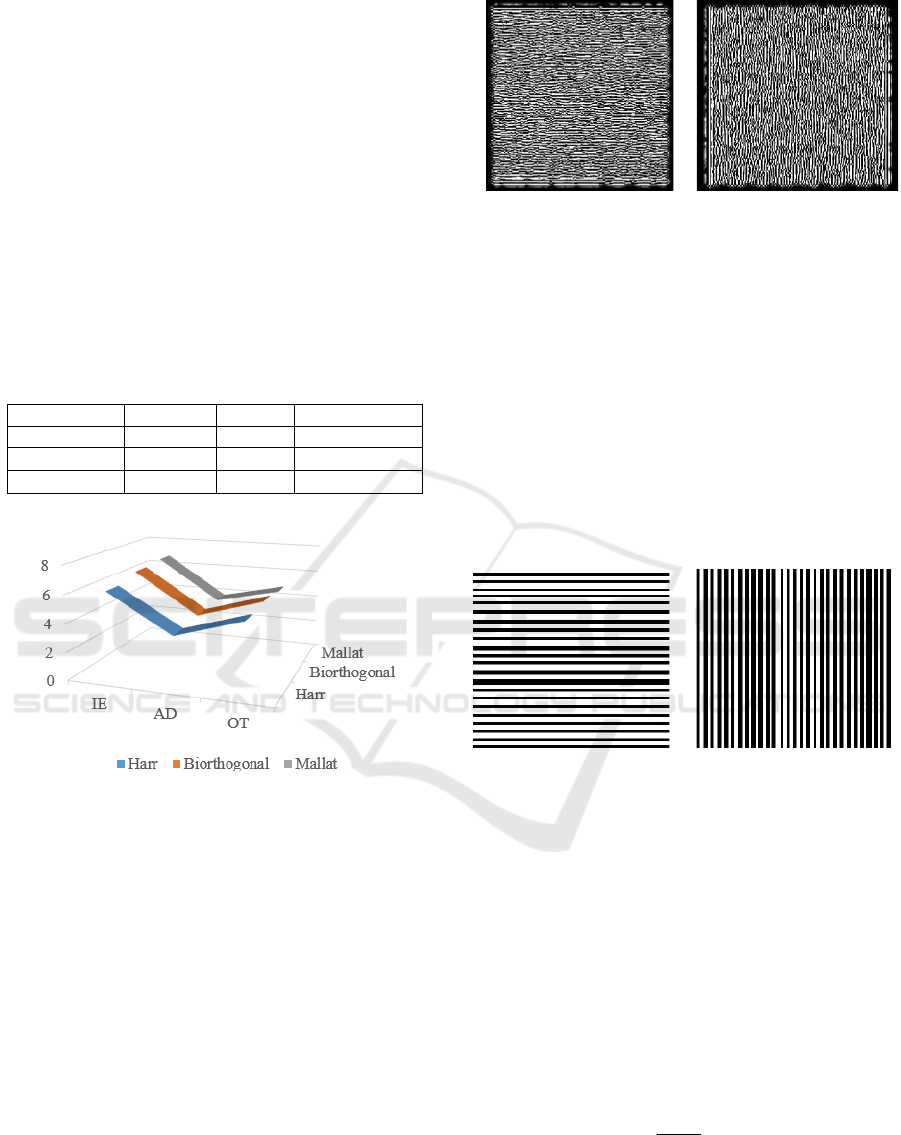
In order to evaluate the reconstructive
performance of the image objectively, three kinds of
wavelet functions Harr, Bior, and Mallat were
selected for comparison. The commonly used
information entropy(IE), average gradient(AG), and
oprating time(OT) three statistical indicators were
used to evaluate the reconstructed images(Jun Yang,
2007). IE represents the amount of information in an
image and is an index to measure the abundance of
information. AG reflects the sharpness, detail and
texture of the image. The larger the first two
indicators, the better the image quality. The specific
statistical results are shown in table 1 and figure 7.
Table 1: Objective evaluation of reconstruction effect.
IE AG OT
Har
r
6.1251 3.5014 4.935156
Biorthogonal
6.6144 3.7380 5.131282
Mallat
6.7628 3.8163
4.852911
Figure 7: Comparison of different wavelet function
reconstruction effects.
From the above, it can be seen that since the
sawtooth of Harr operator reconstructs the image,
the IE is obviously small, and the biorthogonality of
Bior. affects the calculation time, which has the
longest RT. Combining three indexs, the Mallat
operator has the best effect of extracting image
features among the three functions.
The approximate direction of the warp and weft
yarns can be observed after reconstructing. In order
to obtain the warp and weft information more
accurately, it is necessary to binarize the
reconstructed image (Xunming Zhao, 2011).The
global threshold method is applied for image
processing. The binarized image is shown in figure 8.
White represents yarn, and black represents yarn gap
after binarization.
Figure 8: Latitude and longitude binary image.
The warp and weft information of each direction
is basically obtained after binarizing. However, the
obvious discontinuity in the yarn image interferes
the subsequent calculations. To obtain the exact
value of the warp and weft density of the fabric, it is
also necessary to perform morphological processing
and idealization of the yarn image. The idealization
idea is as follows: take one column in the weft
image or take a row in the warp image, and count
the number of 0 pixel values or 1 pixel value in each
column and each row of the binary image separately.
If the pixel value has a mutation from 0 to 1, the
number of yarns adds. The idealized image, shown
in figure 9, is used for the density calculation.
Figure 9: Idealized latitude and longitude images.
3.4 Density Measurement
The warp and weft stripes of the image are obvious
after idealizing. The black and white stripes appear
alternately in the image. The fabric warp and weft
density can be calculated based on the number of
white stripes and pixel conversion coefficient. The
warp and weft density of a fabric is defined as the
number of yarns within 10 cm or 1 inch. The ratio
between the pixel distance S
pixel
and the actual
physical distance S is as formula (4):
pixel
S
R
S
=
(4)
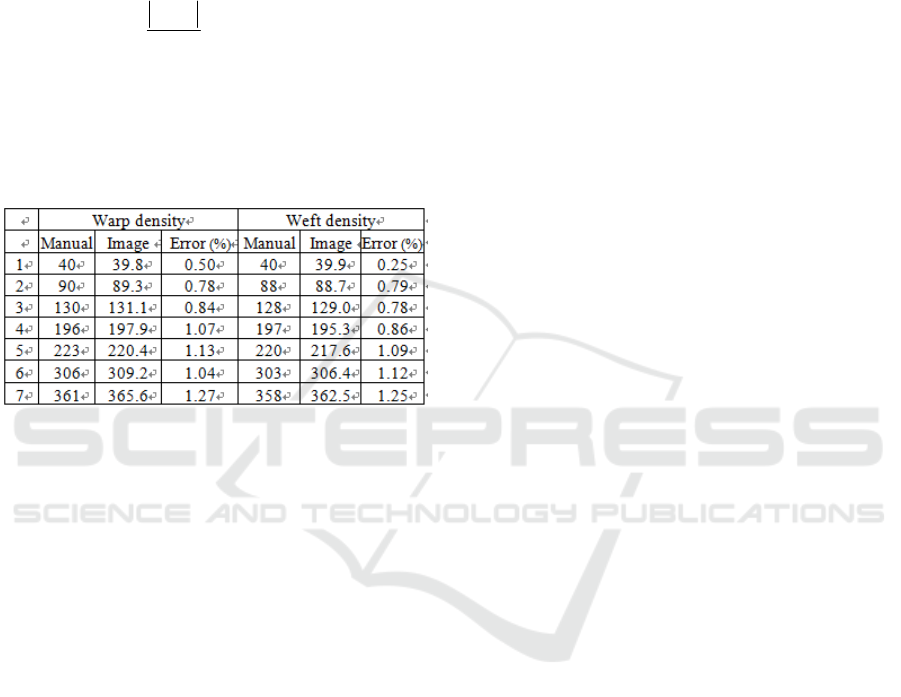
4 COMPARATIVE ANALYSIS
A variety of fabrics with different densities and
different tissue structures were selected to conduct
the measurement of the warp and weft density, and
compared with the results of manual measurements.
The relative error is defined as
= 100%
cd
c
σ
−
×
(5)
where c is the manual measurement result and d is
the image measurement result. The results are shown
in Table 2.
Table 2: Test results of Fabric density.
It can be seen from the experimental results that
the accuracy of the image method is mainly affected
by tightness of fabric warp and weft arrangement
and the type of tissue structure. The higher the warp
and weft density of the fabric, the smaller the
spacing between the yarns, the more difficult the
edge information between adjacent yarns to extract,
the more obvious the error. In general, the error
between the measurement result of image and the
actual is small.
5 CONCLUSIONS
The wavelet basis is introduced into online yarn
density detection of fabrics. Firstly, the collected
images are preprocessed, and the fabric image is
decomposed and reconstructed by multi-scale
wavelet to obtain the decomposed warp and weft
sub-images. Then the image is binarized and
smoothed to obtain the characteristics of warp and
weft yarns. Finally, the yarn density of warp and
weft is calculated. Experiments have verified the
density of different types of pictures and compared
them with manual measurements. The experimental
results show that the method has small measurement
error and is reliable and practical.
ACKNOWLEDGEMENTS
This work was supported by the Science and
Technology Planning Project of Guangdong
province, China (2017A090905047); Science and
Technology Planning Project of Guangzhou, China
(201806010128) and A New Generation of
Intelligent Large-Scale Carton Printing Equipment
Package Development and Industrialization. Thanks
for the helps.
REFERENCES
1. Akiyama, R., Iguro, T., et al., 1986. Detection of
weave types in woven fabrics by observing optical
diffraction patterns. Fiber, 42(10), T574-T579.
2. Xu, B., 1996. Identifying fabric structures with fast
fourier transform techniques. Journal of Northwest
Institute of Textileence & Technology, 66(8), 496-
506.
3. Huang, C., Liu, S. C.,et al., 2000. Woven fabric
analysis by image processing: part i: identification of
weave patterns. Textile Research Journal, 70(6), 481-
485.
4. Feng He, Lijian Li, & Jianming Xu., 2007. Fabric
Density Measurement Based on Adaptive Wavelet
Transform. Journal of Textile Research, 28(2), 32-35.
5. Jianqiang Shen, Zhaofeng Ruan, et al., 2007. A
method for fabric tissue and structure parameters
detection based on wavelet transform. Chinese Journal
of Scientific Instrument, 28(2), 357-362.
6. Zhang, R., & Xin, B. 2016. Automatic measurement
method of yarn dyed woven fabric density via wavelet
transform fusion technique. Journal of Fiber
Bioengineering & Informatics, 9(2), 115-132.
7. Ji Shi, Wenyu Tu, et al., 2012. Fabric defect image
preprocessing based on wavelet packet and image
fusion. Silk, 49(8), 30-33.
8. Kaicheng Fu, Zhuxin Zhang, et al. 2016. Detection of
sar image roads based on canny-roa operator and
hough transform. Modern Electronic Technology,
39(23), 1-4.
9. Jun Yang, & Zhongming Zhao. 2007. Multifocus
image fusion method based on curvelet transform.
Optoelectronic Engineering, 34(6), 67-71.
10. Xunming Zhao, Zhongmin Deng, & Youting Qi. 2011.
Automatic detection of warp and weft densities of
woven fabrics based on wavelet transform. Advances
in Textile Science and Technology (5), 45-47.
