
Study on Active Particle Doped Fluorescent Fiber
Temperature Sensing Technology
Jinling Wu
1
, Hualong Yu
2
and Xiaowei Li
3
1
Institute of Occupation Technical , Hebei Normal University, Shijiazhuang , China
2
Institute of Education, Hebei Normal University, Shijiazhuang , China
3
Shijiazhuang Municipal Public Security Bureau,Shijiazhuang, China
Keywords: Visible wavelength; absorbing glas; flluorescence optic sensor
Abstract: The optic- fiber temperature measurement probe based on ruby is developed. This system is particularly
adapt to the temperature measurement in the rang of 0℃ to130。The calibration graph was shown to be
highly reproducible when the probe is temperature cycled. A change in drive current from 5 to 30mA yields
a spectral shift of the peak emission of only a few nanometers. The drive current to the LED can easily be
kept within the required narrowly defined bounds through the control circuitry.
1 INTRODUCTION
The previous device was configured to take
advantage of infrared radiation and the infrared
absorption characteristics in the sensor. Such a
scheme is, in principle, attractive as a reference for
any absorption-based device, but may be limited by
its operation with infrared radiation. Many processes
involve interactions in the visible part of the
spectrum, e. g., pH indicator dyes and colorimetric
processes, and with the availability of bright LED
and laser diode sources in the visible part of the
spectrum, there is a genuine need for such a
referencing scheme at shorter wavelengths into the
visible. Furthermore, in the device described, the
sensitivity of the resultant sensor was somewhat
limited and did offer scope for potential
improvement. One such method is to consider the
suitability of visible wavelength referencing system
for temperature sensors
2 OPTICAL AND MECHANICAL
DESIGN
In this case the temperature-dependent absorbing
material is a sample of glass, which exhibits a
significant change in its optical properties, on a band
centered at 565nm,the emission wavelength of the
commonly available bright green LED. Crystal ruby
is used as the material producing the reference
fluorescence signal. On the R-line emission bands,
don’t discuss here.
The ruby and absorbing glass sample that
constituted the sensor probe was held together in a
metal cylinder of length 25mm,using large diameter
input and output optical fibers (PCS1000, 1000µm
diameter). At the wavelength of the ruby
fluorescence, the absorbing glass has maximum
transmission and this is sufficiently removed
spectrally not to change significantly with
temperature, up to ~1300C.Beyong this temperature
an unacceptable (>1%)deviation in the otherwise
constant fluorescence ratio occurs and thus the ruby
sample can only be used for referencing when
mounted in a different configuration, in front of the
LED. This is well below the temperature where
catastrophic chemical changes occur in the glass
(several hundred degrees Celsius), and its absorption
properties change irreversibly.
3 SIGNAL PROCESSING SCHEME
A block diagram of the system, which was designed
to separate, in time, the changes in the temperature-
dependent green light and the fluorescence reference
red light signals, is shown in Figure1.where
systems1 and 2 refer to two different placements of
the ruby sample in order to optimize the
performance of the device. In system1, the ruby
sample is in contact with the absorbing glass and in
system2 it is located in front of the LED, in a
standard optical housing. The LED was modulated
with a pulse, which falls to zero on a time scale of
several Microseconds and thus the signal received
after this time corresponds to the total ruby
Fluorescence signal caused by excitation of the
sample by the green light.
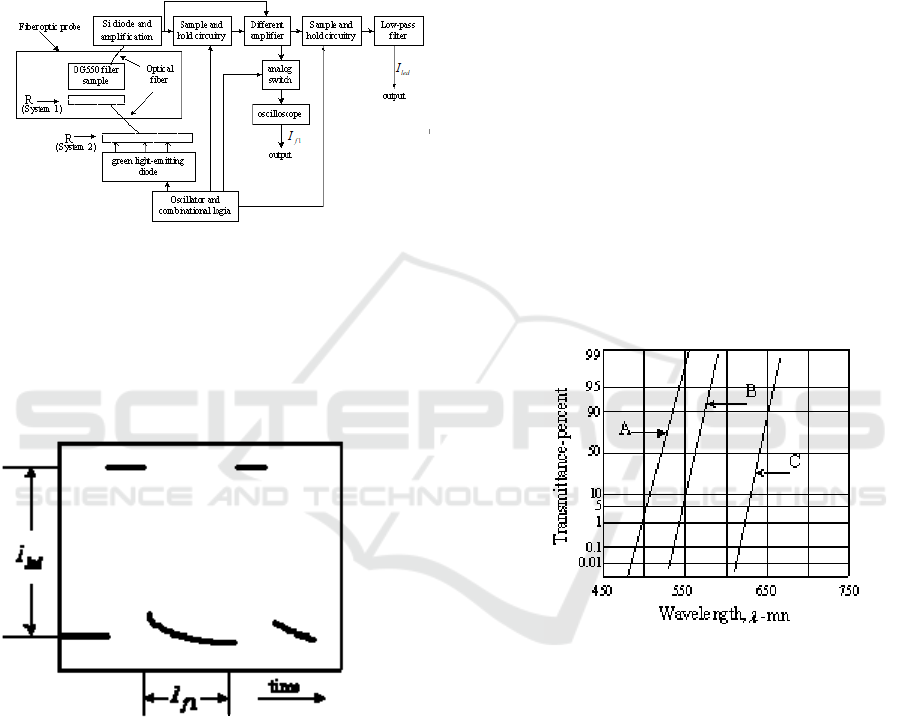
Figure 1. Block diagram of the optoelectronic system.
Thus, a single detector may be used, in this case
a Si p-i-n diode with an integral amplifier, to
amplify the low signal levels experienced. This
obviates the need for two such detectors to separate
each wavelength band and any consequent difficulty
that may occur in their cross referencing. To
Figure 2. The illustration of transmitted intensity of the
green LED signa, And time-integrated ruby fluorescence,
showing temporal Division of signals. Horizontal time scal-
5ms div-1.
eliminate the effect of ambient light variations, a
sample/hold circuit samples the signal when the
LED is off and also where the fluorescence signal
has decayed to its zero level. The sampled value is
then subtracted from the original signal in a
difference amplifier and as a consequence the signal
is referred to level independent of ambient light
variations. It is then processed in two different ways.
The temperature-dependent signal is obtained by
sampling the pulse at its maximum value and a first-
order low-pass filter to minimize fluctuations due to
noise further smooths the corresponding dc output.
The ‘reference’ signal is obtained by electronically
switching out only the fluorescence signal.
Typical pulses from which this information was
obtained are shown as Figure2, illustrating
intensities of the transmitted green signal from the
LED, and the ruby fluorescence pulse of time-
integrated intensity.
4 SYSTEM PERFORMANCE
4.1 Validity of the Referencing
Technique with Ruby
The time-integrated fluorescence signal obtained
from the ruby sample must be a direct measure of the
intensity of the green LED signal which both induces
it and is attenuated in a temperature-dependent way
by the absorbing glass sample Figure3.
Figure 3. Transmittance (at room temperature) of three
Absorption glasses OG515 (A), OG550 (B), RG630(C).
Shows the proof of this principle, where the ratio
of the peak green LED
signal obtained under steady
pumping, , to the time-integrated fluorescence,
is shown as a function of temperature for a probe
made up with only the ruby present and the
absorption of the glass. Over the range 20-1300C, the
ratio is constant to ±1% of the peak value, clearly
showing validity of the referencing technique, as
would Be expected from the constant quantum
efficiency of the ruby. It is important to carry out
such a test as the geometrical changes in the probe
itself can mean significant changes in the intensity of
the green signal reaching the absorbing glass.
Beyond 130,this does not apply to required degree of
accuracy, thus dictating the only probe design, which
may then be used, excluding system1 in favor of
system 2, in the temperature region to 200℃.
4.2 Choice of Absorbing Material
Three absorption edge glasses were tested initially
with the ruby sample housed in front of the
LED.Figure4 shows a series of absorption spectra at
room temperature, of the three filters OG515(A),
OG550(B),and RG630(C),with ,for comparison, the
emission profile of the green LED(L).The calibration
graph of the normalized transmission of these three
materials as a function of temperature in the range
20-130
0
C is shown as Figure8.16.Over this range, for
OG515(A),The maximum change in intensity is ±
1.5%,which is due essentially to the error in the ruby
referencing and noise in the system. The result
indicates OG515 is too far removed from the LED
spectrum to make any real impression on the
transmitted intensity. The calibration graph with RG
630(C), shows a slightly nonlinear profile of
normalized transmission with temperature. The
change in the ratio recorded on this graph was 25%
over the temperature range studied. From the LED
profile in Figure4 it can be seen that main absorption
of RG630 is well beyond the peak wavelength of the
LED. Thus, the percentage change in transmitted
intensity in the probe itself can be improved by using
a glass whose characteristic is optimum near the
center wavelength. OG550 (B), with 45%
transmission at 550nm,shows a 45% change in
intensity over the same temperature range. As a result
this type glass was chosen for the sensor system
investigated.
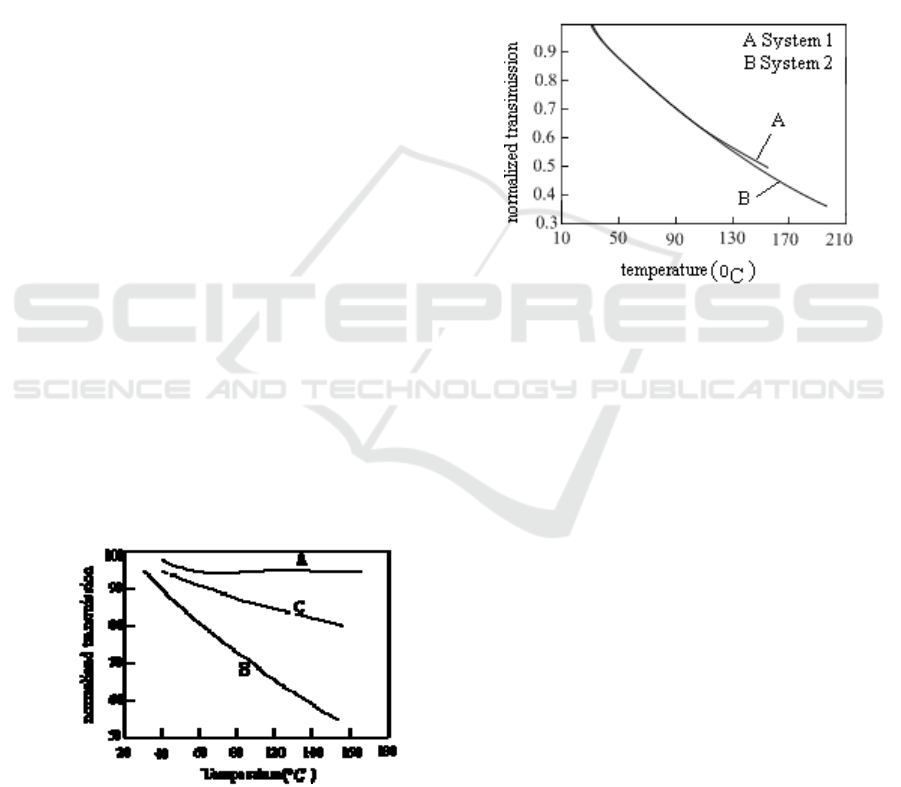
Figure4. Normalized transmission as a function of
temperature of three absorption glasses (20~300C), A, B, C.
4.3 Calibration Graphs
The normalized transmission factor is plotted as a
function of temperature and is Shown in Figure5 (A),
and (B), for a probe-containing ruby and with the
ruby directly in front of the LED.A slightly nonlinear
response results with the experimental points closely
following the smooth response curve. A small
deviation of the system 1 graph (A) occurs as the
normalized transmission decrease due to the small
decrease in the signal/noise ratio. Up to the 130
0
C
limit. For system2, the smooth function continues up
to the maximum temperature of study, 200℃.
Figure 5. Normalized transmission of probe as a
function of temperature.
5 CONCLUSIONS
A considerably improved performance is seen in this
new device over that discussed using infrared
radiation. The slope of the calibration graph from that
work was 1.7×10
-3
K
-1
and thus it can be seen that
the visible radiation-based device is more sensitive,
with a slope,75
0
C of 4.1× 10
-3
K
-1
.The standard
deviation of the typical reading was measured as
0.11
0
C.Hence,the temperature accuracy of this
reading is ±0.6
0
C using the ‘best-fit’ curve drawn
on Figure5.The calibration graph was shown to be
highly reproducible when the probe is temperature
cycled. Drift of the device is low and problems of
LED ageing will not be significant if the diode is not
severely overrun in terms of the applied current. A
change in drive current from 5 to 30mA yields a
spectral shift of the peak emission of only a few
nanometers. As the ruby absorption bands are broad
this will cause only a negligible change in the
fluorescent intensity of emission and the effect on the
determination of the absorption profile of the OG550
glass will also be very small. The drive current to the

LED can easily be kept within the required narrowly
defined bounds through the control circuitry.
ACKNOWLEDGEMENTS
This project is supported by the Key project of Hebei
Provincial Department of Education
(No.ZD2016040) ; This project is supported by
Hebei science and technology research
item(No.12201708D); The project is supported by
Hebei Normal Universty application fund
(No.L2015k09).
REFERENCES
1. XiaXiang, JianbinShi, FenghongHuang, Mingming
Zheng, Qianchun Deng.Quantum dots-based label-free
fluorescence sensor for sensitive and non-enzymatic
detection of caffeic acid.Talanta, Volume 141, 15
August 2015, Pages 182-187.
2. Tae-Jin Kim, Kyung-A Kim, Sang Hoon Jung.
Development of an endoplasmic reticulum calcium
sensor based on fluorescence resonance energy
transferShort communication. Sensors and Actuators
B: Chemical, Volume 247, August 2017, Pages 520-
525.
3. Florent Lefèvre, Philippe Juneau, Ricardo Izquierdo.
Integration of fluorescence sensors using organic
optoelectronic components for microfluidic
platform.Sensors and Actuators B: Chemical, Volume
221, 31 December 2015, Pages 1314-1320.
4. Chunlei Yang, Wenping Deng,Haiyun Liu, Shen
guang Ge, Mei Yan. Turn-on fluorescence sensor for
glutathione in aqueous solutions using carbon dots–
MnO2 nanocomposites.Sensors and Actuators B:
Chemical, Volume 216, September 2015, Pages 286-
292.
5. Hong zhi Lu, Shoufang Xu. Visualizing BPA by
molecularly imprinted ratiometric fluorescence
sensor based on dual emission
nanoparticles.Biosensors and Bioelectronics, Volume
92, 15 June 2017, Pages 147-153.
