
Optic-fiber Sensor Based on Fluorescence Spectrum Analysis
Jinling Wu
1
, Hualong Yu
2
and Junhai Yang
3
1
Institute of Occupation Technical , Hebei Normal University, Shijiazhuang , China
2
Institute of Education, Hebei Normal University, Shijiazhuang , China
3
Shijiazhuang Municipal Public Security Bureau,Shijiazhuang, China
Keywords: Fluorescence optic-fiber thermometer; ruby material; Fluorescence Spectrum Analysis.
Abstract: A kind of fluorescence optic-fiber thermometer is devised based on the solid-state ruby fluorescence
material. The characteristic of fluorescence material absorption and emission is analysised, and the optic-
fiber temperature measurement probe based on ruby is developed. This system is particularly adapt to the
temperature measurement in the rang of 20℃ to 600℃. During the cause of experimentation, this
temperature measurement method is proved to be effective and useful for its highly resolution and precision.
1 INTRODUCTION
Apart from being a desirable precious gem stone,
ruby is well-known as the laser crystal used in the
world’s first successful operation of a laser. It is also
among the earliest of materials for which the
fluorescence lifetime properties were proposed for
thermometric applications [1]. The actual use of
ruby as the sensor element in a fiber optic
fluorescence lifetime thermometer was perhaps first
reported by Grattan [2] [3]. In this thermometer
system, an LED was used as the excitation light
source and a silicon PIN diode was employed for the
detection of the fluorescence signal. Using that
system, temperature measurement was achieved
over the region from room temperature to
1700C.This thermometer system described below is
devised in an effort to extend the measurement range
of this compact and low-cost system and further
improve and conveniently extend its performance.
2 DESCRIPTION OF THE DEVICE
This ruby fluorescence thermometer is schematically
depicted in Figure 1.A green LED was used as the
excitation source, which can pump into the strong
absorption band centered at 550nm[4], as show in
the absorption spectrum of ruby in figure 2.As the
radiation of the green LED contains a weak emission
band in the red portion of visible spectrum, which
overlaps part of the fluorescence emission spectrum,
a short pass optical filter, F1 shown in Figure1, with
a cut-off wavelength at 630nm is used to eliminate
this red ‘tail’ of the LED emission. The fluorescence
emission spectrum is obviously at longer
wavelengths, as shown in Figure3, with the strongest
emission on the R-lines (around694nm). Thus, a
readily available long-pass doped glass filter could
then be used as the filter, F2 in figure1, to isolate the
excitation light from the fluorescence emission at the
detector stage. However in order to achieve better
isolation, an ‘off-the-shelf’ band-pass interference
filter with the pass-band centered at 694.3nm and a
bandwidth of 12nm, designed for laser uses, was
employed as the F2 instead in Figure1.
Figure1. The ruby fluorescence lifetime based fiber optic
thermometer system.
F1: short-pass optical filter; F2: R-line band-pass optical
filter.
LPF
y
De l a y
Ta
Photo-
detector
LED
Dr i ve r
Green LED
Temperature probe
mi x
v
∫
−
r
v
cc
Vk
=
ω
m
v
c
v
VCO
τ
0
xT =
Optical Fibers
Lifetime output
F2
F1
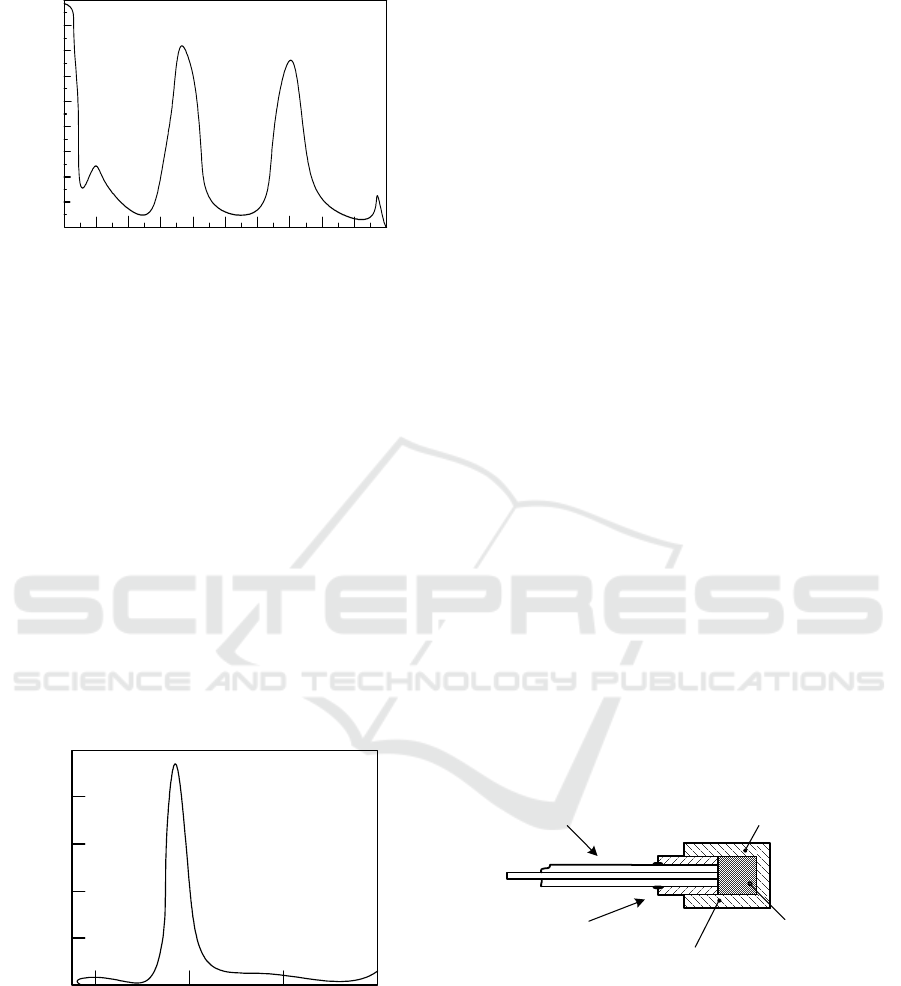
Figure 2.The absorption spectrum of ruby.
In this system, gold-coated silica fibers were first
used to fabricate the probe for temperature
measurement up to 6000C.The core diameter of the
fiber used was 400µm. The probe was configured in
the reflection-type configuration, it is shown in
figure 4.
Due to the relatively low emission intensity of
the LED light source then available, the intensity of
the induced fluorescence respond which could be
detection of several nanowatts. Thus a
comparatively poor signal-to-noise ratio of the
detected fluorescence response was observed, An
even less favorable signal-to-noise ratio would be
expected at higher temperatures due to decrease in
the fluorescence intensity with the increasing
temperature.
Figure3.The emission spectrum of ruby.
To tackle the poor signal-to-noise ratio problem
the ‘phase and modulation method’ [3] to measure
the fluorescence life time, with the employment a
fixed frequency, high Q-value bandpass electronic
filter to the wideband noise in the fluorescence
signal. Though the effectiveness of this scheme
adequately demonstrated, its measurement range is
limited by the fixed single modulation frequency,
and a slight drift in the parameters of the high Q-
value bandpass filter could introduce error in the
phase measurement.
To solve this problems, the PLD-PMSR[5]
technique was applied to the ruby based
thermometer system, as shown in Figure1.Here,the
phase shift ratio,α,is chosen to be 3/8,an optimum
value according to the discussion given earlier, and
tugging of he lifetime to period conversion.
3 THE DESIGN OF HIGH-
TEMPERATURE FIBER PROBE
The novel feature of the temperature probe used is
the use of gold-coated fibers, which h are well suited
to the specific application allow high temperatures to
be reached, as they have more favorable
characteristics for such high temperature regions
than the plastic-clad silica (PCS) fibers used in
earlier work[3]. Which is soldered using gold-
working techniques developed specifically to secure
it to the end of the optical fibers. This enabled a
strong and secure joint to be made and produced a
probe, which could be totally immersed in the hot
region, where the measurement is to be made. As the
fiber was small, the gold and crystal were of small
mass, and so the thermal response of the device
could be relatively rapid and the cost of expensive
material kept low. The aim was to measure
continuously over the range from room temperature
to 6000C.
Figure 4.Schematic of the fiber-optic probe used with the
ruby fluorescence lifetime based thermometer described in
this system.
The feasibility of developing such a high-
temperature fiber optic probe was based on the
availability of fibers with a high-temperature cality.
Normal plastic-clad silica (PSC) fiber is limited to a
maximum operating temperature of 1500C but in
order to exploit the much higher temperature
700
Absorption Coefficient,
200
300
400 500
600
Wa v e l e n g t h , n m
cm
-
1
0
0.4
0.8
1.2
1.6
2.0
2.4
2.8
3.2
650
Wavelength, nm
800
E
m
i
s
s
i
o
n
i
n
t
e
n
s
i
t
y
700
750
10
0
2
4
6
8
Al
2
O
3
:0.1%Cr
3+
Ruby crystal
a brass tube bonding the fiber
bundle
A brass cap holding the sensor material
Solder joint
Gold-coated
optical fibers
capability of sapphire-based sensor materials such as
ruby, another type of fiber is needed, such as that
available in gold coated form, fabricated, and of the
types available the highest temperature capability
has an upper limit of 7500C.This considerable
improvement over PCS fibers is achieved through
the use of a thin gold coating on the silica material.
The probe was constructed[6] with four 400-μm
fibers using two of them to carry the excitation light
and two to receive the fluorescence a compromise of
flexibility and sufficient fiber end-face arear. The
fibers were of fused silica core and doped silica
cladding. The numerical aperture was 0.22 and the
clad-to-core ratio of diameter used was 1:1.1[7].A
particular advantage of such fiber was that the metal
coating offered the additional possibility of a direct
metal to metal seal between this fiber coating and
the metal capsule containing the ruby material. The
thinness of the fiber coating,however, meant that
considerable research was needed to develop
optimum techniques for achieving this joint,
avoiding stripping the coating from the fibers and
overheating the joint[7].
A number of probe-fabrication techniques were
tried before a successful and reproducible technique
was established, such as using gold solders and
fluxes , and a low temperature flux was finally
chosen as the most suitable. It proved impossible, as
expected, to use a conventional soldering iron and a
soldering iron burner combination for jointing as this
crude approach merely resulted in the stripping of
the gold from the fiber. The probe was fabricated
using a modified vacuum-deposition plant. The
method was described in detail in reference and a
schematic of device is shown in figure4.
4. THE EXPERIMENTATION OF
THE THERMOMETER
SYSTEM
The fluorescence lifetime output was monitored via
the period of the modulation frequency as indicated
in Figure1, and a characteristic calibration curve is
shown in figure5 on a logarithmicscale, over a range
from 30
0
C to 50
0
C.In the region between 150
0
C and
450
0
C, maximum sensitivity is seen. Beyond
500
0
C,the calibration curve tends to ‘flatten out’
quite dramatically, and the sensitivity of
measurement achievable in this region is limited, as
shown by the dashed line in Figure5, which
represents the relative temperature sensitivity of the
observed fluorescence lifetime,
ττ
Δ
s , defined as:
()
T
s
Δ
Δ
=
Δ
ττ
ττ
(1)
Where
τ
is the observed lifetime;
τ
Δ
and
T
Δ
are the increments of the lifetime and
temperature.
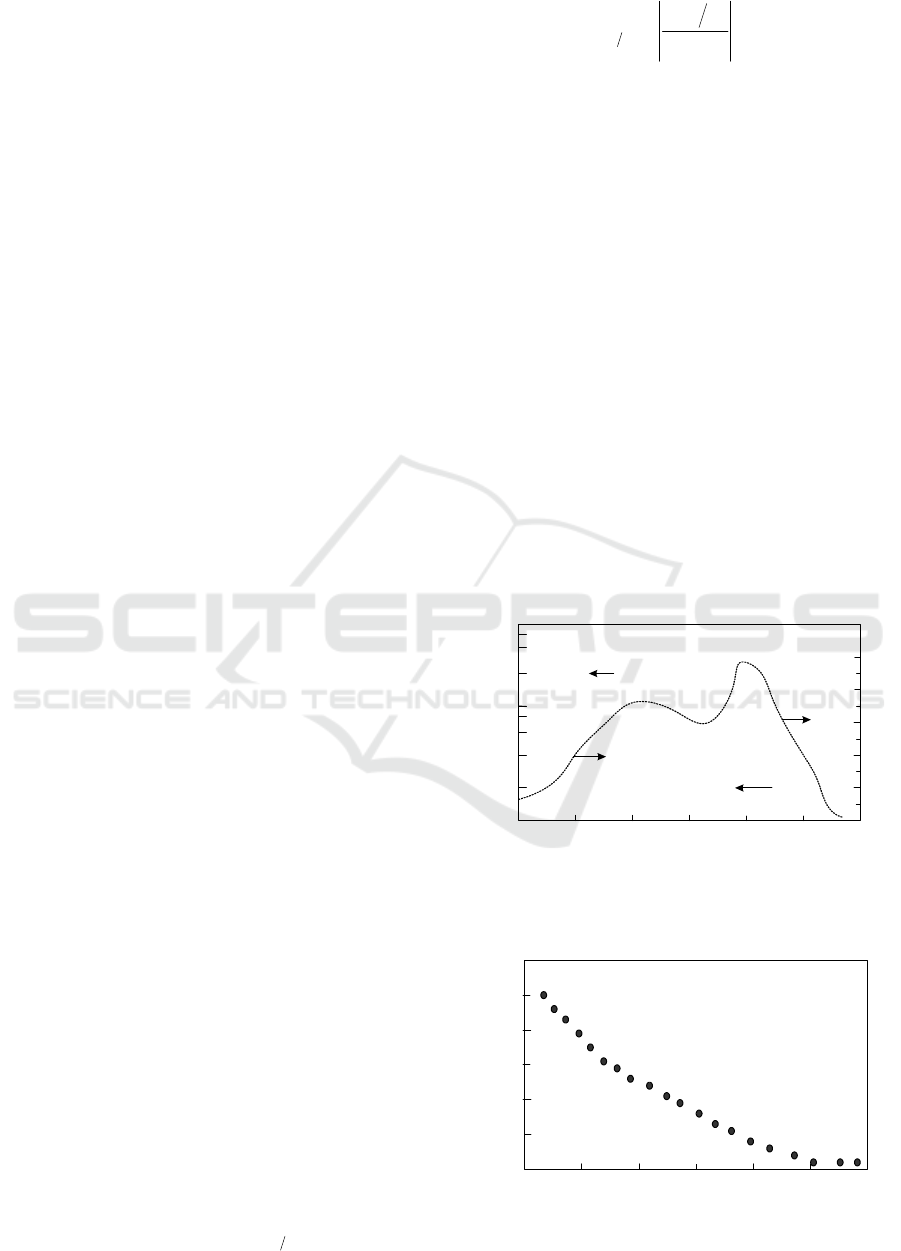
The intensity of the fluorescence emission with
temperature change[10], detected at the
photodetector stage, is shown in Figure6.It falls off
rapidly with temperature increase over the whole
temperature region. This result doesn’t contract the
earlier experimental evidence of Burns and
Nathan[11] who showed that the fluorescence
quantum efficiency of the ruby fluorescence,
integranted over the entire band from 620nm to 770
nm, is independent of temperature in the region
from –1960C to 2400C,for the emission detected
here is only the R-line part of the total fluorescence
emission. The reduction in R-line emission intensity
with temperature increase, from room temperature to
2400C,was mainly due to the increasing thermal
elevation of the excited Cr
3+
ions from the 2Estate to
the
4
T2state.This is supported by the research on the
temperature dependence of ruby fluorescence which
shows an increase in broadband emission with
temperature increase over the above region.
Figure 5. Chracteristic calibration curve for the ruby
fluorescence based thermometer in the region from roo
temperature to –5500C.
Figure 6. The ruby intensity recorded in the experiment.
600
100
200
300 400
500
0.1
8
2
4
6
1
2
4
3
1
0
0.2
0.4
0.6
0.8
*
*
*
*
*
*
*
*
*
*
*
*
*
*
*
*
**
Relative Sensitivity,%/
0
C
Observed Lifetime,ms
Temperature,
0
C
600
100
200
300 400
500
100
0
20
40
60
80
T e m p e ra tu re ,
0
C
F luorescence intensity,%

Intrinsically, the ruby fluorescence lifetime is not
suitable for the sensing of temperature below a
temperature approximately defined by the water
freezing point(0
0
C),as its temperature sensitivity is
quite low over that region. Low sensitivity has also
limited the performance of the ruby based
thermometer system up to 50
0
C,and thus poor
measurement reproducibility was found at 40
0
C for
the system shown in Figure1,where the long-term
drift in the time-constant of the entire electronic
system, especially that of the high-gain
photodetector, could be much higher than the
resolvable change in the fluorescence lifetime.
5 CONCLUSIONS
As with all other thermometer systems based on the
fluorescence of refractory materials, the highest
temperature which could be measured is generally
limited by the difficulty in the detection of the
extremely short lifetime under increasingly poor
signal-to-noise conditions, caused by low
fluorescence efficiency and shortening lifetime at
high temperature. From the data in the
experimentation at 6000C the fluorescence intensity
is reduced to 0.7% of its maximum value, occurring
at 3400C,and the fluorescence lifetime is 1μs. A
cost-effective solution to further extending the high
temperaturr measurement limit of a fluorescence
based thermometer can be found through the use of
other fluorescent materials, such as using alexandrite
as the sensing material.
ACKNOWLEDGEMENTS
This project is supported by the Key project of Hebei
Provincial Department of Education
(No.ZD2016040) ; This project is supported by
Hebei science and technology research
item(No.12201708D); The project is supported by
Hebei Normal Universty application fund
(No.L2015k09).
REFERENCES
1. Quero, M. Consales, A. Crescitelli, A. Ricciard, E.
Esposito, A. Cutolo, A. Cusano Two dimensional
hybrid metallo-dielectric nanostructures directly
realized on the tip of optical fibers for sensing
applications Proc. SPIE, 8774 (2013), pp. 1-10.
2. Consales, A. Ricciardi, A. Crescitelli, E. Esposito, A.
Cutolo, A. CusanoLab-on-fiber technology: toward
multifunctional optical nanoprobes ACS Nano, 6 (4)
(2012), pp. 3163-3170.
3. Yuan, C. Zhao, M. Ye, J. Kang, Z. Zhang, S. JinA
Fresnel reflection-based optical fiber sensor system for
remote refractive index measurement using an OTDR
Photon. Sens., 4 (1) (2014), pp. 48-52.
4. C. Chen, Y.-S. Yu, R. Yang, C. Wang, J.-C. Guo, Y.
Xue, Q.-D. Chen, H.-B. SunReflective optical fiber
sensors based on tilted fiber Bragg gratings fabricated
with femtosecond laserJ. Lightwave Technol., 31 (3)
(2012), pp. 455-460.
5. Vallan, M.L. Casalicchio, M. Olivero, G. PerroneTwo-
dimensional displacement sensor based on plastic
optical fibers IEEE Trans. Instrum. Meas., 62 (5)
(2013), pp. 1233-1240.
6. Orĺowska, P. Słupski, M. Świątkowski, P. Kunicki, A.
Sankowska, T. GotszalkLight tensity Fibre Optic
Sensor for MEMS displacement nd vibration
metrology Opt. Laser Technol., 65 (2015), pp. 159-163.
7. J. Basu, A. Thirumurugan, A.R. Dinesh, C. Anandan,
K.S. RajamOptical oxygen sensor coating based on the
fluorescent quenching of a new pyrene derivative Sens.
Actuators, 104 (2005), pp. 15-22
