
Identification and Determination of Total Flavonoids in Ethanol
Extract of Old and Young Angsana Leaves (Pterocarpus indicus
Willd.) Using Visible Spectrophotometry
M.A.H.F. Fernanda
1
, R.D. Andriani
2
, Z. Estulenggani
2
and G.G. Kusumo
2
1
Faculty of Pharmacy, Universitas Airlangga, Jl. Dharmawangsa Dalam No. 4-6, Surabaya, Indonesia
2
Akademi Farmasi Surabaya, Jl. Ketintang Madya No.81, Surabaya, Indonesia
Keywords: Total Flavonoids, Ethanol Extract, Angsana Leaves, Spectrophotometry.
Abstract: Angsana (Pterocarpus indicus Willd.) is a forest plant widely used as an ornamental garden and as a shade.
In many countries, Angsana is used as a traditional medicine, such as an antidiabetic drug. The compounds
that act as antidiabetes are flavonoids. The purpose of this study was to determine the total flavonoid
content of ethanol extract of old and young Angsana leaves using visible spectrophotometry. The wilstater
test was performed as a qualitative research test to show that the ethanol extract of Angsana leaves contains
flavonoid compounds. AlCl
3
was selected as a reagent in visible spectrophotometry to determine the
flavonoid of Angsana leaf. The result of the accuracy test was 83.67% with acceptance criterion 80-120%
and the precision test is 8.96% with acceptance criterion ≤10%. The total flavonoid levels of ethanol extract
of old and young Angsana leaves were respectively 7.53 ± 0.32% w/w and 3.31 ± 0.07 % w/w.
1 INTRODUCTION
Angsana is one type of forest plant that is widely
used as a protective tree and decoration for city
parks. Angsana is now widely cultivated. In big
cities, Angsana easily found on the highway.
Angsana trees are dense and have beautiful flowers,
so they are widely used as urban decorative plants,
especially as shade plants, noise absorber, and
pollution absorber (Bramasto et al., 2015). In many
countries, Angsana is used as a traditional medicine.
In Indonesia, the young leaves of Angsana are used
as an ulcer medicine and the rash of prickly heat. In
recent years, the Philippines has launched an
Angsana extract product in the form of herbal tea
preparations and pills used to treat leprosy,
menstrual pain, flu, rheumatoid arthritis, and
diabetes (Thomson, 2006). The Chemical content of
Angsana leaves showed positive tests of phenol,
flavonoid, saponin, triterpenoid and tannin
compounds (Junanto et al., 2008). The general
public knowledge around utilizing old Angsana
leaves is limited to shade and as animal feed. The
public has not come to know that the leaves of old
Angsana can also be used as a traditional medicine.
Until now, there has been no research that identifies
and determines the total flavonoid levels in old and
young Angsana leaves. For that, the researchers
intend to do research on the identification and
determination of flavonoid levels of old and young
Angsana leaves. Flavonoid compounds are generally
slightly soluble in water since 96% ethanol was used
as the extraction solvent. The identification was
done by wilstater test and determination of flavonoid
level by a visible spectrophotometric method with
the AlCl
3
reagent.
2 MATERIAL AND METHOD
2.1 Plant Material
Angsana leaves were collected from the Sidoarjo
and Gresik Regencies. Plant determination of
Angsana was done by LIPI, Purwodadi, Pasuruan.
2.2 Chemical
96% ethanol, standard quercetin (Sigma), aluminium
chloride (AlCl
3
), sodium acetate, aquadest, and
magnesium.
Fernanda, M., Andriani, R., Estulenggani, Z. and Kusumo, G.
Identification and Determination of Total Flavonoids in Ethanol Extract of Old and Young Angsana Leaves (Pterocarpus indicus Willd.) Using Visible Spectrophotometry.
DOI: 10.5220/0007546605410544
In Proceedings of the 2nd International Conference Postgraduate School (ICPS 2018), pages 541-544
ISBN: 978-989-758-348-3
Copyright
c
2018 by SCITEPRESS – Science and Technology Publications, Lda. All rights reserved
541

2.3 Instrument
UV-Vis Spectrophotometer X-ma 1200 Human
Corp., macerator, vacuum rotary evaporator,
analytical scales, and analytic glassware.
2.4 Preparation and Extraction
Angsana leaves, both old and young, were taken at
random and then sorted and washed until clean, then
chopped and dried respectively. The dry leaves were
then milled. The preparation of the extract was
carried out by maceration by dissolving 200 g of
simplicia with 1000 mL of 96% ethanol solvent. The
result of maceration was then concentrated using
Rotary Vaccum Evaporator until a viscous extract
was obtained.
2.5 Qualitative Test
2 ml of Angsana leaves extract were taken and put
into a tube. 0.5 ml of concentrated HCl and 0.02 mg
of Magnesium were then added and mixed. The
presence of flavonoids is characterized by the
occurrence of discoloration. The reduction with
concentrated Mg and HCl produced red, yellow or
orange colors (Robinson, 1995).
2.6 Quantitative Test
2.6.1 Quercetin Standard Curve
Quercetin was weighed for as much as 50 mg and
inserted into a 50 mL measuring flask, then
dissolved with 96% ethanol. Then, it was diluted
through 20 consecutive concentrations; 40; 60; 80;
and 100 ppm. 5 ml were added in 15 ml of 96%
ethanol, 1 ml of 10% aluminum chloride, 1 ml of 1
M sodium acetate, and 28 ml of aquadest. Then, the
mixture was incubated at room temperature for 30
minutes. The blank sample production was done
without the addition of aluminum chloride. The next
stage was the measurement standard curve level
using visible spectrophotometry with a wavelength
of 439 nm (Chang et al., 2002). Then, a calibration
curve was made by connecting the absorption value
and the concentration.
2.6.2 Determination of Flavonoid Levels
Samples of 100 mg were weighed and inserted in a
100 mL measuring flask and then dissolved with
96% ethanol. Samples of 5.0 mL were each added
with 15 ml of 96% ethanol, 1 ml AlCl3, 1 ml of 1 M
sodium acetate, and 28 ml of aquadest. Then, they
were incubated at room temperature for 30 minutes.
The next stage was sample rate measurement using
visible spectrophotometry with a wavelength of 439
nm.
2.6.3 Accuracy and Precision
A sample of 50 mg was weighed and inserted in a 50
mL measuring flask and then dissolved with 96%
ethanol. A standard of 1000 ppm was made by
weighing 50 mg quercetin dissolved in 50 ml
ethanol 96%. 1 ml sample 1000 ppm was extracted
using pipette and inserted into 100 ml measuring
flask. 6 ml of 1000 ppm quercetin solution was
added until the water surface reached the limit
indicator. The flask was then shaken until the
solution was perfectly mixed. 5 ml of each sample
was extracted using pipette and added with 15 ml of
96% ethanol, 1 ml of aluminum chloride, 1 ml of 1
M sodium acetate and 28 ml of aquadest. Then, it
was incubated at room temperature for 30 minutes.
The next step was to measure the sample content
using visible spectrophotometry with a wavelength
of 439 nm (Chang et al., 2002). The procedure was
replicated 6 times (Riyanto, 2014).
3 RESULTS AND DISCUSSION
Flavonoid compounds can be separated from various
other compounds by maceration using 96% ethanol
solvent for analysis. The maceration results were
then concentrated using a vacuum rotary evaporator,
so as to produce a sample in the form of thick
extracts. Then, the extract was evaporated again
through aeration to produce dry extract. The
separated flavonoids were determined using visible
spectrophotometry. The standard comparison used
was quercetin, where quercetin is a type of flavonoid
compound that is most widely distributed in nature.
The results of determination indicate that the
sample used in this study was Angsana with
Pterocarpus indicus Willd species. Extraction
resulted in 200 g of Angsana leaf sample, which was
produced through 96% ethanol solvent with as much
as 1000 mL by maceration method, resulting in a
thick extract of each 2.4 g for old Angsana leaves
and 12.4 g for young Angsana leaves. Qualitative
test results showed positive results with change of
color from dark green to yellowish green.
Flavonoids are compounds containing two aromatic
rings with more than one hydroxyl group. Reduction
with concentrated Mg and HCl produces red, yellow,
or orange colors (Robinson, 1995).
ICPS 2018 - 2nd International Conference Postgraduate School
542
Before conducting a quantitative test, the
determination of the maximum wavelength was
done using quercetin work standard with a
concentration of 80 ppm in ethanol solvent 96% pa.
The absorbance reading was carried out at a
wavelength of 400 - 800 nm. The wavelength
produced a determination of total flavonoid of 439
nm. The wavelength was then used to measure the
uptake of the calibration curve and the samples of
Angsana leaf extract.
This study began with a verification test.
Verification testing is an analytical method used to
prove that the laboratory concerned is capable of
testing using the method with valid results (Gandjar
and Rohman, 2007).
The calibration curve obtained linear regression
equation, that is y = 0.008x - 0.002, with correlation
coefficient r = 0.999. The angsana leaf extract was
then tested by the quantitative colorimetric method.
The principle of the method of colorimetry is the
formation of a complex between aluminum chloride
and ketone groups at C-4 and hydroxy groups at
adjacent C-3 and C-5 of flavon and flavonol groups.
The compound used as a standard for the
determination of this flavonoid level is quercetin
since quercetin is a flavonoid group having keto
groups in C-4 atoms and also hydroxyl groups on
adjacent C-3 and C-5 (Azizah et al., 2014).
In the determination of total flavonoid levels, the
addition of sodium acetate was intended to detect the
presence of a 7-hydroxyl group (Mabry et al., 1970),
while the 30-minute incubation treatment carried out
was intended to allow the reaction to run perfectly,
thus providing maximum color intensity. The
determination of total flavonoid content from old
and young Angsana leaf extract resulted in Angsana
content of 7.53% ± 0.32% w/w (Table 1) and 3.31 ±
0.07% w/w (Table 2), respectively. Based on the
results obtained between old and young angsana
leaves, it was found that the old angsana leaves
contain more flavonoids. Therefore, the use of old
angsana leaves is more recommended than young
angsana, especially when traditionally used by the
community.
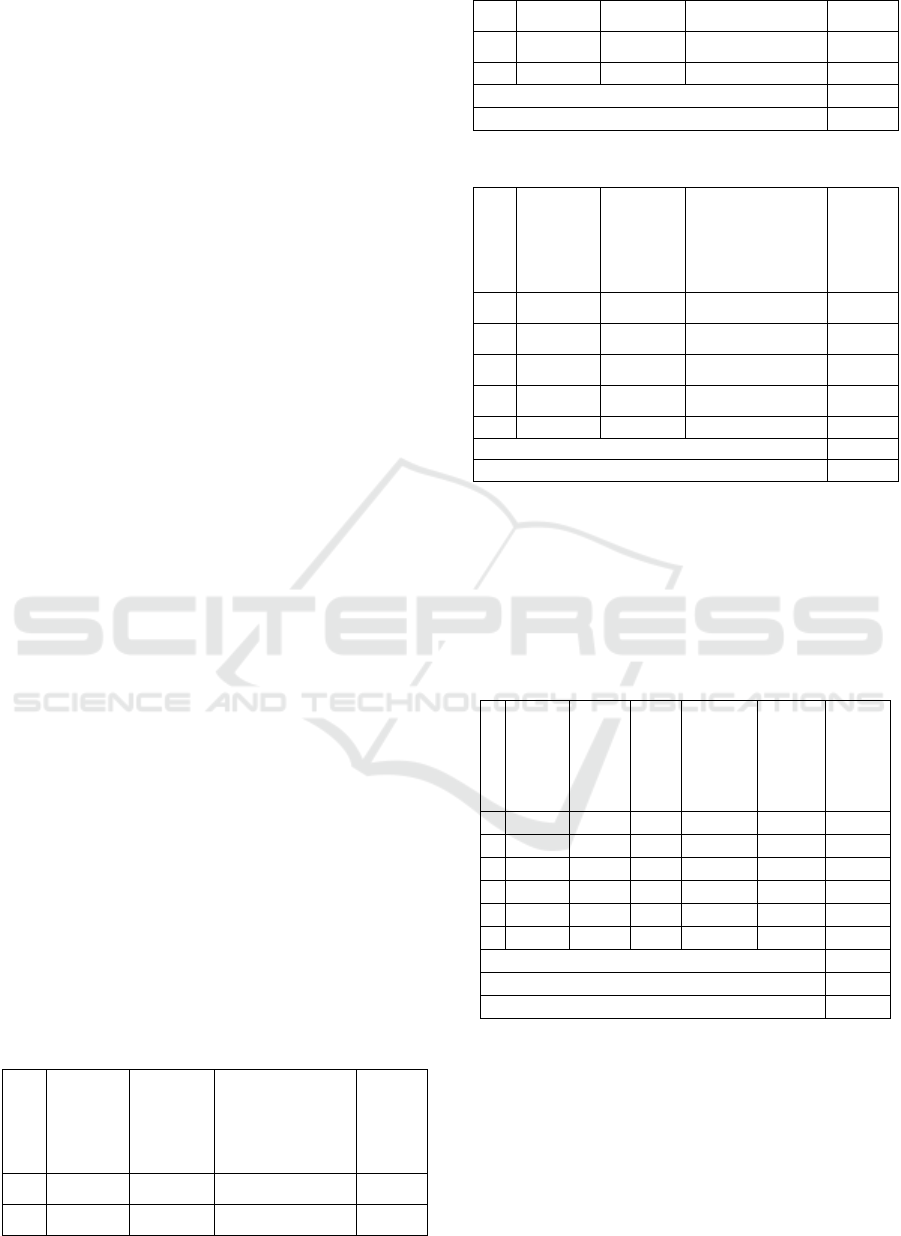
Table 1: Quantitative test result of old angsana leaves.
No The
weight
of the
sample
(g)
Absor
bance
Flavonoids in
the sample
(mg/100 mL)
%w/w
1 0.1005 0.307 7.725 7.687
2 0.1004 0.313 7.844 7.844
3 0.1004 0.279 7.025 6.997
4 0.1006 0.301 7.575 7.530
5 0.1007 0.303 7.625 7.572
x
7.53
SD
0.32
Table 2: Quantitative test result of young angsana leaves.
No The
weight
of the
sample
(g)
Absor
bance
Flavonoids in
the sample
(mg/100 mL)
%w/w
1 0.1001 0.114 2.9009 2.898
2 0.1004 0.125 3.1769 3.164
3 0.1003 0.136 3.4525 3.442
4 0.1004 0.138 3.5031 3.489
5 0.1004 0.141 3.5784 3.564
x3.31
SD 0.07
Previously, precision test and accuracy test with
a recovery of 83.67% and RSD of 8,96% have been
done (Table 3). The acceptance criteria used in the
study are 80-120% for accuracy, and from the
achievement of ≤ 20% precision it can be concluded
that the precision and accuracy test has met the
requirements (Anonim, 2004).
Table 3: Test Result of Accuracy and Precision.
N
o.
The
weight o
f
the
sample
(g)
Sample
(Abs)
Conc.
Sample
(ppm)
Sample+
Quercetin
(Abs)
Conc.
Sample +
Quercetin
(ppm)
Accuracy
( % )
1. 0.0503 0.068 8.7327 0.471 59.2974 84.275
2. 0.0500 0.075 9.6110 0.415 52.2710 71.100
3. 0.0500 0.042 5.4705 0.486 61.1794 92.848
4. 0.0500 0.059 7.6035 0.442 55.6587 80.092
5. 0.0506 0.071 9.1092 0.491 61.8086 87.832
6. 0.0500 0.077 9.8620 0.492 61.3920 85.883
x 83.67
SD 7.45
RSD (Precision) 8.96
4 CONCLUSIONS
Based on the results, it can be concluded that the
extract of old and young Angsana leaves contains
flavonoid compound with total levels of flavonoids
of ethanol extract being 7.53 ± 0.32% w/w and 3.31
± 0.07% w/w, respectively.
Identification and Determination of Total Flavonoids in Ethanol Extract of Old and Young Angsana Leaves (Pterocarpus indicus Willd.)
Using Visible Spectrophotometry
543

REFERENCES
Adam, M. M. 2014. Analisis Kadar Senyawa Flavonoid
Ekstrak Metanol Daun Lamtoro (Leucaena
Leucocephala) dengan Metode Spektrofotometri UV-
VIS. Jurnal Pendidikan Kimia. Vol 8(3): 183-187.
ISSN: 2085-3653
Anonim. 2004. Guidelines for the Validation of Analytical
Methods for Active Constituent, Agricultural, and
Veterinary Chemical Products. APVMA. Australia.
Azizah, D., N., Kumolowat, E., Faramayuda, F. 2014.
Penetapan Kadar Flavonoid Metode ALCL3 Pada
Ekstrak Metanol Kulit Buah Kakao (Theobroma cacao
L.). Kaertka Jurnal Ilmiah Farmasi 2 (2): 45-49.
Desember, ISSN:2354-6565.
Bramasto, Y., Nurhasybi., Syamsuwida, D., Zanzibar, M.,
Pujiastuti, E., Mokodompit S. 2015. Trees of the City.
Bogor: Balai Penelitian Teknologi Pembenihan
Tanaman Hutan.
Chang, C., Yang, M., Wen, H., Chern, J. 2002. Estimation
of Total Flavonoid Content in Propolis by Two
Complementary Colorimetric Methods. Journal of
Food and Drug Analysis. Vol.10: 178-182.
Junanto, T., Sutarno., Supriyadi. 2008. Aktivitas Ekstrak
Angsana (Pterocarpus indicus) terhadap Bakteri
Bacillus subtilis dan Klabsiella pneumonia.
Bioteknologi 5 (2): 63-69. November, ISSN:02167-
6887.
Lumbessy, M., Abidjulu, J., Paendong, J., J., E. 2013. Uji
Total Flavonoid Pada Beberapa Tanaman Obat
Tradisional di Desa Waitina Kecamatan Mangoli
Timur Kabupaten Kepulauan Sula Provinsi Maluku
Utara. Jurnal MIPA UNSRAT. Vol. 2 : 50-55.
Mabry, T.J., Markham, K.R., Thomas, M.B. 1970. The
Systematic Identification of Flavonoid. Springer-
Verlag. Berlin.
Riyanto. 2014. Validasi & Verifikasi Metode Uji: Sesuai
dengan ISO/IEC 17025 Laboratorium Pengujian dan
Kalibrasi. Edisi 1. Cet. 1. Yogyakarta: Deepublish.
Robinson, T., 1995. Th Organic Constituens of Higher
Plants, 6th Ed., Diterjemahkan oleh Kokasih
Padmawinata, Penerbit ITB, Bandung.
Thomson, L. A. J. 2006. Pterocarpus indicus (narra)
Fabaceae (Legume family). Species Profile for Pacific
Island Agroforestry. www.traditionaltree.org
ICPS 2018 - 2nd International Conference Postgraduate School
544
