
Amino Acid and Proximate Compositions of Cultured and Wild
Oreochromis niloticus (Linnaeus 1758) from Makurdi-Nigeria
A.S. Nege
1
and E.T. Akange
2
1
Graduate Student; Fisheries and Marine Biotechnology, Universitas Airlangga, 60286, Surabaya Indonesia
2
Fisheries and Aquaculture Department, University of Agriculture, P.M.B 2373, Makurdi, Nigeria
Keywords: Amino acids, Cultured, Makurdi, Oreochromis niloticus, Proximate compositions, Wild.
Abstract: This study was aimed at identifying the fish habitat that harbors O. niloticus with higher nutrients and
availing these findings for nutritional guidance. Amino acid and proximate compositions of O. niloticus
from Lower Benue River and UAM fish farm were determined monthly for a 3month period, using methods
of Benitez (1989) and AOAC (2006) respectively. The mean of Glutamic acid (12.51±0.64 and 11.85±0.67)
and Alanine (5.40±0.23 and 4.50±0.41) varied significantly (p<0.05) between the wild and cultured while
other amino acids were not. In October, ash (4.62±0.02 and 3.69±0.02), fat (4.71±0.06 and 3.61±0.02),
protein (14.62±0.07 and 9.98±0.02) and moisture (75.67±0.07 and 79.65±0.15) varied significantly between
the wild and cultured O. niloticus. Crude protein (20.46±0.01 and 18.75±0.04) and moisture (69.32±0.02
and 73.35±0.20) significantly varied in November between the samples respectively. Only crude protein
(18.89±0.04 and 20.31±0.06) varied statistically in December between wild and cultured. The mean of
crude protein (17.99±1.22 and 16.34±1.86) and the mean moisture (72.53±1.16 and 74.94±1.52) differed
significantly between the wild and cultured. From these results. O. niloticus wild expressed superiority over
the cultured, however, both River Benue at Makurdi and the UAM fish farm harbor nutritious O. niloticus
which is good for human consumption based on our daily amino acid and protein needs.
1 INTRODUCTION
More recently, fish has become a favorite foodstuff
for many people due to several health reasons (Ali
and Kiumars, 2010). However, considering the
maximum utilization and the knowledge of fish
composition, conducting studies on fish flesh vital in
the fishery industry.
According to Silva and Chamul (2000), the
nutritional composition of fish varies greatly from
one species and individual to another depending on
numerous factors such as age, feed intake, sex, the
environment and season. Puwastien et al., (1999)
stated that fish proximate composition serves as a
good indicator of fish quality, and it varies with
parameters like genetic strain, diet, feed rate and
age.
In order to flourish and maintain bodily
functions, fish similarly to other animals require
different nutrients in sufficient quantities (Ashraf et
al., 2011). It also has the ability to synthesize some
but not all nutrients. Hence, some of these nutrients
must be obtained from outside sources. Apart from
the natural productivity of ponds, cultured fish is
provided with nutrient-rich feed, while captured fish
on the other hand, solely depends on natural food in
the aquatic environment for its survival and
sustenance. These variations have been reported to
directly related to the growth, health and body
composition of fish. Therefore, fish composition is a
good index of fish food availability and feeding
habits (Ashraf et al., 2011).
For the nature of the raw material in fish to be
known before chilling, freezing, smoking orcanning
can be correctly applied. Fish processors are directly
interested in the proximate composition of fish
(FAO, 2004).
Bakir et al., (1993) mentioned that Oreochromis
niloticus, Tilapia zilli, Sarotherodon galilaeus, as
well as Clarias gariepinus, Clarias angullaris and
Heterobranchus longifilis from the Cichlidae and
Clariidae families form part of the freshwater fish
species mostly cultured in the developing nations.
Hence, the need for using cultured and wild O.
niloticus for this study.
Nege, A. and Akange, E.
Amino Acid and Proximate Compositions of Cultured and Wild Oreochromis niloticus (Linnaeus 1758) from Makurdi-Nigeria.
DOI: 10.5220/0007547105670570
In Proceedings of the 2nd International Conference Postgraduate School (ICPS 2018), pages 567-570
ISBN: 978-989-758-348-3
Copyright
c
2018 by SCITEPRESS – Science and Technology Publications, Lda. All rights reserved
567

2 MATERIALS AND METHODS
2.1 Sample Collection
Twelve (12) samples of O. niloticus were collected
for this study, comprising of six (6) samples each
from Lower Benue River at Wadata/Tse-Adee
landing site Makurdi (with average weight of
70.13g) and the University of Agriculture Makurdi
(U.A.M) fish farm (with average weight of 67.42g).
The samples were then taken to the Hydrobiology
and Fisheries Research laboratory, University of Jos,
Plateau State, Nigeria where the laboratory analyses
were conducted.
2.2 Study Duration
The duration for this study was three (3) months,
and the laboratory analysis of fish carcass was
carried out in a monthly basis from October to
December, 2014.
2.3 Amino Acid Profile Determination
The Amino acid profile in the known sample was
determined using methods described by Benitez
(1989) in Technicon sequential Multi-Sample
Amino Acid Analyzer (TSM).
2.4 Determination of Proximate
Composition
Proximate composition of moisture, crude protein,
fat, and ash was determined based on the method
described by the Association of Official Analytical
Chemists (AOAC, 2006). All values of proximate
parameters were converted and presented on wet
weight basis after each calculation.
2.5 Statistical analysis
Student t-test and descriptive statistics (mean and
standard error of the means) were used to analyze
the data obtained from this work.
3 RESULTS
A comparison between the amino acid profiles of O.
niloticus from Lower Benue River and that of
U.A.M fish farm indicated a significant difference
(p<0.05) between Glutamic acid (12.51±0.64 from
the river and 11.85±0.67 from the pond) and also,
Alanine (5.40±0.23 from the wild and 4.50±0.41
from the cultured) while the rest amino acids
remained insignificantly different (p<0.05) as shown
in Table 1.
Table 1: Amino acid profiles of O. niloticus from Lower
River Benue and U.A.M fish farm
Source
Amino Acid
( g/100g
p
rotein)
Lower
River
Benue
UAM
Farm
P-Value
Lysine 6.84±0.28 6.78±0.28 0.681
Histidine 2.07±0.13 2.03±0.08 0.267
Arginine 5.97±0.21 5.29±0.21 0.681
Aspartic aci
d
8.96±0.19 8.47±0.31 0.732
Threonine 2.52±0.22 2.31±0.15 0.851
Serine 4.08±0.15 3.52±0.25 0.623
Glutamic aci
d
12.51±0.64 11.85±0.67 0.047*
Proline 4.21±0.24 3.81±0.34 0.241
Glycine 6.59±0.22 5.47±0.37 0.369
Alanine 5.40±0.23 4.50±0.41 0.047*
Cystine 0.79±0.07 0.73±0.06 0.091
Valine 4.12±0.29 3.53±0.27 0.235
Methionine 2.26±0.09 2.19±0.06 0.414
Isoleucine 3.44±0.16 3.15±0.09 0.364
Leucine 6.87±0.15 6.51±0.22 0.259
Tyrosine 2.89±0.15 3.00±0.09 0.871
Phenylalanine 3.81±0.13 3.65±0.21 0.681
*indicates statistical difference
(p<0.05). Source: Laboratory work.
Table 2 shows the results of monthly proximate
compositions of O. niloticus from Lower Benue
River and that of U.A.M fish farm. It reveals that all
proximate parameters varied significantly (p<0.05)
during the month of October with fat (4.71±0.06
and 3.61±0.02), ash (4.62±0.02 and 3.69±0.02),
crude protein (14.62±0.07 and 9.98±0.02) and
moisture (75.67±0.07 and 79.65±0.15) for O.
niloticus from Lower Benue River and that of
U.A.M fish farm respectively.
During the month of November, fat and ash did
not vary significantly while crude protein and
moisture varied significantly at p<0.05 with the
following values; 20.46±0.01 and 18.75±0.04 crude
protein and moisture content of 69.32±0.02 and
73.35±0.25 of O. niloticus from the river and fish
farm respectively as shown in Table 2. In December,
the results showed that only crude protein
(18.89±0.04 and 20.31±0.06) varied significantly
between wild and cultured O. niloticus while the
other parameters were not statistically different
(p<0.05) as equally showed in Table 2.
Variations in all the proximate parameters for the
entire study period (Oct. to Dec.) shows that the
mean of crude protein (17.99±1.22 and 16.34±1.86)
and the mean of moisture (72.53±1.16 and
ICPS 2018 - 2nd International Conference Postgraduate School
568
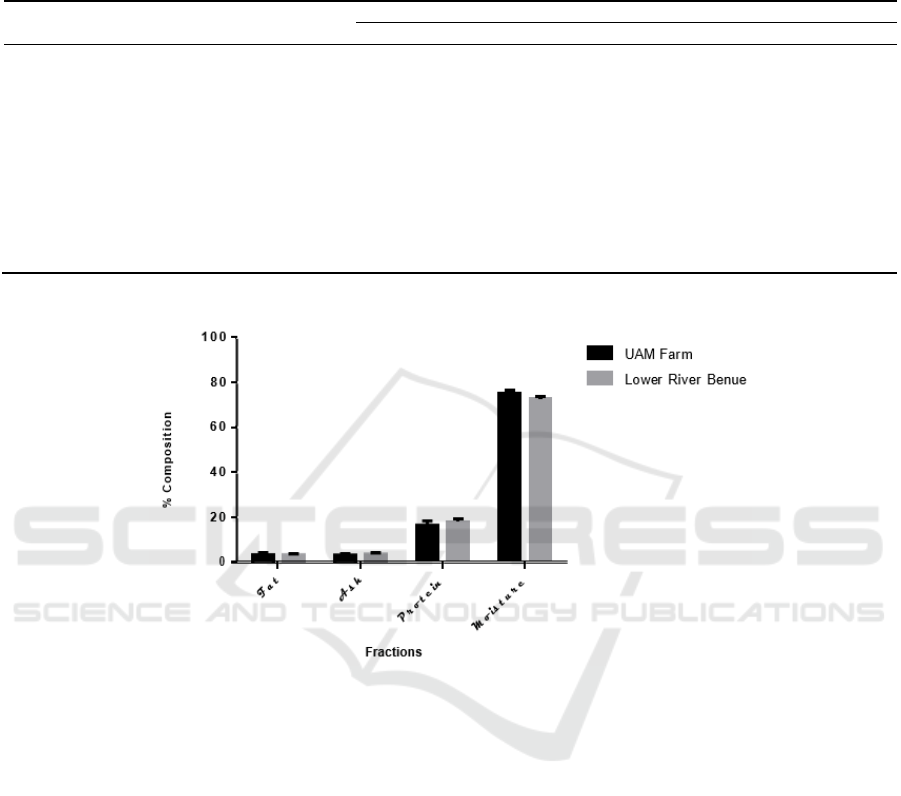
74.94±1.52) differed significantly (p<0.05) while fat
and ash were not significantly different through the
period between O. niloticus from Lower Benue
River and U.A.M fish farm as shown in Figure 1.
Table 2: Monthly Variation of Proximate compositions of O. niloticus from Lower Benue River and U.A.M fish farm
Fraction
Month Source Fat Ash Protein Moisture
Octobe
r
Lower River Benue 4.71±0.06 4.62±0.02 14.62±0.07 75.67±0.07
UAM Farm 3.61±0.02 3.69±0.02 9.98±0.02 79.65±0.15
P-value 0.039* 0.035* 0.013* 0.039*
November Lower River Benue 2.88±0.02 1.62±0.02 20.46±0.01 69.32±0.02
UAM Farm 3.12±0.07 2.07±0.06 18.75±0.04 73.35±0.25
P-value 0.056 0.058 0.037* 0.030*
December Lower River Benue 2.89±0.08 4.65±0.04 18.89±0.04 72.59±0.25
UAM Farm 3.39±0.04 4.16±0.04 20.31±0.06 71.83±0.01
P
-value 0.068 0.079 0.041* 0.16
0
*indicates statistical difference (p<0.05).
Source: Laboratory work.
Figure 1: Mean proximate compositions of O. niloticus from Lower Benue River and U.A.M fish farm
4 DISCUSSION
The mean ash values for O. niloticus from Lower
Benue River (3.63±0.59) and U.A.M (3.31±0.48)
did not fall in same range with the results obtained
by Osibona et al., (2009) from Tilapia zilli
(1.2±0.2% ash). This difference may be due to
environmental factors and variation in the ages of
fish samples used. Crude protein result of O.
niloticus from Lower Benue River (17.99±1.22) was
higher than the crude protein value of O. niloticus
from the wild (14.328 Cp) studied by Ayeloja et al.,
(2013) but lower than that of wild Tilapia zilli
(19.0±1.9) obtained by Osibona et al., (2009). When
the crude protein of O. niloticus from Lower Benue
River (17.99±1.22) and U.A.M (16.34±1.86) are
compared, there was a variation of 1.65%. However,
all the values of mean crude protein from this study
lie within the range obtained from the findings of
Eyo (2001) which was between 15-20% crude
proteins in fresh fish tissues. This indicates that fish,
irrespective of their species and source of capture,
have a certain range for their crude protein content.
When the mean moisture value of O. niloticus
from Lower Benue River is compared with that of
U.A.M, it indicated a significant variation (p<0.05)
which clearly justifies the fact that fish from same
species obtained from different environments could
vary in term of their nutrient contents. The mean of
moisture contents of O. niloticus from Lower Benue
River and U.A.M were all notably less than the
moisture content of O. niloticus obtained by Eyo.
This could be due to difference in geographical
location. Oreochromis niloticus obtained from
Lower Benue River had moisture content of
72.53±1.16. When compared with the 78.325%
Amino Acid and Proximate Compositions of Cultured and Wild Oreochromis niloticus (Linnaeus 1758) from Makurdi-Nigeria
569

moisture obtained from wild O. niloticus by Ayeloja
et al., (2013), there was a difference of 5.80%. This
difference could probably be due to differences in
fish age, feed intake, location, and even sexes as
reported by Silva and Chamul (2000) and Eyo
(2001).
In terms of fat, the results of Ramlah et al. (2016)
from Indonesian wild and cultured O. niloticus (0.10
and 0.18 respectively) were far lower than fat
contents of this study (3.49±0.387 and 3.37±0.092
respectively).
The crude protein of wild O. niloticus
(18.46±1.22) from this study was higher compared
to that of wild
O. niloticus from Indonesia which was 12.94 as
reported by Ramlah et al (2016). However, the
cultured O. niloticus from this study which had
15.87±1.86 is 0.92% less than the 16.79 obtained
from cultured Indonesian O. niloticus by Ramlah et
al. (2016).
The variations in amino acid content and
proximate compositions in this study were possibly
due to differences in capture environments, months
of the year, the food availability, sexes, age and
sizes of the sample fishes used.
5 CONCLUSIONS
This research clearly reveals the superiority in
nutritional composition of wild O. niloticus obtained
from Lower Benue River at Makurdi against its
counterpart from the ponds of University of
Agriculture Makurdi fish farm. However, both the
wild and cultured O. niloticus from Makurdi are
good for human consumption since they are all high
in protein and amino acid contents, and their
nutritional values fall within ranges established by
other authors.
REFERENCES
Ali, A. and Kiumars, P. (2010); Chemical and proximate
composition properties of different fish species
obtained from Iran. World Journal of Fish and Marine
Science, 2:237 239.ISSN 20784589.
AOAC (Association of Official Analytical
Chemists), (2006); Official Method of Analysis of the
AOAC (W. Horwitz Editor, Eighteenth Edition,
Washington; D. C., AOAC). In AOAC International,
Suite 500, 481North Frederick Avenue, Gaithersburg,
Maryland 20877 2417, USA.
Ashraf, M., Abdul Rauf, Asma Zafar and Shahid Mehboob
(2011); Nutritional value of wild and cultivated Silver
(Hypophthalmichthys molitrix) and Grass carp
(Ctenopharyngodo idella). International
Journal of Agriculture and Biology, Vol.13, PP.210
214.
Ayeloja, A. A.; George, F. O. A.; Dauda, T. O.; Jimoh, W.
A. and Popoola M. A (2013); Nutritional comparison
of captured Clarias gariepinus and Oreochromis
niloticus. International Research Journal of Natural
Sciences.Vol.1, No.1, pp.9-13.
Ayyappan, S; Jena, JK; Gopalakrishnan, A. and Pandey,
Ak (2006); Handbook of Fisheries and Aquaculture.
Indian Council of Agricultural Research New Delhi.
ISBN:81-7164-061-3.
Bakir, H. M., Melton, S.L. and Wilson, J.L. (1993); Fatty
acid composition, lipids and sensory characteristics of
white amur (Ctenopharyngodon idella) fed
different diets. J. Food Sci. 58(1):90-95.
Benitez, L. V. (1989); Amino Acid and fatty acid profiles
in aquaculture nutrition studies, p. 23- 35.In S.S. De
Silva (ed.) Fish Nutrition Research in Asia.
Proceedings of the Third Asian Fish Nutrition
Network Meeting. Asian fish Society Special
Publication.4, 166 p. Asian Fisheries Society, Manila,
Philippines.
Eyo, A. A (2001); Fish Processing Technology in the
Tropics. Published by National Institute
for Freshwater Fisheries Research (NIFFR),
P.M.B 6006, New Bussa, Nigeria.
Food and Agricultural Organization, (2004); The
composition of fish. Accessed from
http://www.fao.org/wairdoes/tx5916e/×5 16co1.htm.,
pp: 1-80.
Osibona, A. O.; Kusemiju, K. and AkandeG. R (2009);
Fatty acid composition and amino acid profile of two
freshwater species, African catfish (Clarias gariepinus)
and Tilapia (Tilapia zillii). African Journal of
Agriculture Food Nutrition and Development,Vol. 9
No. 1 pp. 608 621.
Puwastien, P.; Raroengwichit, M.; Sungpuag, P. and
Judprasong, K. (1999); “Thai Food Composition
Tables, 1st Edition”. Institute of Nutrition, Mahidol
University (INMU), Thailand Asean foods Regional
Database Centre of INFOODS.
Ramlah, Eddy Soekendarsi, Zohrah Hasyim and Munis
Said Hasan (2016); Comparison of Nutritional content
of Tilapia Oreochromis niloticus from Mawang’s Lake
Gowa and Hasanuddin University Lake Makassar city.
In: Jurnal Biologi Makassar (BIOMA), Vol.1, No.1.
Silva, J.J. and Chamul, R.. S (2000); Composition of
marine and fresh water finfish and shellfish species
and their products. In: Martin, R.E., E.P. Carter, E.J.
Flick and L.M. Davis (Eds.), Marine and fresh water
products handbook, Lancaster, Pennsylvania,
U.S.A: Technomic Publishing Company, pp: 31-46
ICPS 2018 - 2nd International Conference Postgraduate School
570
