
Classification of Underdeveloped Regions in Indonesia Using
Decision Tree Method
Bambang Widjanarko Otok
1
, Rusdi Hidayat
2
, Zumarsiyah Mahsyari
1
, Siti Halimah Sa’diyah
1
, and
Dimas Achmad Fadhila
1
1
Department of Statistics, FMKSD, Institut Teknologi Sepuluh Nopember, Surabaya
2
Business Administration Study Program, FISIP, UPN “Veteran” East Java, Surabaya
Keywords: Classification, Decision Tree, Underdeveloped Regions, Village Potential.
Abstract: Underdeveloped regions categorized as the districts where their communities and areas are relatively less
developed than other regions on a national scale. There are six criterias used to identify the underdeveloped
problems, i.e. the economy, human resources, financial capability, infrastructure, accessibility, and regional
characteristics. One of the methods to find the underdeveloped region clssified district was using the Village
Potential Data (PODES) issued by BPS. PODES data is regional data emphasized on the description of
regional situation. The coverage of PODES in 2014 and the activities were carried out on all administrative
areas of village level throughout Indonesia. In this research, classification analysis was using decision tree
conducted to the districts/cities in Java. The used data was secondary data obtained from BPS in the form of
PODES data. This method provided 100% accuracy in classifying the underdeveloped regions in Java. After
obtaining the classification result, we could find out the most significant factor that affect the region to be
classified is an underdeveloped region. By knowing that significant indicator, this research could give the
recommendation to the government to focus on handling it and developing regions in Indonesia rightly on
target.
1 INTRODUCTION
An area categorized underdeveloped region is if the
community and its territory are relatively less
developed than other regions on a national scale.
The backwardness of the area can be measured
based on six main criterias. i.e. economy, human
resources, infrastructure, regional financial capacity,
accessibility, and regional characteristics
(Directorate General of Underdeveloped Area
Development, 2016). Therefore, it is necessary to
have plan and systematic regional development
effort thereby the underdeveloped area is ultimately
equivalent to other regions in Indonesia that have
developed first. Based on the distribution map of
underdeveloped regions of KEMENDESA, the
number of underdeveloped regions in Indonesia
reaches 122 districts. Province with the largest
number of underdeveloped regions is Papua where
26 out of 29 regions or 89,66% of the region are
underdeveloped regions. This determination is
derived from the calculation in the period of RPJMN
2010-2014 handled as many as 183 underdeveloped
regions while through acceleration efforts can be
carried out as much as 70 underdeveloped regions.
However, in 2013, there were 9 New Autonomous
Region (DOB) includes in the list of underdeveloped
regions, so there are still 122 underdeveloped
regions left. At the end of the 2015-2019 RPJMN
period, it was targeted that 80 underdeveloped
regions will turn into developed regions.
One method to identify the village categorized as
underdeveloped region is with the Village Potential
Data (Podes) issued by the Central Bureau of
Statistics (BPS). PODES data is regional data
(spatial) emphasized on the description of regional
situation. The coverage of the PODES 2014 data
collection area and activities were carried out on all
administrative areas of the village level (desa,
kelurahan, nagari / jorong) throughout Indonesia,
including the Transmigration Settlement Unit (UPT)
and the Transmigration Settlement Unit (SPT),
which is still fostered by the relevant ministries
(General of Disadvantaged Areas Development,
2016).
Otok, B., Hidayat, R., Mahsyari, Z., Saâ
˘
A
´
Zdiyah, S. and Fadhila, D.
Classification of Underdeveloped Regions in Indonesia Using Decision Tree Method.
DOI: 10.5220/0007553308790883
In Proceedings of the 2nd International Conference Postgraduate School (ICPS 2018), pages 879-883
ISBN: 978-989-758-348-3
Copyright
c
2018 by SCITEPRESS – Science and Technology Publications, Lda. All rights reserved
879
In 2015, Village Ministries, Development of
Underdeveloped Areas and Transmigration through
Presidential Regulation No. 12 of 2015 focus on
village development. It is interestingly noted
because the targeted development is absolutely
necessary.
In this study, the classification analysis using
decision tree for the regions in Indonesia used
secondary data obtained from the Central Bureau of
Statistics in the number and percentage of the poor,
expenditure per capita, life expectancy, average
length of school, literacy rate, village facilities and
infrastructure, accessibility, and percentage of
disaster and conflict in the village. The area used in
this study was limited only in Java Island. It is
because about 60% of Indonesia's population living
in Java and 58% of Indonesia's Gross Domestic
Product is in Java. Therefore, it is assumed that Java
Island has been representative to represent the
classification of underdeveloped areas in Indonesia.
It is known that Java has six regions included in the
underdeveloped regions category. In this research,
the writer conducted further analysis to the
underdeveloped regions to find out the influencing
factors of why those areas are classified as
underdeveloped area. This research is expected to
help the government in determining whether an area
is an underdeveloped region or not with a simpler
method from the model result compared to the
method that has been used by the government. This
research is also expected to assist the government in
making plans to follow up on the problem of
regional underdevelopment so that national
development can be on target.
2 LITERATURE REVIEW
One common method of data mining is the decision
tree, which transforms a very large fact into a
decision tree that represents the rule. It is one of the
most popular classification methods because of its
easily interpreted by humans. The concept of a
decision tree is transforming data into a decision tree
model and rules.
The data in the decision tree is usually expressed
in tabular form with attributes and records. The
attribute states a parameter created as a criterion in
the formation of a tree. For example, in determining
to play tennis, the considered criteria are weather,
wind, and temperature. One of the attributes is an
attribute that states the data per-item of data solution
called the target attribute. The attribute has values
named with the instance, for example the weather
attribute has a bright, cloudy, and rainy instances.
Decision tree is the set of IF rules THEN. Each
path in a tree is associated with a rule, in which the
premise consists of a set of encountered node nodes,
and the conclusion of the rule consists of the class
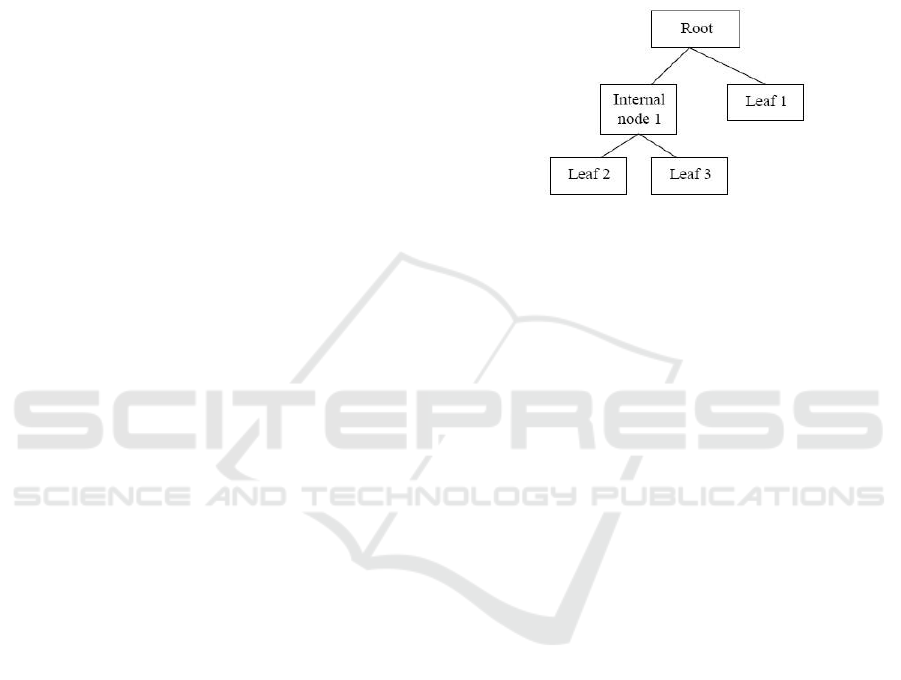
connected with the leaf of the path. Figure 1 below
shows the decision tree structure.
Figure 1: Decision tree structure.
The first part of this decision tree is the root
point, whereas each branch of the decision tree is a
division based on test results and the end point (leaf)
is the resulting class division. Decision tree has three
types of nodes, as follows:
1. The root node, ie has no incoming branch and
has more than one branch, sometimes has no
branch at all. These nodes are usually the most
attributes that have the greatest influence on a
particular class.
2. The internal node, ie has only one incoming
branch and has more than one outbound branch.
3. Leaf node, which is the end node that has only
one incoming branch and no branch at all at the
same time marks that the node is a class label.
The initial stage is the root node test. If the root
node test produces something, then the testing
process is also performed on each branch based on
the results of the test. This applies also in the
internal node where a new test condition will be
applied to the leaf node. In general, the process of a
decision tree system is to adopt a top-down search
strategy for its search space solution. In the process
of classifying unknown samples, the attribute values
will be tested on the decision tree by tracking the
path from the root point to the end point, then the
class will be predicted to occupy the new sample.
Decision tree is widely used in data mining
process because it has several advantages as follows:
1. It does not cost much when building algorithms.
2. Easy to interpret.
3. Accommodate the missing data.
4. Easily integrate with database system.
ICPS 2018 - 2nd International Conference Postgraduate School
880

5. Can find unexpected relationships and data.
6. Can use exact / absolute data or continuous data.
CART is one of the algorithms in data
exploration techniques, known as decision tree
technique. This method was developed by Leo
Breiman, Jerome H. Friedman, Richard A. Olshen,
and Charles J. Stone around 1980s. CART is a
nonparametric statistical method that can describe
the relationship between response variables with one
or more predictor variables. CART is developed for
topic classification analysis, both for categorical and
continuous response variables. CART produces a
classification tree if the response variable is
categorical and produces regression trees if the
response variable is continuous. Response variable
in this research was categorical scale, so the used
method was tree classification.
CART can select the variables and interactions
of the most important variables in the determination
of results. The main purpose of CART is to obtain
an accurate data set as the characteristic of a
classifier. Some advantages of CART included are
able to produce a more easily interpreted graphic
display. According to Breiman et al, (1993), the
advantage of CART is the unnecessary assumption
of distribution by all variables. In addition, the
algorithm used directly can handle the problem of
missing data. CART is also not influenced by outlier
data, cholinery, heteroscedasticity or error
distribution structures that typically affect
parametric methods. According to Yohannes and
Hoddinott (1999), the weakness of CART is that the
end result is not based on probabilistic models.
CART analysis consists of four basic steps. The
first step consists of tree building in which a tree
built by using recursive splitting of nodes. Each
resulting node is assigned a predicted class, based on
the distribution of classes in the learning dataset
which would occur in that node and the decision cost
matrix. The assignment of a predicted class to each
node occurs whether or not that node is subsequently
split into child nodes. The second step consists of
stopping the tree building process. At this point, a
“maximal” tree has been produced, which probably
greatly overfits the information contained within the
learning dataset. The third step consists of tree
“pruning,” resulting the creation of a sequence of
simpler and simpler trees, through the cutting off of
increasingly important nodes. The fourth step
consists of optimal tree selection in which the tree
fits the information in the learning dataset, but does
not overfit the information, is selected from among
the sequence of pruned trees.
3 METHODOLOGY
The data used was secondary data in the form
underdevelop factors of a region obtained from BPS
in 2014. Those factors were then used as research
variables as many as 10 variables, ie life expectancy
(years), mean years of schooling (years), the
percentage of population living in poverty (%), per
capita expenditure (Rp), literacy rate (%), mean
distance to the district capital (km), access to health
services (km), percentage the number of villages
where the earthquake occurred, percentage the
number of villages which has conflict village, and
the number of villages with asphalt roads.
Stages performed in this study were as follows.
1. Description of regional backwardness in Java.
2. Obtain variables that significantly affect the
status of regional backwardness in Java.
3. Decision tree analysis using CART.
4. Make the classification of regional backwardness
regional with decision tree models obtained.
4 RESULT AND DISCUSSION
4.1 Underdeveloped Regions in Java
Island
The data used in this study was the potential data of
villages in 2014 as determinants of the
underdevelopment of a village. Based on these data,
KEMENDESA has classified the status of regional
backwardness in Indonesia. In Java, the status of the
underdeveloped region is illustrated by Figure 2
below.
Figure 2: Status of underdeveloped regions.
Figure 2 shows the status of regional
backwardness in Java with code 1 indicating the
number of underdeveloped regions and code 2
indicating the number of developed regions. Thus,
Classification of Underdeveloped Regions in Indonesia Using Decision Tree Method
881

based on Figure 2, Java is dominated by developed
regions. From 119 districts / cities in Java, only 6 of
them are classified as underdevelop regions
according to KEMENDESA. These regions are
described in Table 1 below.
Table 1: Underdeveloped regions in Java island.
No.
Regency/City
Province
1
Lebak
Banten
2
Pandeglang
Banten
3
Bangkalan
East Java
4
Sampang
East Java
5
Bondowoso
East Java
6
Situbondo
East Java
4.2 Feature Importance
Feature Importance is used to determine the
variables that affect the formation of decision tree
models. In this case, the use of feature importance
aims to determine which factors influence the
backwardness of a region in Java.
Table 2: Significant factors.
No.
Variable
Unit
1
Life expectancy
Year
2
Health Service Access
Km
3
Per capita expenditure
Rp
4
Mean years of schooling
Year
The result of analysis showed that there were
four factors affecting the regional backwardness, ie
life expectancy, health service access, per capita
expenditure, and mean years of schooling.
4.3 Decision Tree Analysis Using
CART
The formed decision tree has 8 branches with 3
internal nodes and 5 leaves of them being the leaves
(end). The index used in this study was entropy. The
formed decision tree yields four factors that have
significant affect on the status of regional
backwardness in Java, including life expectancy
(years), average distance of access to health services
(in km), per capita expenditure (Rp), and mean years
of schooling (years). This is also evidenced by the
results of the feature importance that mentions four
factors that significantly affect the status of
backwardness of a region in Java.
The accuracy of the classification resulting from
this decision tree is 100%. In other words, this
model can classify as well as the KEMENDESA
does with using only four variables.
The decision tree formed yields four factors that
have significant affect on the status of backwardness
in Java Island, including life expectancy (years),
mean distance of access to health services (km), per
capita expenditure (Rp) and mean years of schooling
(years). This is also evidenced by the results of the
feature importance that those factors are
significantly influenced the status of regional
backwardness in Java.
The first factor that seals the tree was the life
expectancy. From 96 samples, there were 13
districts/cities in Java that have a life expectancy
score of less or equal to 66.55. The 83 other
districts/cities were classified as advanced regions.
Next, another factor was the access to health
services. From 13 districts/cities in Java, 7 of them
had an average distance to health services access
less or equal to 7,123 and 6 other districts/cities
were classified as advanced regions. The next factor
was per capita expenditure. From 7 regions, there
were 6 regions that have per capita expenditure less
or equal to 7,366,000. Furthermore, the factor that
inherent in this decision tree was mean years of
schooling. The classification results showed that 6
districts that have mean years of schooling less or
equal to 6.57 years were classified as the
underdevelop regions.
4.4 Classification Results
The model decision tree obtained earlier, was used
to determine the status of districts / cities in Java
Island which is visualized with maps.
Table 3: Underdeveloped regions in Java island.
No.
Regency/City
Province
1
Lebak
Banten
2
Pandeglang
Banten
3
Bangkalan
East Java
4
Sampang
East Java
5
Bondowoso
East Java
6
Situbondo
East Java
Table 3 displays the result of classification with
the model showing that there are six regencies /
cities in Java Island classified as underdeveloped
region based on the potential data of villages in
2014. Because the accuracy of the classification
ICPS 2018 - 2nd International Conference Postgraduate School
882
resulting from this decision tree is 100%, so Table 3
is same as Table 1. The districts classified as
underdeveloped regions in Java are Lebak,
Pandeglang, Bangkalan, Sampang, Situbondo and
Bondowoso. It means that the model built from
CART can classify as well as in KEMENDESA.
5 CONCLUSION
Decision tree is an effective method to classify the
status of underdeveloped regions because it can give
100% of accuracy. Factors that significantly affect
the determination of the classification of regional
backwardness are life expectancy, average distance
of access to health services, per capita expenditure,
and mean years of schooling. The result of
classification indicated six underdeveloped
districts/cities, ie Lebak, Pandeglang, Bangkalan,
Sampang, Bondowoso, and Situbondo.
From this research, it was found out that the most
significant factor affecting the determination of the
classification of regional backwardness was life
expectancy. Based on the explanation, the
goverment should focus to increase the life
expectancy on those regions which classifed as the
underdeveloped region.
REFERENCES
Direktorat Jenderal Pembangunan Daerah Tertinggal.
2016. Gambaran Umum Daerah Tertinggal. Retrieved
from Direktorat Jenderal Pembangunan Daerah
Tertinggal: http://ditjenpdt.Kemendesa.go. id/about
/daerahumum
Direktorat Jenderal Pembangunan Daerah Tertinggal.
2016. Petunjuk Pelaksanaan (Juklak) Identifikasi
Masalah-masalah Ketertinggalan Kabupaten Daerah
Tertinggal. 11-12.
Faiza, N.N., 2009. Prediksi Tingkat Keberhasilan
Mahasiswa Tingkat I IPB dengan Metode K-Nearest
Neighbor. Bogor, IPB.
Johnson, R.A., Wichern, D.W., 2002. Applied
Multivariate Statistical Analysis, Fourth Edition.
New York, John Wiley & Sons.
Kumar, A.S., 2017. Web Usage Mining Techniques and
Applications Across Industries. Hershey PA, IGI
Global.
Lewis, R.J., 2000. An Introduction to Classification and
Regression Tree (CART) Analysis. Department of
Emergency Medicine, Harbour-UCLA.
Mattjik AA., S. I. 2011. Sidik Peubah Ganda dengan
Menggunakan SAS. Bogor: IPB Press.
Rao, S., Chatterjee, M., Jayanti, P., Murthy, C.S., and
Saha, S.K., 2008. Distributed Computing and
Networking. Berlin, Springer.
Tan, P.N., 2006. Introduction to Data Mining. Boston,
Pearson education, Inc.
Ulya, F., 2009. Klasifikasi Debitur Kartu Kredit
Menggunakan Algoritme K-Nearest Neighbor untuk
Kasus Imbalanced Data. Bogor IPB.
Yohannes, Y., Hoddinot, J., 1999. Classification and
Regression Trees: An Introduction. International Food
Policy Research Institute (IFRI). Washington D.C.,
USA.
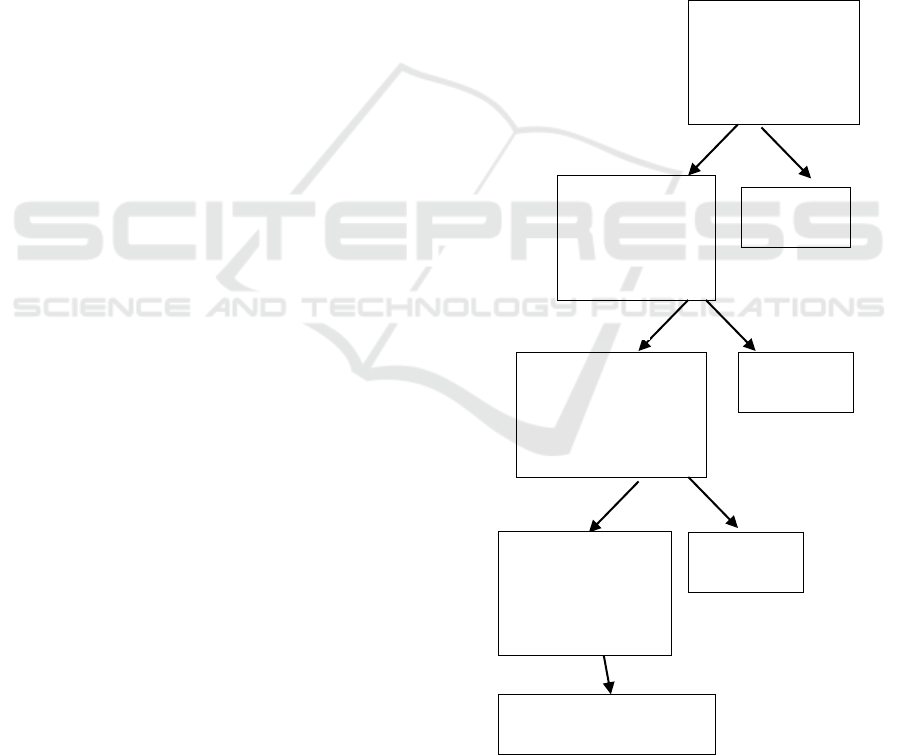
APPENDIX
Decision Tree Model
Underdeveloped region
Life Expectancy
<= 66.55 years
Entropy = 0,295
Samples = 96
Value = [5, 91]
False
Developed
region
Health Service
Access
<= 7,123 km
Entropy = 0,961
Samples = 13
Value = [5, 8]
True
Developed
region
Per Capita
Expenditure
<= Rp 7.366.000
Entropy = 0,863
Samples = 7
Value = [5, 2]
False
Developed
region
Mean Years of
Schooling
<= 6,57 years
Entropy = 0,65
Samples = 6
Value = [5, 1]
False
True
True
Classification of Underdeveloped Regions in Indonesia Using Decision Tree Method
883
