
Watershed-based Flash Flood Risk Assessment in Yulin
Municipality, Guangxi, China
C Z Li
1
, M Zhang
1,*
, X L Zhang
1
, H Wang
1
, K B Luo
2
, C J Liu
1
and D Y Sun
1
1
Department of Water Hazards Reduction, China Institute of Water Resources and
Hydropower Research, Beijing 100038, China
2
Office of Yulin Municipal Flood Control and Drought Relief Headquarters, Yudong
Rd. Yulin District, Guangxi,537000, China
Corresponding author and e-mail: M Zhang, zhangmiao@iwhr.com
Abstract. An analysis was performed on flash flood risk for the purpose of finding
appropriate strategies and measures for flash flood management from area to area in Yulin
region. This region suffered heavily from flash flood disasters in the past years and a project
on Flash Flood Investigation and Assessment (FFIA) was conducted during the period of
2013-2016 focusing on acquiring basic information on flash flood prone area, historical flash
flood events, riverside communities or towns. Based on the data from FFIA and risk triangle
conception of on hazard, exposure and vulnerability, flash flood risk assessment was
performed for each watershed entity in mountainous area, by steps of suitable risk index
system development, appropriate risk assessment model construct, risk component
computation and flash flood risk analysis. The main understandings include: 1) consideration
on computed entity and weight set for risk factors made the results more creditable; 2)
exposure level distributes evenly and the areas with high and medium flash flood
vulnerability level concentrate in the lower of the Nanliu River and the Beiliu River; 3)
referring to the main stream line of the Nanliu River and the Beiliu River, hazard level in the
lower part is much higher than that in the upper part, and the areas with high and medium
flash flood risk level concentrate on both mountainous and hilly areas along the line. Finally,
suggestions on flash flood countermeasures were made at county level, including macro-scale
rainfall monitoring, local rainfall and water stage monitoring and warning, community-based
awareness and drill, appropriate local structural measures. This risk analysis was made
special by considering on overlaying effect of risk tri-components and watershed-based entity.
1. Introduction
Yulin is a prefectural level region located in southeastern Guangxi Zhuang Autonomous Region of
China. It covers an area of 12,838 km
2
, where the Yulin Basin, hill areas and mountainous areas
cover 17.6%, 49.4% and 33% of the total area, respectively (refer to Figure 1). Yulin Basin is
bounded by Darong Mountain in north, Liuwan Mountain in west, Stone Mountains in east, and some
low hills in south. There are 2 major rivers flow through Yulin area: the Nanliu River, originating at
the Darong Mountain, flows through the Yulin Basin from northeast to southwest; the Beiliu River,
originating at the Yunkai Mountain, flows northeast through the area. The area is subjected to
subtropical monsoon climate with average annual precipitation about 1,650 mm; the monsoon season
62
Li, C., Zhang, M., Zhang, X., Wang, H., Luo, K., Liu, C. and Sun, D.
Watershed-based Flash Flood Risk Assessment in Yulin Municipality, Guangxi, China.
In Proceedings of the International Workshop on Environmental Management, Science and Engineering (IWEMSE 2018), pages 62-77
ISBN: 978-989-758-344-5
Copyright © 2018 by SCITEPRESS – Science and Technology Publications, Lda. All rights reserved

is centered from June to August, with frequent short-duration frontal rains, terrain rains and
convectional rains (refer to Figure 2). Owing to aerial climate and geography conditions along with
recent human activities, Yulin is a flash flood prone area. By 2016, the population in the hill and
mountainous areas where potentially threatened by flash flood, reached 5.10 million, 74% of the total
population of Yulin region.
Yulin has jurisdiction over seven counties: the Yuzhou District, the Fumian District, the Rongxian
County, the Luchuan County, the Bobai County, the Xingye County and the Beiliu County. All of
them suffer heavily from flash floods with Beiliu County ranked heaviest. In recent years, rapid
developments have increasingly encroached mountain-hill areas, putting more lives and properties in
potential threats of flash floods. Hence, flash flood management has become one of the most
challenging tasks in flood management in Yulin.
According to international experiences, one of the effective strategies on flash flood mitigation is
to practice risk management that can present guidance on countermeasures. The literature review
reveals following seven understandings on flash flood risk analysis: (1) The concept of risk. Some
literatures proposed that flood disaster system consists of surrounding environment, disastrous factors,
exposures and disaster prevention capacity [1]. The current concept of flood risk involves the
possible consequence among interactions of hazard, exposure and vulnerability, while the very early
concept of risk was usually the sequence of losses and possibility [2, 3]. Erich J. Plate [4, 5] regarded
that the regional flood risk should be determined by quantizing the hazard, exposure and
vulnerability, while Merz and Thieken [6] regarded that the aim of flood hazard appraisal is to
estimate the possible inundated area and intensity of various scenarios. (2) Detailed information
needed in risk analysis. Apel H, et al [7] discussed how to choose methods or models and how
detailed information one would need in risk analysis. (3) Development of risk index system. Usually,
a 2- or 3-layer index framework was first developed with a number of factors. Some analyses, such
as principal component analysis and sensitivity analysis, were performed on factor choice [8, 9]. (4)
The basic computation entity for risk. Various grid resolutions were found in many studies; such as
1km×1km, 5km×5km, and so on, were widely used. However, the relation of hazard factors with grid
resolution was little taken into account. (5) The process of the three components of risk. Many
studies focused on each component; such as hazards estimate [10-12], exposure and vulnerability
appraisal. Especially in recent years, attentions were increasingly paid to vulnerability or resilience
and uncertainty at community level [13-15]; exposure and vulnerability were typically combined as
one entity in most studies [16]. (6) The emphasis of risk analyses. In many studies, the emphasis was,
to some extent, put on the technical approaches, such as hydrological and hydraulic techniques and
tools [17-19], RS (Remote Sensing) and GIS (Geographic Information System) [20-22]. (7) The
method for risk analysis. Typically, the risk analysis methods consist of three categories: the product
of loss and possibility [2, 3], each component of risk [5], and the historical approaches [23-26].
This study performed flash flood risk assessment in assisting decision making on flash flood
management strategies for various areas in Yulin region. This study emphasized on three aspects: (1)
the risk conception of references [4, 5] is employed for it presents expression not only to the
components of flash flood risk, but also to macro-thought of flood risk computation and guidance on
flash flood management; (2) flash flood risk is regarded as the overlying effect of hazard, exposure
and vulnerability; and (3) the basic computation entity for flash flood risk analysis is watershed, not
grid, and the relationship among various hazard factors was taken into consideration.
Watershed-based Flash Flood Risk Assessment in Yulin Municipality, Guangxi, China
63
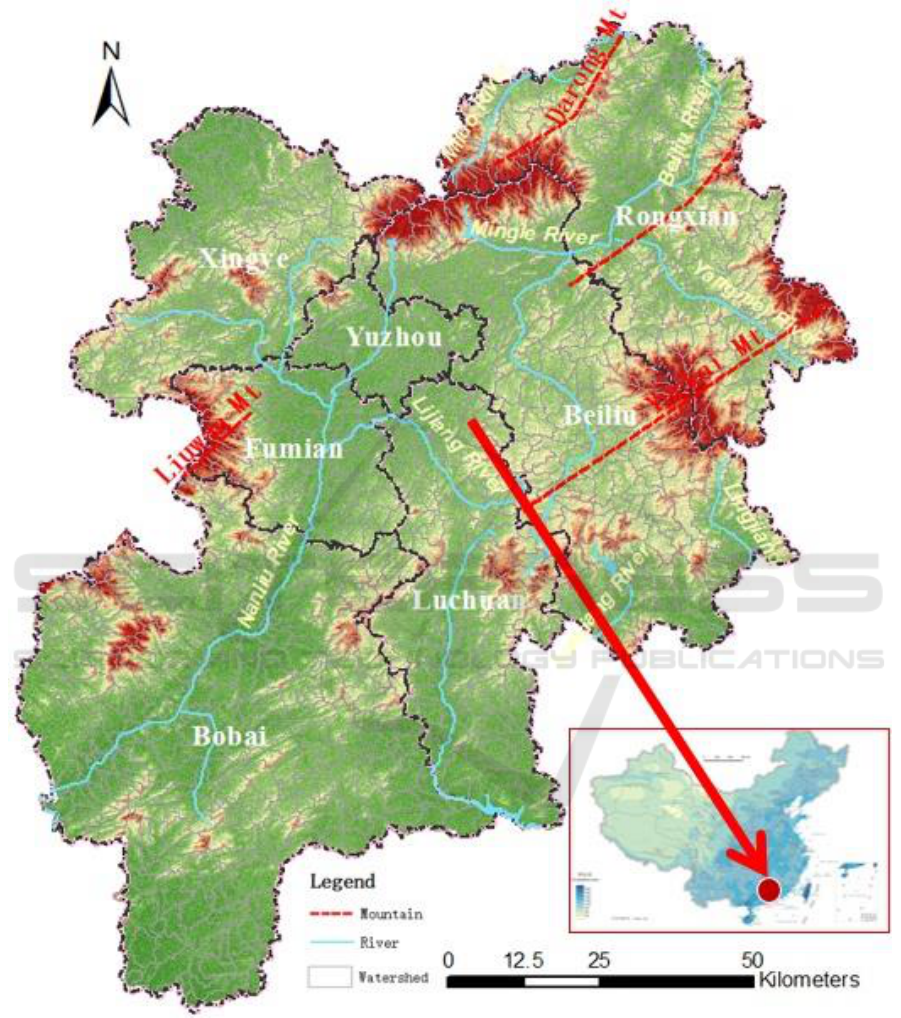
Figure 1. Landform and counties in Yulin.
IWEMSE 2018 - International Workshop on Environmental Management, Science and Engineering
64
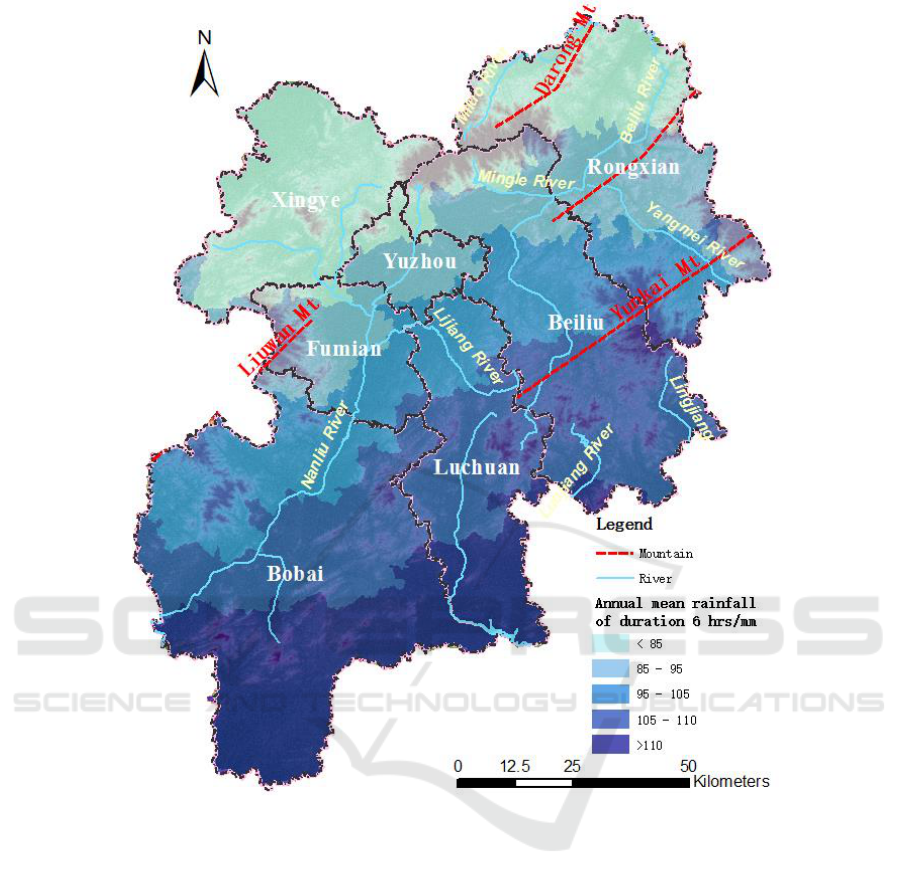
Figure 2. Rainstorm of 6 hr-duration in Yulin.
2. Data acquiring
In the past years, great efforts were made to mitigate flash flood hazards in Yulin. However, some
fundamental information for effective flash flood management was still unavailable or unclear to
flood management staff or decision makers. These include flash flood prone areas, vulnerable
exposures, and capacity on monitoring and warning for flash flood. Hence, a municipality-wide
project (hereinafter referred to as “the Project”) was conducted from 2013 through 2016 to
implement structural and non-structural measure interventions against flash floods in Yulin. Through
the Project, fundamental data was collected regarding flash flood management. To achieve
jurisdictional and technical high efficiency, the data was analyzed and summarized using both
watershed and county as basic unit. The project included 1,106 watersheds ranging from of 0.5 km
2
to 318 km
2
with an average of 14 km
2
. The following items were clarified for each watershed: (1) the
basic geometrical and geographical attributes of the watershed, such as catchment area, water course
system, length and slope of each water course, and land use/land cover; (2) flash flood prone area; (3)
population distribution, house distribution, household asset, monitoring and warning device, and
current flood control capacity of flood prone community; (4) water-related structures which
Watershed-based Flash Flood Risk Assessment in Yulin Municipality, Guangxi, China
65

potentially causing disasters, such as bridges, culverts, and weirs; (5) survey data on longitudinal and
cross sections of river channel near riverside communities; and (6) historical flash flood events.
3. Approach
In this study, risk was regarded as the overlaying effect of hazard (H), exposure (E), and vulnerability
(V). Hazard is mainly from physical factors, such as short-duration storms and steep landform within
a watershed; exposure consists of socioeconomic factors, such as population and houses in flood
prone areas; vulnerability relates primarily on susceptibility to flash flood, for example, the material
and structure of houses, community capacity on flash flood monitoring and warning, and flash flood
awareness of local people. As watershed is the basic entity for this study, the raw values of each
factor were acquired and processed based on watershed scale.
3.1. Index system construction
The index system for risk assessment was developed from three aspects: hazard, exposure, and
vulnerability. Each index should satisfy following conditions as much as possible: (1) utmost use of
the data from the Project; (2) liable to be quantified; (3) the independence between factors, and (4)
directly serving flash flood management.
Figure 3 presents the index system that consists of three layers: a general risk layer, a component
layer and a factor layer. Layer 1 is the general risk (R) that is the overlaying effect of all components
of risk; layer 2 includes three components of risk: hazard (R
h
), exposure (R
e
) and vulnerability (R
v
),
all of which resulted from factors of risk; and layer 3 is the corresponding factors to three
components of risk.
In this study, much attention was attached to the characteristics of flash floods; such as short
duration and high intensity rainstorm, steep slope of waterway with small drainage area, population
and properties of located in flood prone area. When choosing factors at the third layer, the main
considerations were as follows.
Hazard (R
h
) refers to the degree of dangerous of a flash flood event. It is determined by combined
effects of pregnant environment, the disastrous factors, and disaster prevention capacities. In this
study, the rainstorms with durations of 6 hours (H
r6
) and 3 hours (H
r3
) were selected as rainfall
feature, while flood peak modus (H
lm)
and time of concentration (H
lt
) as landform feature.
Exposure (R
e
) considers population, houses and household assets located in flood areas. In this
study, the population (E
p
), houses (E
hse
) and household assets (E
asset
) were chosen as three indexes to
represent exposure. The household assets were simply estimated as the magnification of the number
of households in mountain and hill area in the process of FFIA to estimate the possible losses due to
flash flood.
IWEMSE 2018 - International Workshop on Environmental Management, Science and Engineering
66
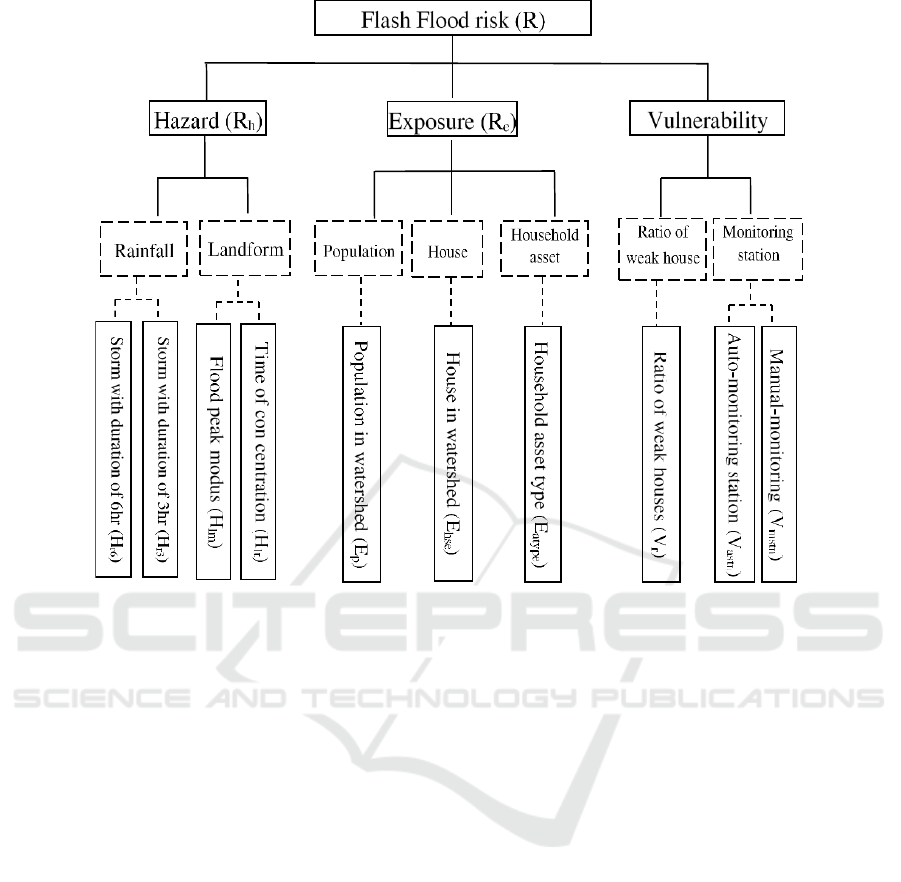
Figure 3. Flash flood risk index system.
Vulnerability (R
v
) is the inner attribute of exposure and represents the fragility of exposures in
same flash flood hazard. It is closely related to the capacity of exposure to response to flash flood. In
this study, both the ratio of weak houses (V
r
) and covering scope of single auto- or manual-
monitoring stations (V
astn
and V
mstn
) are on half of vulnerability (R
v
). In the process of FFIA, the
houses in mountain and hill areas were classified into four types, with type III and IV being weak to
flash flood.
3.2. Model descriptions
3.2.1. Risk model. The model to compute flood risk is as follows:
(1)
where, Risk is regional flood risk; H, E and V the elements of flood risk, hazard, exposure and
vulnerability, respectively. They are computed as follow:
(2)
(3)
(4)
,
,
—factors of layer 3 corresponding to components of layer 2; ,, - numbers of factors
of layer 3 corresponding to components of layer 2;
,
,
— numbers of factors of layer 3; , , ,
— intermediate variables to summarize; — weights of components of layer 2 and factors of
layer 3.
Watershed-based Flash Flood Risk Assessment in Yulin Municipality, Guangxi, China
67
3.2.2. Considerations on weights. The following three considerations were taken into account:
1) Components of layer 2: three factors - hazard, exposure and vulnerability were equally
weighted with each bearing a weight of 1/3.
2) Factors of layer 3: for hazard, short-duration rainstorms bear more weight as these storms are
likely trigger flash flood; for exposures, population bears more weight; and for vulnerability,
monitoring stations carry more weight for their importance to emergency evacuation.
3) Weight value calibration: trial-and-error method were used to calibrate weight values for each
factor by comparing with historical flash flood data.
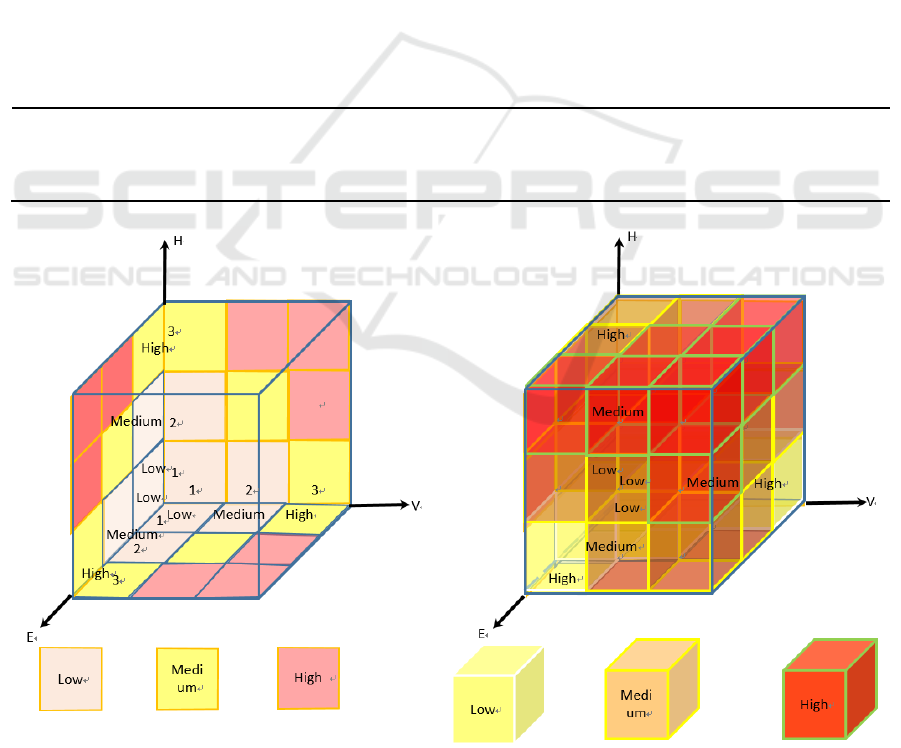
3.2.3. Considerations on thresholds. Certain threshold considerations for risk level of the Layer 1 and
all components of the Layer 2 are listed as follows.
1) Three threshold levels (high, medium, low) were signed to each component (hazard, exposure,
vulnerability) in the risk level. A H-E-V Cube was developed with 27 sub-cubes (see Figure 5) to
display the overlaying effect. The overlaying effect is also presented in Table 1.
2) To determine the thresholds of the Layer 2 components, the sample data was sort in a
descending order. The values ranked at 1/3 and 2/3 were taken as the thresholds for high, medium,
low level (refer to Figure 4).
Table 1. Overlaying effect of H-E-V and risk level.
Risk level
Number
H1E3V3, H2E3V3, H3E1V3, H3E2V3, H3E3V1, H3E3V2, H3E3V3
High
7
H1E2V2, H1E2V3, H1E3V2, H2E1V2, H2E1V3, H2E2V1, H2E2V2, H2E2V3,
H2E3V1, H2E3V2, H3E1V2, H3E2V1, H3E2V2
Medium
13
H1E1V1, H1E1V2, H1E1V3, H1E2V1, H1E3V1, H2E1V1, H3E1V1
Figure 4. Threshold for hazard, exposure and
vulnerability.
Figure 5. Overlaying effect of H-E-V Cube and
risk level threshold.
IWEMSE 2018 - International Workshop on Environmental Management, Science and Engineering
68

4. Flash flood risk computation
4.1. Data process and analysis
Data collected for each watershed was processed and analyzed. There are 1,106 watersheds involved,
and the sizes of watershed are less than 300 km
2
.
The flood peak modus (H
lm
) is defined as the ratio of peak discharge to the drainage area at the
outlet of the watershed. The time of concentration (H
lt
) for each watershed were determined as
follows [27].
Mean concentration velocity at basin level (
) is used to reflect the characteristics of slope
concentration and channel concentration:
(5)
Yield the time of concentration of a watershed as
(6)
in which, - time of concentration, hr; L-the longest distance from the river mouth to the divide of
watershed, km; J-the mean slope of L; m - experimental parameter for concentration related to the
situations in the watershed, such as land use, soil type, vegetation cover, and average surface slope;
- peak discharge, m
3
/s; - experimental exponent, 1/3 and 1/4 for triangular cross section in
mountainous and hilly area.
Both flood peak modus (H
lm
) and time of concentration (H
lt
) involve the characteristics of runoff
generation and surface volume in a watershed, from the point view of hydrology and hydraulics. This
is quite different to many other gird-based researches on flash flood risk analysis in which many
physical factors about the conditions in the watershed were taken into consideration only as divided
index factors.
Table 2 presents some original values of sample data of flash flood risk index.
Table 2. Demo data of flood risk index for watershed.
No.
H
r6
(mm)
H
r3
(mm)
H
lm
(m
3
/(s·km
2
))
H
lt
(hr)
E
p
E
hse
E
asset
(10
3
Yuan)
V
r
V
astn
(km
2
)
V
mstn
(km
2
)
1
114
89
0.20
1.33
1,143
211
1,688
0.10
14.86
7.43
2
120
92
0.12
2.17
13,368
2,883
23,064
0.29
9.55
14.33
3
102
84
0.21
1.33
2,502
771
6,168
0.57
28.00
9.33
4
94
78
0.16
1.67
1,516
279
2,232
0.56
21.74
10.87
5
90
76
0.19
1.33
8,175
2341
18,728
0.59
21.83
21.83
6
102
84
0.14
1.83
1,250
246
1,968
0.31
16.30
8.15
7
108
86
0.24
1.17
10,136
2176
17,408
0.05
6.73
6.73
8
110
87
0.18
1.33
3,197
560
4,480
0.18
10.20
10.20
9
110
87
0.14
1.83
5,532
949
7,592
0.12
19.22
19.22
10
114
89
0.20
1.33
1,143
211
1,688
0.10
14.86
7.43
4.2. Risk Analysis
The risk analysis was performed using following four steps.
Step 1, index normalization. As illustrated in Table 2, 10 indexes are quite different in magnitude
and dimensions. It is necessary to make normalization before performing flash flood risk assessment.
After normalization, the absolute value of indexes can be expressed into relative values in same
magnitude and dimensionless. The following equation presents the algorithm of normalization:
Watershed-based Flash Flood Risk Assessment in Yulin Municipality, Guangxi, China
69
(7)
where,
is the values of original data,
the normalized value of original data, and
and
the maximum and minimum of a same index, respectively.
Step 2, weights determination. The initial weight values were estimated based on engineering
experiences. For rainstorms with 6-h (H
r6
) and 3-h (H
r3
) durations, flood peak modus (H
lm
) and time
of concentration (H
lt
) were set as 0.3, 0.2, 0.3, and 0.2, respectively; the exposure factors of
population, number of houses and household assets were set as 0.4, 0.4 and 0.2, respectively; and the
vulnerability factors for ratio of weak houses (type III and IV) was set to total houses; covering areas
of single auto- or manual monitoring stations were set of 0.4, 0.3 and 0.3, respectively. The initial
values were revised by trial-and-error method, using historical flash flood events records.
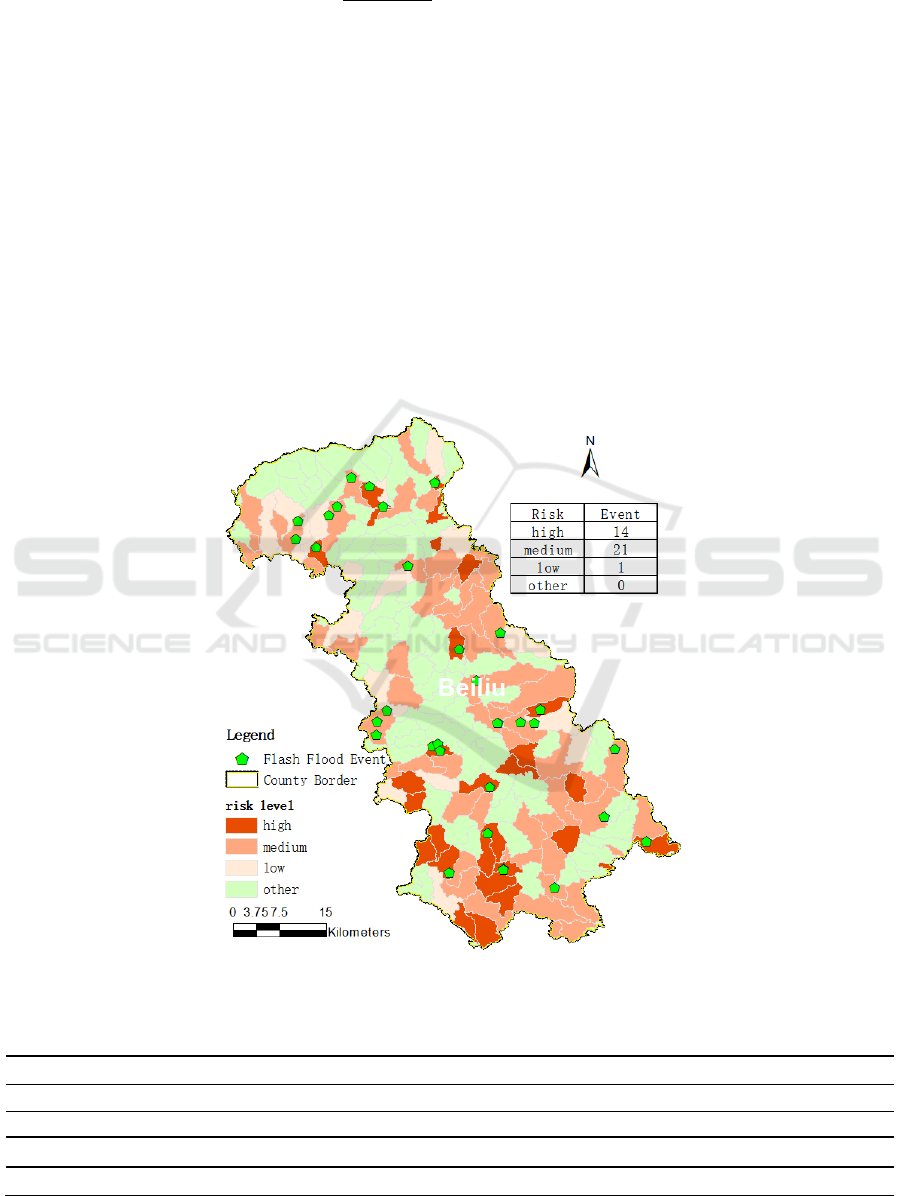
Pilot trial-and-error was performed using data of Beiliu County which had 36 historical flash
flood events. Among these events, 14 are classified as high risk, 21 and 1 are classified as medium
and low risk, respectively (refer to Figure 6).
Table 3 demonstrates the calibrated weight values of components and factors in the risk index
system.
Figure 6. Pilot trial-and-error in Beiliu County.
Table 3. Weights of component and factors in the risk index system.
Component
Hazard
Exposure
Vulnerability
Weight
1/3
1/3
1/3
Factor
H
r6
H
r3
H
lm
H
lt
E
p
E
hse
E
asset
Vr
V
astn
V
mstn
Initial Weight
0.30
0.20
0.30
0.20
0.40
0.40
0.20
0.40
0.30
0.30
Calibrated Weight
0.20
0.10
0.40
0.30
0.55
0.35
0.10
0.30
0.35
0.35
IWEMSE 2018 - International Workshop on Environmental Management, Science and Engineering
70
Step 3, risk values computation. The contributions of H, E and V were computed using the model
described in section 3.2. The values of flash flood risk were computed using formula (2), (3) and (4)
as follows: first, obtaining the weighted values of each factor by multiplying each factor with its
weight value; second, summarizing the values of components of layer 2 (hazard, exposure and
vulnerability); third, multiplying the values of components of layer 2 and obtaining the values of
flash flood risk in each computed entity.
Step 4, flash flood risk assessment and risk level classification. the contributions of H, E, and V
were classified into three levels (high, medium, low); and a risk assessment was performed using the
H-E-V Overlaying Cube to obtain the general risk levels for each watershed.
5. Results and discussions
This study completed flash flood risk analysis at watershed scale for Yulin. The primary results of
flash flood hazard level, exposure level, vulnerability level and risk level are illustrated in Figure 7
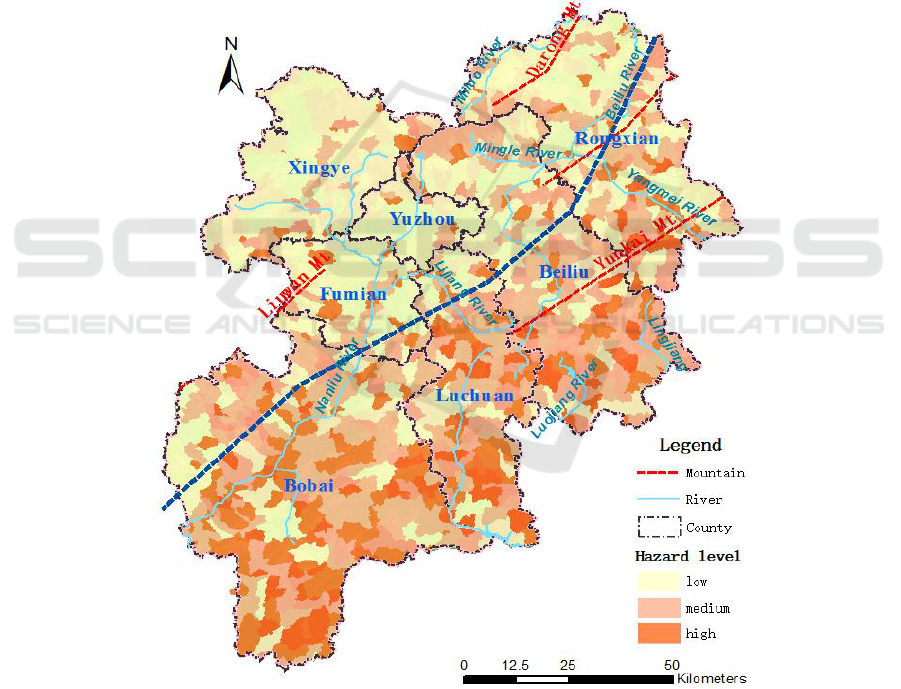
through Figure 10. The major understandings from this analysis are as follows.
Figure 7. Flash flood hazard level.
Watershed-based Flash Flood Risk Assessment in Yulin Municipality, Guangxi, China
71
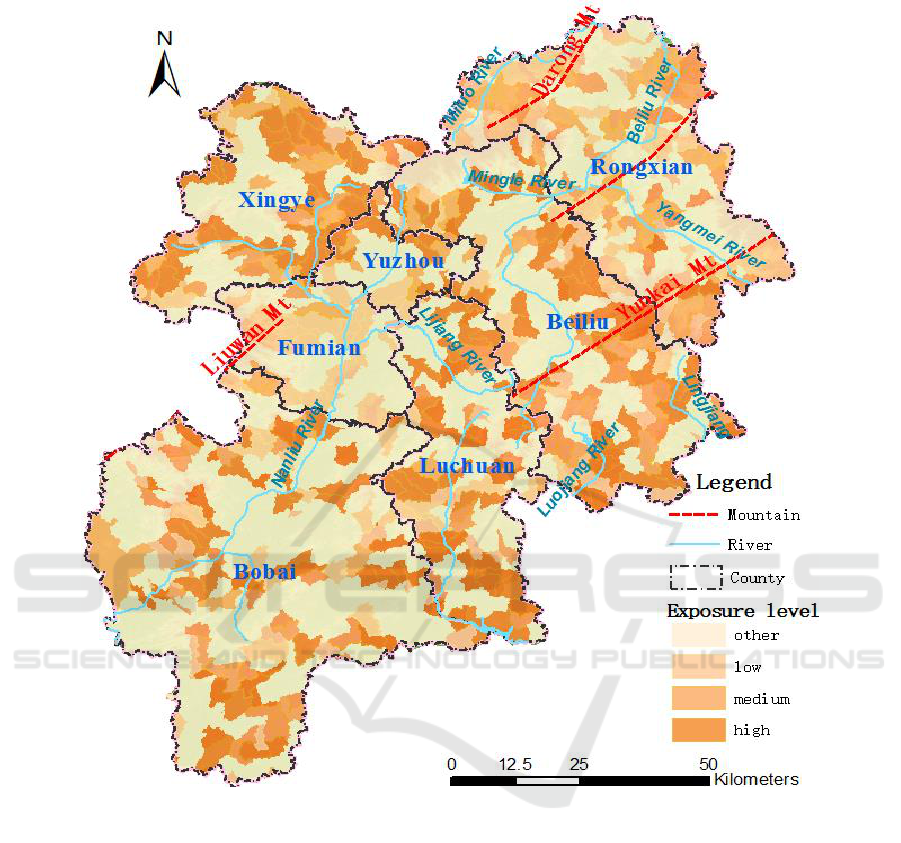
Figure 8. Flash flood exposure level.
IWEMSE 2018 - International Workshop on Environmental Management, Science and Engineering
72
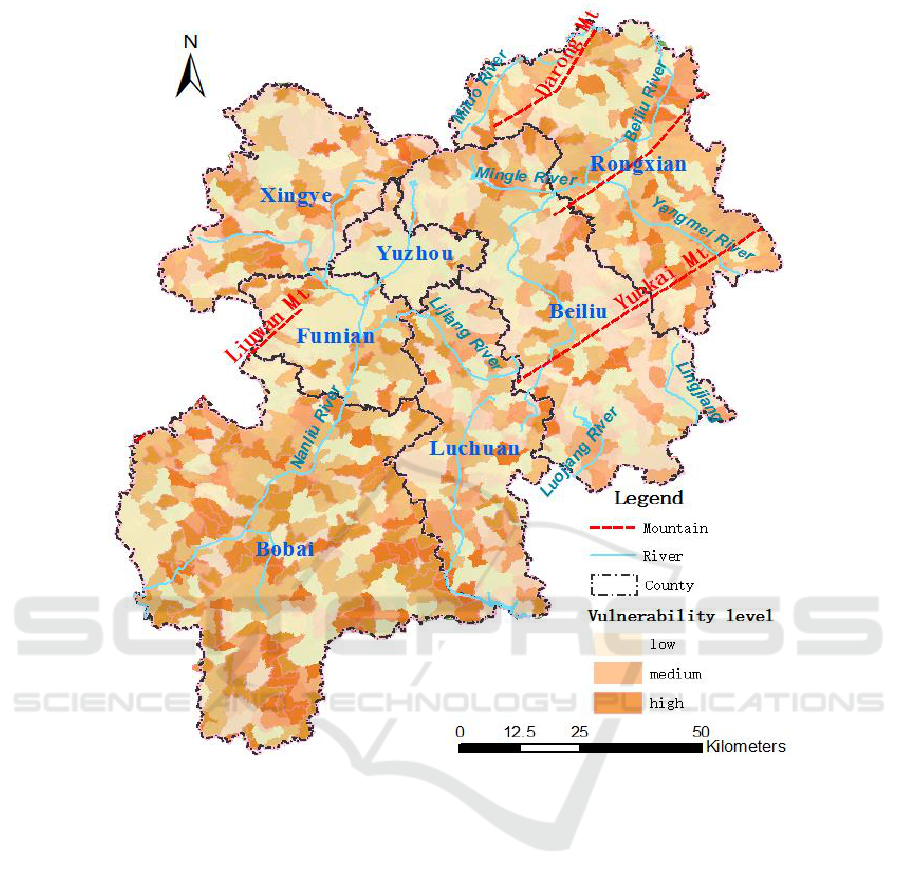
Figure 9. Flash flood vulnerability level.
Watershed-based Flash Flood Risk Assessment in Yulin Municipality, Guangxi, China
73
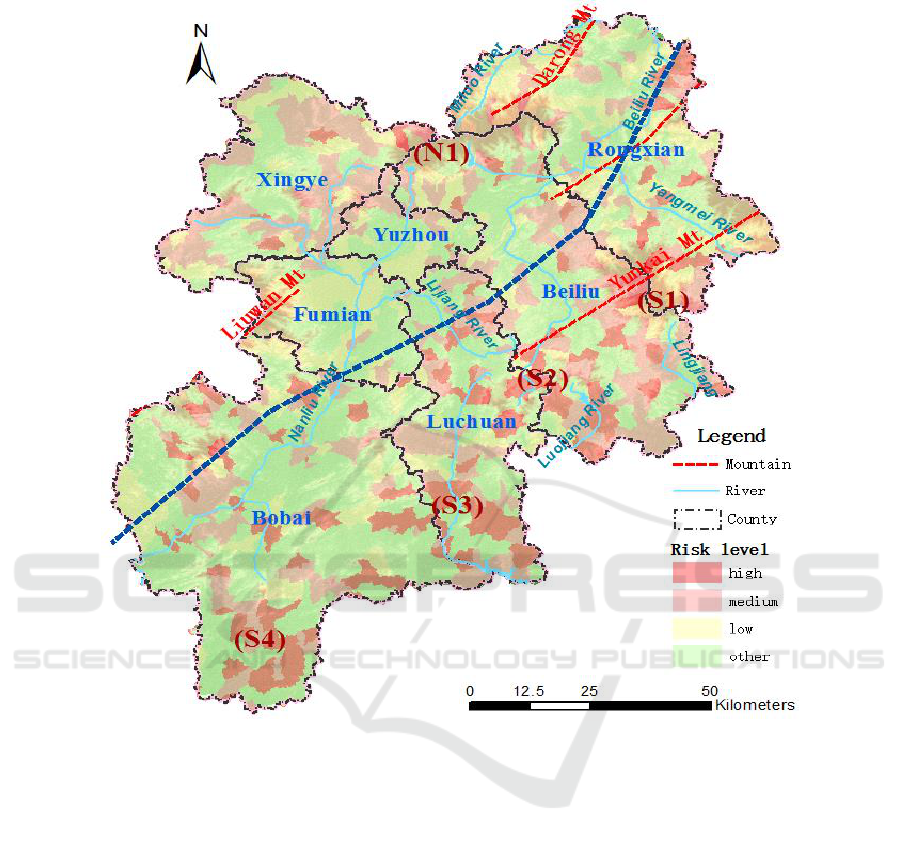
Figure 10. Flash flood risk level.
(I. Macro-scale rainfall monitoring; II. local rainfall and water stage monitoring and warning; III. appropriate
local structural measures; IV. Co mmunity-based awareness and drill; special attention should be paid to
measures underlined)
(1) The consideration on the computed entity and weight setting for risk factors were special and
made the results more creditable in this study. On one hand, the basic entity for flash flood
computation is watershed that the relationship among various hazard factors was taken into
consideration. Flood peak modus and time of concentration were selected as factors relating
watershed geographic delineation to hazard components. As illustrated, the calculation processes of
the two parameters involve characteristics of each watershed, river system, land use, etc. therefore,
hazard components were considered in terms of hydrology and hydraulics. On the other hand, weight
setting was performed by trial-and-error method using the flash flood events records in Beiliu County.
It makes the weights in this analysis more reliable. Consequently, the results are more creditable.
(2) Figure 7 presents the flash flood hazard level in Yulin. It shows that along the downstream
area of Nanliu and Beiliu Rivers, the hazard levels are much higher than along the upstream areas. It
also shows that both rainstorm and steep land slope are the key factors for hazard components. As
illustrated in Figure 2, the 6-h duration rainstorm has higher intensity in southeast area. and the
IWEMSE 2018 - International Workshop on Environmental Management, Science and Engineering
74

Yunkai Mountain and some hill areas cover the south part of Rongxian, Beiliu, Luchan and Bobai
(see Figure 1). The framework of hazard level plays important role in the distribution of flash flood
risk.
(3) The flash flood exposure level is evenly distributed in Yulin along the main reaches of the
Nanliu and Beiliu rivers (refer to Figure 8). Generally speaking, the areas of high exposure level are
concentrative in Luchuan, Beiliu, and Xingye, which are located between the Nanliu River and Beiliu
River, and decentralized in Bobai which is in the lower of the Nanliu River. It reveals that more
attention should be paid to these areas in flash flood management in future.
(4) The areas of high and medium flash flood vulnerability level concentrate in the lower of the
Nanliu River and the Beiliu River, including Bobai and Rongxian. There are other areas marked as
high/medium vulnerability scattered in Xingye, Luchuan, and Beiliu. Areas with low vulnerability
cover over half of Yuzhou and Fumian (refer to Figure 9). It indicates that more monitoring devices
and capacity construction should be installed in these areas.
(5) The areas of high and medium flash flood risk level concentrate in both mountain-hill areas
along the main reaches of Nanliu River and Beiliu River. In the lower area of these rivers, there are 4
high or medium risk level subareas locating in the county border areas of Beiliu and Rongxian (S1),
Beiliu and Luchuan (S2), Luchuan and Bobai (S3), and the southwest of Bobai (S4). In addition, the
high or medium risk level subareas are relatively continuous along the Darong Mountains and the
Liuwan Mountains (refer to Figure 10), involving northwest Rongxian, north Beiliu, north Yuzhou,
Xingye, west Fumian, and northwest Bobai (N1).
(6) As mentioned above, the purpose of this study is to support decision making on flash flood
management strategy for Yulin region. And the strategy involves the management of hazard,
exposure and vulnerability. A preliminary evaluation of flash flood hazard, exposure, vulnerability
and risk has been performed and Table 4 present the results and general suggestions in each county
of Yulin. Here one can see that the main countermeasures include macro-scale rainfall monitoring,
local rainfall and water stage monitoring and warning, community-based awareness and drill,
appropriate local structural measures. The suggestions in Table 4 made emphasis on countermeasures
(the underlined) for each county.
Table 4. Suggestions on flash flood risk management to each county in Yulin
No.
Area
Hazard
Exposure
Vulnerability
Risk
Suggestions
1
Yuzhou
Stretched low
Stretched high in
north and west
Stretched low
Stretched high or
medium in north
and west
I,II, III, and IV
2
Fumian
Stretched low in
north and medium
in south
Stretched medium
in north and low
in south
Stretched low in
center and high in
north and south
Stretched medium
in north and west
I, II, III, and IV
3
Rongxian
Stretched low in
north, stretched
high or medium in
south
Isolated medium
and low
Stretched high
Stretched high or
medium in north,
middle and south
I, II, III, and IV
4
Luchuan
Stretched high or
medium in middle
and south
Stretched high
Isolated high in
north, middle and
south
Stretched high or
medium
I, II, III, and IV
5
Bobai
Stretched high or
medium
Isolated high and
medium
Stretched high and
medium
Isolated high or
medium
I, II, III, and IV
6
Xingye
Stretched low,
isolated medium
or low
Stretched high in
ambient and low
in center
Isolated high and
medium
Stretched medium
in ambient
I, II, III, and IV
7
Beiliu
Stretched low and
isolated high and
medium in north,
stretched high in
south
Stretched high in
both sides of the
Beiliu River
Isolated high and
medium, stretched
low along the
Beiliu River
Stretched high or
medium in both
sides of the Beiliu
River
I, II, III, and IV
Watershed-based Flash Flood Risk Assessment in Yulin Municipality, Guangxi, China
75

Acknowledgements
This study is financially supported by “Mechanism and model on mixing runoff generation from
spatial-temporal changing sources” (No. KY1793-IWHR), and “National flash flood investigation
and assessment (2013-2015, 2016-2018), MWR”.
References
[1] Cheng X T 2009 Flood and drought risk management evolving with progress of sciences and
technologies Water Resources and Hydropower Engineering Vol.40 No.8 p. 122-125
[2] John H 1895 Risk as an Economic Factor The Quarterly Journal of Economics Vol.9 No.4 p.
409-449
[3] International Union of Geological Sciences (IUGS) Working Group on Landslides, Committee
on Risk Assessment 1997 Quantitative risk assessment for slopes and landslides-The state
of the art Proceedings of the Landslide Risk Workshop, IUGS Working Group on
Landslides Honolulu. p. 3-12
[4] Erich J P 2002 Flood risk and flood management Journal of hydrology Vol.267 p. 2-11
[5] WMO/GWP 2007 Guidance on Flash Flood Management-Recent Experiences from Central
and Eastern Europe p. 20-23
[6] Merz B, Kreibich H, Thieken A and Schmidtke R 2004 Estimation uncertainty of direct
monetary flood damage to buildings Natural Hazards & Earth System Sciences Vol.4 No.1
p. 153-163
[7] Apel H, Aronica G T, Kreibich H and Thieken A H 2009 Flood risk analyses - how detailed do
we need to be? Natural Hazards Vol.49 No.1 p. 79-98
[8] Zhang W W, Song X L and Zhang G X 2014 Real-time lane departure warning system based
on principal component analysis of grayscale distribution and risk evaluation model
Journal of Central South University Vol.21 No.4 p. 1633-1642
[9] Zhang S H, Bai C X, Liang J and et al 2017 Risk Assessment of Distribution Network Based
on Random set Theory and Sensitivity Analysis 2nd Asia Conference on Power and
Electrical Engineering (ACPEE2017) Shanghai, China
[10] Zhang X N, Luo J, Chen L and et al 2000 Zoning of Chinese flood hazard risk Journal of
Hydraulic Engineering Vol.3 p. 3-9 (In Chinese)
[11] Zhao S P 1996 An elementary study on whole characteristics of mountain torrents disaster
system in China and its hazard regionalization Journal of Natural Disasters Vol.3, p.
95~101 (In Chinese)
[12] Azmeri, Hadihardaja I K and Vadiya R 2016 Identification of flash flood hazard zones in
mountainous small watershed of Aceh Besar Regency, Aceh Province, Indonesia The
Egyptian Journal of Remote Sensing and Space Science Vol.19No.1, p. 143-160
[13] Jakob M, Stein D and Ulmi M 2012 Vulnerability of buildings to debris flow impact Natural
hazards Vol.60No.2, p. 241-261
[14] Joy Sanyal and Lu X X 2005 Remote sensing and GIS-based flood vulnerability assessment of
human settlements: a case study of Gangetic West Bengal, India Hydrologial Process
Vol.19, p. 3699~3716
[15] Shi P J, Wang J G, Zhou J H and et al 2004 Integrated risk management of flood disaster in
China: To balance flood disaster magnitude and vulnerability in metropolitan regions
Journal of Natural Disasters Vol.13No.4, p.1~7 (In Chinese)
[16] Alessandro G. Colombo, Javier Hervás and Ana Lisa Vetere Arellano 2002 NEDIES
PROJECT: Guidelines on Flash Flood Prevention and Mitigation p. 3-5
[17] Capello M, Cutroneo L, Ferretti G and et al. 2016 Changes in the physical characteristics of
the water column at the mouth of a torrent during an extreme rainfall event Journal of
IWEMSE 2018 - International Workshop on Environmental Management, Science and Engineering
76

Hydrology Vol.541, p.146~157
[18] Leticia B R Pablo A C, Carlos A V and et al 2008 Fully conservative coupling of HEC-RAS
with MODFLOW to simulate stream–aquifer interactions in a drainage basin Journal of
Hydrology Vol.353No.1, p. 129~142
[19] Fuchs S, Keiler M, Sokratov S and et al 2013 Spatiotemporal dynamics: the need for an
innovative approach in mountain hazard risk management Natural hazards Vol.68No.3, p.
1217~1241
[20] Solaimani K, Mohammadi H, Ahmadi M Z and et al 2005 Flood occurrence hazard forecasting
based on geographical information system International Journal of Environmental Science
and Technology Vol.2No.3, p. 253-258
[21] Joy Sanyal and Lu X X 2006 GIS-based flood hazard mapping at different administrative
Scales: A cale study in Gangetic West Bengal, India Singapore Journal of Tropical
Geography Vol.27, p. 207~220
[22] Lepuschitz E 2015 Geographic information systems in mountain risk and disaster management
Applied Geography Vol.63, p. 212~219
[23] Md. M I and Kimiteru S 2002 Development Priority Map for Flood Countermeasures by
Remote Sensing Data with Geographic Information System Journal of hydrologic
engineering Vol.7, p. 346-355
[24] Greardo B, Michel L, Mariano B and et al 2004 Use of Systematic, Palaeoflood and Historical
Data for the Improvement of Flood Risk Estimation, Review of Scientific Methods. Natural
Hazards, Vol.31, P. 623~643
[25] Copien C, Frank C and Becht M 2008 Natural hazards in the Bavarian Alps: a historical
approach to risk assessment Natural Hazards Vol.45No.2, p. 173~181
[26] D’Agostino V 2013 Assessment of past torrential events through historical sources Dating
torrential processes on fans and cones Springer Netherlands, p. 131~146
[27] Chen J Q and Zhang G S 1984 Rainstorm-runoff Computation for Small Watershed (Beijing:
Water Resources and Hydropower Press) p. 37 (In Chinese)
Watershed-based Flash Flood Risk Assessment in Yulin Municipality, Guangxi, China
77
