
Preparation of Enhanced Thermal Conductive Phase Change
Material and Its Application in Thermal Control of Solar
Cells
Y T He
*
, P F Lu, L X Xiao and Y H Yang
Department of Physics and Electronic Science, Chuxiong Normal University,
Chuxiong 675000, Yunnan Province, China
Corresponding author and e-mail: Y T He, hyt_127@163.com
Abstract. The enhanced conductive lauric acid (LA) phase change material was prepared
with expanded graphite, aluminum powder and carbon fiber as the thermal conductive filler
and its thermal properties were tested and analyzed. The results show that expanded graphite,
aluminum powder and carbon fiber thermal filler in LA phase change material does not
greatly influences LA phase change temperature. The phase change temperature of the LA
phase change material is between 45°C -45.9°C when the mass fraction of thermal conductive
filler is 2%, 5%, 10% and 20% and the LA / EG composite phase change material has a low
"leakage" threshold. The thermal conductivity reached 1.478 W/ m∙K when the EG mass
fraction reached 30%. In addition, thermal control system of solar cells was designed using
LA / EG phase change material as the thermal control material, and the experimental research
on optimal configuration of solar cells and phase change material was carried out. The results
show that phase change material has obvious control effect on solar cell temperature,
reducing the temperature by 7°C .
1. Preface
With the continuous reduction of traditional petrochemical energy reserves and the environmental
pollution caused by the use of petrochemical energy, the development and utilization of clean and
renewable energy sources have become one national strategy in various countries in the world. Solar
energy is widely distributed, pollution-free and hugely reserved, which is the best clean renewable
energy. Moreover, it is extensively studied and applied in solar thermal utilization and photovoltaic
power generation aspects. As we all know, in photovoltaic power generation, only 5-15% solar
energy is converted to electric energy, more than 80% solar energy is absorbed by solar cells and
converted to heat, resulting in solar cell temperature rise. For crystalline silicon solar cells, the
conversion efficiency will drop by 0.45% every time temperature increases by 1°C [1]. Therefore, to
strengthen the temperature control of solar cells is of great significance for improving the output of
photovoltaic power generation system [2-5]. The use of phase change thermal storage technology to
achieve solar cell temperature control has been studied. For example: Hausler et al. designed the PV /
PCM system with integrated PV module and PCM glass box[6]. Hasan et al. designed thermal
management systems using phase change material, by which, solar cell temperature maximally
decreased by 18°C in 30min and decreased by 10°C in 5h under the condition of 1000W/m² [7].
He, Y., Lu, P., Xiao, L. and Yang, Y.
Preparation of Enhanced Thermal Conductive Phase Change Mater ial and Its Application in Thermal Control of Solar Cells.
In Proceedings of the International Workshop on Environmental Management, Science and Engineering (IWEMSE 2018), pages 147-154
ISBN: 978-989-758-344-5
Copyright © 2018 by SCITEPRESS – Science and Technology Publications, Lda. All rights reserved
147
Maiti et al. controlled the operating temperature of the solar cell using a paraffin phase change
material with a melting range of 56-58°C . In the room, the solar cell temperature could be maintained
within 65-68°C in 3h under 2300W/m²irradiance; in the open air, the solar cell temperature could be
reduced from 78°C to 62°C , and solar cell output power increased by 55% under natural conditions
[8]. These results show that the use of phase change thermal storage technology is effective for solar
cell temperature control. However, the application of phase change materials in solar cell thermal
control systems is still in its infancy [9-10]. Such questions as optimal configuration of phase change
materials and solar cells, heat balance model of PV / PCM system and the influence of enhanced
thermal conductive phase change material on thermoelectric properties of solar cells have yet to be
further studied. In this paper, by studying thermal properties of lauric acid composite phase change
material filled with aluminum, carbon fiber and expanded graphite, experimental study was carried
out on the influence of thermal conductive lauric acid composite phase change material mass and
solar cell area ratio on solar cell temperature control characteristics.
2. Preparation of composite phase change energy storage material
2.1. Material
Lauric acid (LA, chemical purity, melting point 44°C ), Sinopharm Chemical Reagent Company;
expanded graphite (EG, 99% carbon content, 80 mesh, expansion factor at 300mL / g), provided by
Qingdao Jinrilai Graphite Co.,Ltd (Al, content ≥ 99%), Tianjin Zhiyuan Chemical Reagent Co., Ltd.;
carbon fiber (CF, also called milled carbon fiber, 325 mesh / kg), domestic; CP153 electronic balance,
OHAUS Instrument (Changzhou) Co.,Ltd ; DF-101Scollector the rmostaticheating magnetic stirrer,
GongyiKehua Equipment Co., Ltd.; ZK82J-type electric vacuum oven, Shanghai Experimental
Instrument Factory Co., Ltd.; BEDS200 differential scanning calorimetry; DRL-III-type thermal flow
conductometer, Xiangtan Xiang Instrument Co., Ltd..
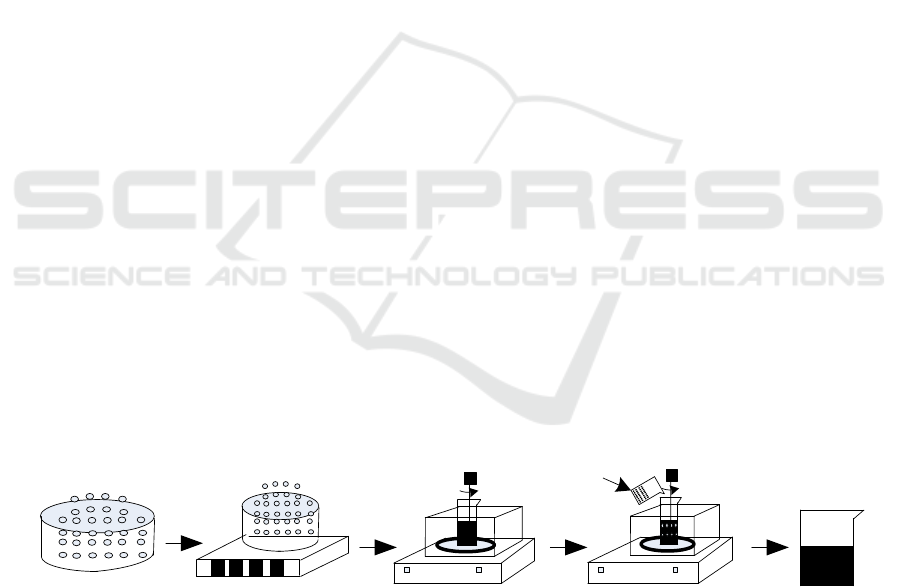
2.2. Preparation
LA/EG, LA/Al and LA /CF phase change composites were prepared by thermostatic water bath
heating method. A certain amount of lauric acid was weighed and added to a beaker. The beaker was
placed in a 60°C collector thermostatic heating magnetic stirrer and heated to melt. Expanded
graphite or aluminum powder or carbon fiber was added in proportion, heated for 20 minutes while
stirring so that it was fully mixed. Then, the beaker was placed in a vacuum drying oven at 50°C to
be dried to constant weight. The preparation process is shown in Figure 1.
Weighing
Melting
Mixing
Cooling
LA
EG\Al\CF
Figure 1. Preparation process of composite phase change energy storage material.
3. Composite phase change material testing
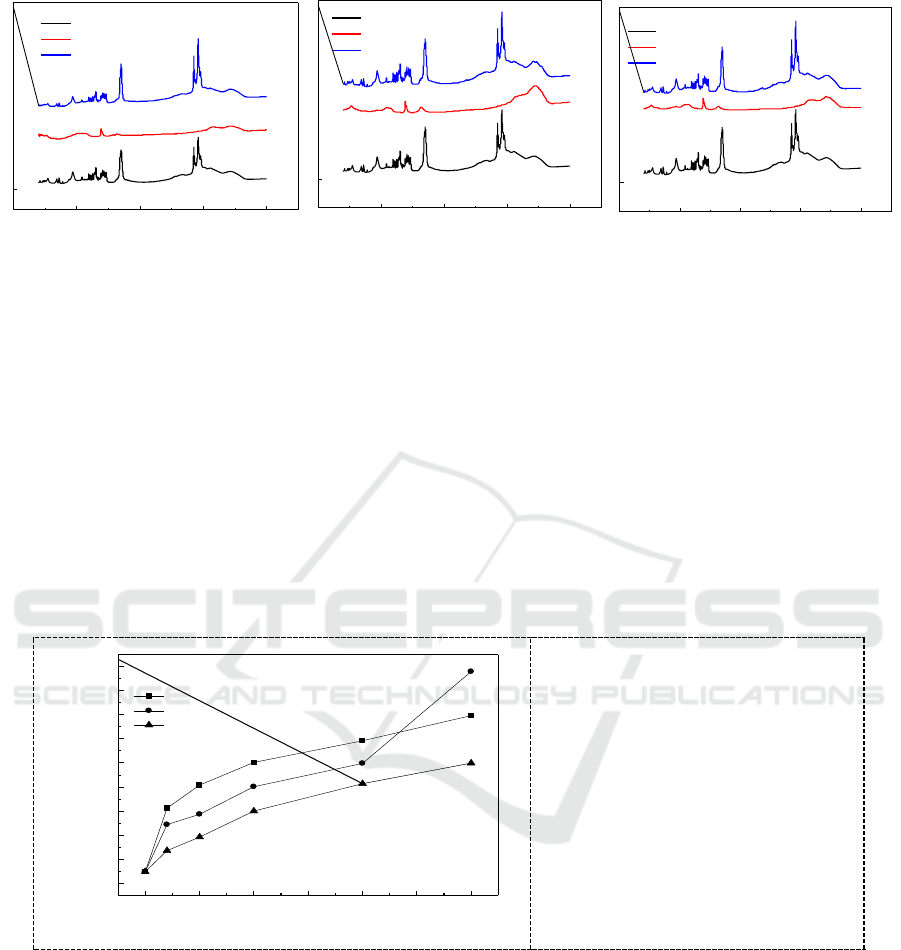
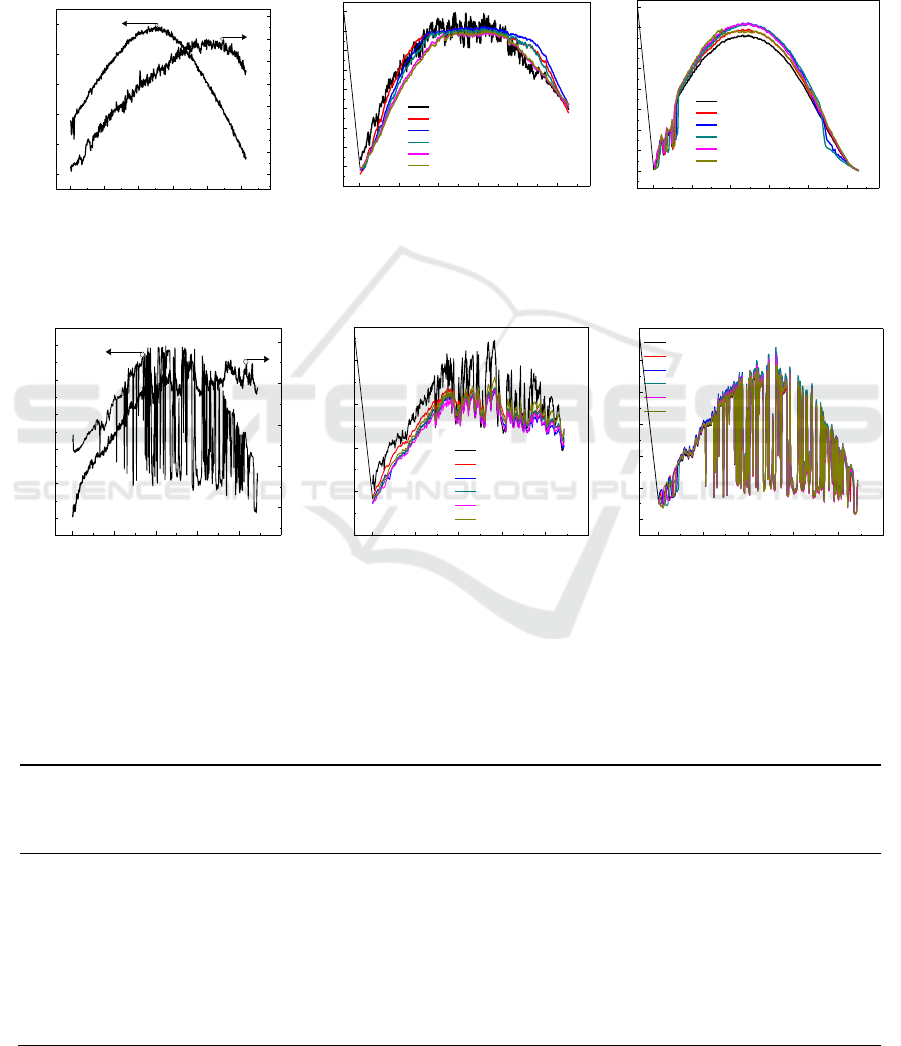
3.1. Physical and chemical properties and characterization of composite phase change material. The
FT-IR chart of lauric acid, expanded graphite, aluminum powder, carbon fiber, lauric acid / expanded
graphite, lauric acid / aluminum powder and lauric acid / carbon fiber phase change composite
material are shown in Figure 2.
IWEMSE 2018 - International Workshop on Environmental Management, Science and Engineering
148
0 1000 2000 3000 4000
B
A
Wave Number/cm
-1
LA
EG
LA +EG
0 1000 2000 3000 4000
B
A
LA
AL
LA+AL
Wave Number/cm
-1
0 1000 2000 3000 4000
B
A
LA
CF
LA+CF
Wave Number/cm
-1
(a) LA/EG (b) LA/Al (c) LA/CF
Figure 2. FT-IR chart of enhanced thermal conductive lauric acid phase change material.
It can be seen from the Figure that LA / EG, LA / Al, LA / CF phase change materials have
stretching vibration absorption peaks of methyl and methylene CH bonds at 2950 cm-1 and 2850
cm-1; the absorption peak at 1460cm-1 is characteristic peak of -CO- in carboxylic acid, the
absorption peak at 1700cm-1 isthe stretching vibration peak of C = O. The positions of infrared
spectrum characteristic peaks of LA / EG, LA / Al, LA / CF phase change material is basically
consistent with that of lauric acid, indicating that the physical and chemical properties of lauric acid
phase change material are not changed after thermal conductive filler is filled in lauric acid, which
ensures phase change property and thermal storage capacity of lauric acid phase change body in the
enhanced thermal conductive phase change material.
3.2. Thermal characteristic testing and analysis of composite phase change material
Thermal Conductivity(W/m.k)
wt%
0 5 10 15 20 25 30
0.6
0.7
0.8
0.9
1.0
1.1
1.2
1.3
1.4
1.5
B
A
AL
EG
CF
Figure 3. Influence of the three
kinds of thermal conductive filler
on thermal conductivity of
composites.
3.2.1. Thermal conductivity characteristics of the material. Thermal conductivity of LA / EG, LA /
Al and LA / CF composite phase change energy storage materials with different proportions were
measured by DRL-III heat flow conductometer. In order to meet the requirements of DRL-III heat
flow conductometer for shape and size of the test sample, a test sample of cylindrical composite
phase change material with a thickness of 5 mm and a diameter of 30 mm was prepared and the test
results are shown in Figure 3. It can be seen from Figure 3 that carbon fiber has a great effect on the
increase of thermal conductivity of composite materials when lauric acid is filled with aluminum
powder, carbon fiber and expanded graphite thermal conductive filler if the filler mass fraction is less
than 20%.The thermal conductivity of LA / EG composites increases sharply when the filler mass
fraction is beyond 20%.The thermal conductivity of composite phase change material
Preparation of Enhanced Thermal Conductive Phase Change Material and Its Application in Thermal Control of Solar Cells
149
reaches1.478W/k∙m when the mass fraction of expanded graphite reaches 30%, indicating that LA /
EG composite phase change material has a lower "leakage" threshold.
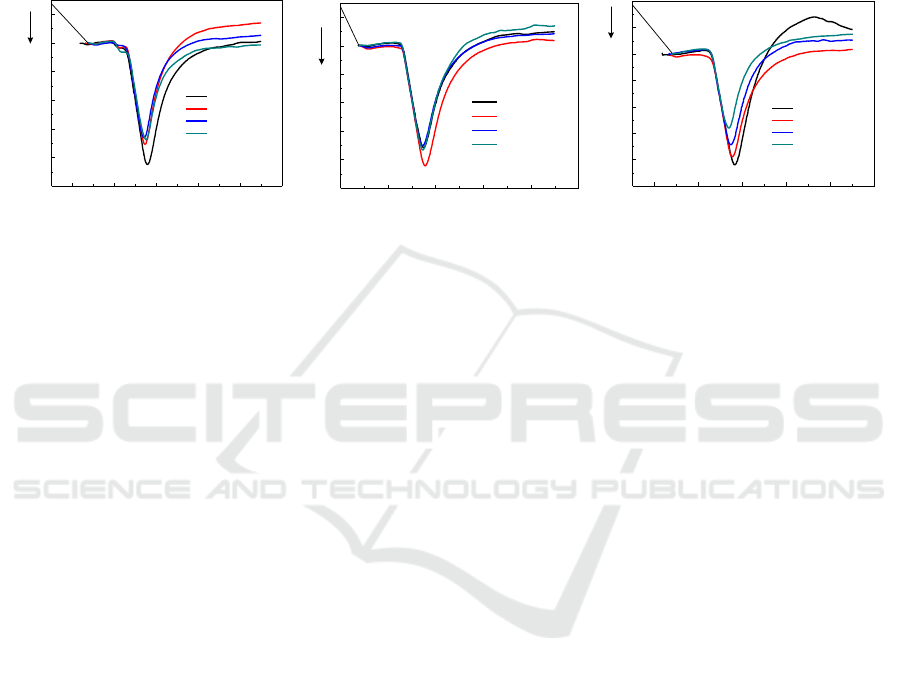
3.2.2. Phase change temperature and enthalpy characteristics of the material. The melting point and
phase change enthalpy of LA / EG, LA / Al and LA / CF composite phase change energy storage
materials in different proportions were measured by BEDS200 differential scanning calorimetry. The
results are shown in Figure 4 (a) (b) (c).
20 40 60 80 100 120
-25
-20
-15
-10
-5
0
5
B
A
EG wt2%
EG wt5%
EG wt10%
EG wt20%
Heat flow(mW·
g-1)
Temperature(℃)
20 40 60 80 100 120
-25
-20
-15
-10
-5
0
5
B
A
AI wt2%
AI wt5%
AI wt10%
AI wt20%
Temperature(℃)
Heat Flow(mW·
g-1)
20 40 60 80 100 120
-25
-20
-15
-10
-5
0
5
10
B
A
CFwt 2%
CF wt 5%
CF wt 10%
CF wt 20%
Temperature(℃)
Heat Flow(mW·
g-1)
(a)LA/EG (b) LA/Al (c)LA/CF
Figure 4. DSC chart of the three kinds of composite phase change materials.
It can be seen from the Figure that the phase change temperatures of the phase change materials
are 45°C , 45.5°C ,45.6°C and 45.4°C respectively when the mass fraction of Al is 2%, 5%, 10% and
20% in the LA / Al phase change material. The phase change temperatures of phase change material
are 45.5°C , 45.5°C , 45.8°C and 45.9°C respectively when the mass fractions of EG are 2%, 5%, 10%
and 20% in LA / EG phase change material. The phase change temperatures of phase change material
are 45°C , 45.2°C , 45.2°C and 45.1°C when the mass fractions of carbon fiber are 2%, 5%, 10% and
20% respectively in LA / CF phase change material. The phase change temperature of lauric acid is
not affected by the filling of expanded graphite, aluminum powder and carbon fiber thermal
conductive filler in LA phase change material. However, the phase change enthalpy decreases as the
increasing proportion of thermal conductive filler.
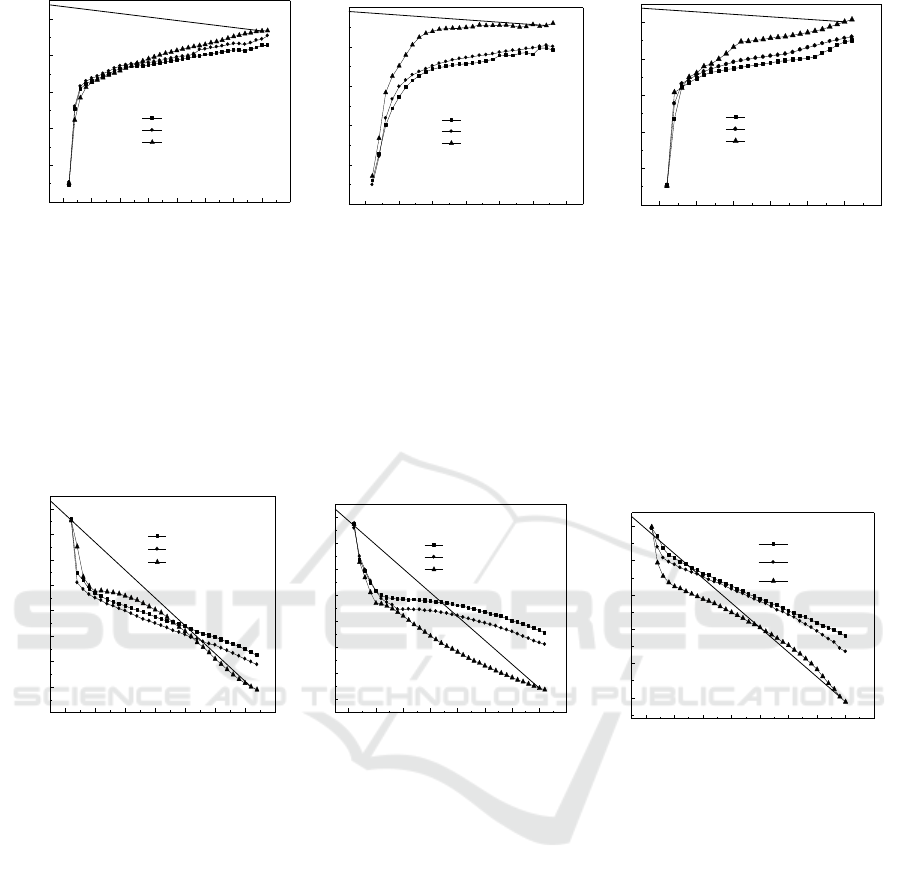
3.2.3. Material heat storage and heat release characteristics. For testing and analysis of melting
process (heat storage) of lauric acid / expanded graphite, lauric acid / aluminum powder and lauric
acid / carbon fiber composite phase change energy storage material, 10g of different composite phase
change materials were respectively put in a 50ml conical flask, and pt100 platinum was electronically
embedded in the composite material. Using water bath heating method, the conical flask was heated
in a thermostatic water bath at 70°C until the phase change material completely melted. In the
heating process, the temperature change characteristics of the composite phase change material were
recorded with Altay multi-channel data acquisition system, as shown in Figure 5.
From the melting characteristic curves of LA / EG, LA / Al and LA / CF composite phase change
materials, it can be seen that the time required for the phase change material to reach the saturation
temperature varies with the increase of the proportion of thermal conductive filler. The required time
decreases with the increase in proportion of thermal conductive filler. It is mainly because the heat
transfer rate of melting process is increased with the increase of thermal conductive filler ratio,
decrease of composite phase change material enthalpy and increase of heat conductivity.
IWEMSE 2018 - International Workshop on Environmental Management, Science and Engineering
150
0 5 10 15 20 25 30 35 40
10
20
30
40
50
60
B
A
EG wt2%
EG wt20%
EG wt10%
Time(min)
Temperature(℃)
0 5 10 15 20 25 30
10
20
30
40
50
60
B
A
Temperature(℃)
Time(min)
AI wt2%
AI wt20%
AI wt10%
0 5 10 15 20 25 30
10
20
30
40
50
60
B
Time(min)
Temperature(℃)
CF wt2%
CF wt20%
CF wt10%
(a)LA/EG (b)LA/Al (c)LA/CF
Figure 5. Melting characteristics of the three composite phase change materials.
For testing and analysis of coagulation (exothermic) characteristics of composite phase change
material, a conical flask loaded with fully melted composite phase change material was placed in the
ambient temperature for cooling. Meanwhile, the temperature change characteristics of the composite
phase change material were recorded with Altay multi-channel data acquisition system, as shown in
Figure 6.
0 5 10 15 20 25 30 35
20
25
30
35
40
45
50
55
60
B
A
EG wt2%
EG wt10%
EG wt20%
Temperature(℃)
Time(min)
0 5 10 15 20 25 30 35 40
25
30
35
40
45
50
55
60
B
AI wt2%
AI wt10%
AI wt20%
Time(min)
Temperature(℃)
Temperature(℃)
Time(min)
CF wt2%
CF wt20%
0 5 10 15 20 25 30 35 40
25
30
35
40
45
50
B
A
CF wt10%
(a)LA/EG (b) LA/Al (c)LA/CF
Figure 6. Coagulation characteristics of the three kinds of composite phase change materials.
From the coagulation characteristic curves of LA / EG, LA / Al and LA / CF composite phase
change materials, it can be seen that there is a phase change temperature near 45°C during the drop of
the curve. With the increase of the proportion of thermal conductive filler, phase change time
gradually decreases. In addition, temperature of composite phase change material decreases fast,
which is mainly because the increase of thermal filler proportion and the increase of thermal
conductivity of composite phase change material accelerate heat transfer rate of phase change
material.
4. The application of phase change material in photovoltaic thermal control system
The PV / PCM thermal control test system was designed by using EG / LA composite phase change
material with EG mass fraction at 10% to study optimal thermoelectric characteristic of solar cell
with different phase change materials. In the design, EG / LA composite phase change material was
respectively loaded in aluminum boxes with a volume of 0.48L (h = 2cm), 0.64L (h = 3cm), 0.8L (h
= 4cm), 0.96L (h = 5 cm) and1.12L (h=6cm). The five aluminum boxes were respectively attached to
the back surface of the solar cell module having an area of 210 mm × 90 mm with consistent VI
Preparation of Enhanced Thermal Conductive Phase Change Material and Its Application in Thermal Control of Solar Cells
151
characteristic by using thermal conductive silica gel. A test system was set up based on Altay
multi-channel data acquisition card, which comprises:Pt100 platinum resistor, temperature transmitter,
BT-2 radiation general table, computer and the like for measurement of solar cell surface temperature,
temperature of phase change material in the aluminum box, output voltage and current of solar cell,
solar irradiance and ambient temperature, respectively.
On March 31, 2017 and April 1, 2017, the thermal and electrical characteristics of the designed
PV / PCM thermal control test system were experimentally tested. The results are shown in Figure 7
and Figure 8.
10:23:58 12:25:58 14:27:58 16:29:58 18:31:58
0
200
400
600
800
1000
B
9
12
15
18
21
24
27
30
8:22 10:22 12:22 14:22 16:22
Time(hh:mm)
18:22
Solar Irradiance(W/m
2
)
Ambient Temperature (℃)
10:22:57 12:24:57 14:26:57 16:28:57 18:30:57
5
10
15
20
25
30
35
40
45
50
B
Temperature(℃)
8:22 10:22 12:22 14:22 16:22
Time(hh:mm)
18:22
No PCM
PCM(2cm)
PCM(3cm)
PCM(4cm)
PCM(5cm)
PCM(6cm)
10:22:57 12:24:57 14:26:57 16:28:57 18:30:57
0.0
0.3
0.6
0.9
1.2
1.5
1.8
2.1
2.4
B
8:22 10:22 12:22 14:22 16:22
18:22
Power(W)
No PCM
PCM(2cm)
PCM(3cm)
PCM(4cm)
PCM(5cm)
PCM(6cm)
Time(hh:mm)
(a) Temperature and irradiance (b) Solar cell temperature (c) Solar cell output power
Figure 7. Test performance of solar cell thermal control system (2017.3.31).
10:32 12:34 14:36 16:38
0
200
400
600
800
1000
B
A (0:00)
18
21
24
27
30
8:32 10:32 12:32 14:32 16:32
Time(hh:mm)
Solar Irradiance(W/m
2
)
Ambient Temperature (℃)
10:32 12:34 14:36 16:38
10
20
30
40
50
K1
A (0:00)
8:32 10:32 12:32 14:32 16:32
Time(hh:mm)
No PCM
PCM(2cm)
PCM(3cm)
PCM(4cm)
PCM(5cm)
PCM(6cm)
Temperature(℃)
8:32 10:32 12:32 14:32 16:32
Time(hh:mm)
No PCM
PCM(2cm)
PCM(3cm)
PCM(4cm)
PCM(5cm)
PCM(6cm)
Power(W)
10:32 12:34 14:36 16:38
0.0
0.5
1.0
1.5
2.0
2.5
3.0
B
A (0:00)
(a) Temperature and irradiance (b) Solar cell temperature (c) Solar cell output power
Figure 8.Test performance of solar cell thermal control system (2017.4.1).
The experimental results were statistically analyzed, with the statistical data shown in Table 1,2.
Table 1.Statistical table of solar cell system thermoelectric characteristics data (2017.3.31).
Parameter name
Aluminum
box V=0.48L
(h=2cm)
Aluminum
box V=0.64L
(h=3cm)
Aluminum
box
V=0.8L
(h=4cm)
Aluminum
box V=0.96L
(h=4cm)
Aluminum
box V=1.12L
(h=5cm)
Without
phase
change
material
Statistical time (hh:mm)
11:00-15:00
Average solar irradiance
672.485(W/m
2
)
The maximum solar cell
temperature
42.17°C
43.01°C
40.68°C
39.92°C
39.24°C
46.07°C
The average solar cell
power
0.985W
0.999W
1.025W
1.055W
1.054W
1.034W
The Maximum Power
2.559W
2.696W
2.645W
2.634W
2.592W
2.575W
IWEMSE 2018 - International Workshop on Environmental Management, Science and Engineering
152

Table 2.Statistical table of solar cell system thermoelectric characteristics data (2017.4.1).
Parameter name
Aluminum
box
V=0.48L
(h=2cm)
Aluminum
box
V=0.64L
(h=3cm)
Aluminum
box V=0.8L
(h=4cm)
Aluminum
box
V=0.96L
(h=4cm)
Aluminum
box
V=1.12L
(h=5cm)
Without
phase
change
material
Statistical time (hh:mm)
11:00-15:00
Average solar irradiance
834.59(W/m
2
)
The maximum solar cell
temperature
46.05°C
46.24°C
45.70°C
44.7°C
45.22°C
49.8°C
The average solar cell
power
1.297W
1.336W
1.318W
1.355W
1.328W
1.247W
The Maximum Power
2.078W
2.170W
2.160W
2.164W
2.079W
1.991W
From the experimental results, it can be seen that phase change material exerts obvious effect on
solar cell temperature control. By adding phase change temperature control system to the solar cell,
the temperature of the solar cell decreased. The temperature control effect was more obvious with the
increase in thermal control material mass. For example, on March 31, 2017, the maximum solar cell
temperature decreased by 7°C.On April 1, 2017, the maximum solar cell temperature decreased by
about 5 °C. At the same time, solar cell output power increased in varying degrees after the use of
phase change material. For example, on March 31, by taking advantage of heat dissipation of phase
change material, the maximum solar cell output power increased by 0.121W, nearly 4.6%.In addition,
in the PV / PCM system, the effective thermal control of phase change material concerns external
weather conditions such as solar irradiance, ambient temperature. For example, on April 1, solar
irradiance was high, the maximum ambient temperature was 28.5°C ,the phase change material
required for effective temperature control of solar cell (area: 210mm × 90mm) was 0.96L;on March
31, the solar irradiance was low, the maximum ambient temperature was 23.5°C ,the phase change
material required for effective temperature control of solar cell (area: 210mm × 90mm) was only
0.80L. The experimental results provide experimental basis for the optimization design of PV / PCM
thermal control system.
5. Conclusions
The phase change temperature of lauric acid was stable and not greatly affected by the filling of
expanded graphite, aluminum powder and carbon fiber thermal conductive filler in LA phase change
material. Among the prepared LA / EG, LA / Al, LA / CF composite phase change materials, LA / EG
composite phase change material has a low "leakage" threshold, and the thermal conductivity reached
1.478W/m∙K when EG mass fraction reached 30%. For the PV / PCM thermal control system
designed by LA / EG composite phase change material, in natural environment, phase change
material has a significant effect on solar cells temperature control. During the test, with the addition
of phase change material, the maximum solar cell temperature decreased by about 7°C and the
maximum cell output power also increased. In PV / PCM system, effective thermal control of phase
change material is greatly influenced by external weather conditions such as solar irradiance and
ambient temperature. The experimental results provide experimental basis for the optimization design
of PV / PCM thermal control system.
Acknowledgments
The authors thank National Natural Science Foundation of China (No. 51566001) and Education
department Major Project Foundation of Yunnan province(No.ZD2014014) for their financial supply.
Preparation of Enhanced Thermal Conductive Phase Change Material and Its Application in Thermal Control of Solar Cells
153

References
[1] Radziemska E 2009 Performance analysis of a photovoltaic-thermal integrated system
International journal of photoenergy ID 732093
[2] Jong P K, Ho Lim, Ju Hun Song and et al 2010 Numerical analysis on the thermal
characteristics of photovoltaic module with ambient temperature evariation Solar Energy
and Materals Solar 10: 1-4
[3] Wei C G, Bao Y X, Deng X Y and et al 2013Photovoltaic / Thermal System Performance
inPhotovoltaic Building Integration.Journal of Chinese Ceramic Society 41: 149-152
[4] Kamran M, Ali E M and Cheng X L 2013 A review of PV/T technologies: Effects of control
parameters. International Journal of Heat and MassTransfer 64:483-500
[5] Zhao J, Qin N and Duan Z Q 2009 Experimental research on solar cells and PV / T structure
Acta Energiae Solaris Sinica 327-331
[6] Hausler T and Rogass H 1998 Photovoltaic module with latent heat storage – collector In:
Proceedings of the 2nd world conference and exhibition on photovoltaic solar energy
conversion Vienna, Austria; 6–10 July, 1998
[7] Hasan A, McCormackS J, Huang M J and Norton B 2014 Characterization of phase change
materials for thermal control of photovoltaics using differential scanning calorimetry and
temperatare history method Energy Convers Manag 81:322-9
[8] Maiti S, Banerjee S, VyasK,Patel P and Ghosh P K 2011 Self regulation of photovoltaic
module temperaturein V-trough using a metal–wax composite phase change matrix Sol
Energy 85:1805–16
[9] Ma T, Yang H X, ZhangY P, Lu L and Wang X 2015 Using phase change materials in
photovoltaic systems for thermal regulation and electrical efficiency improvement:A review
and outlook.Renewable and Sustainable Energy Reviews 43:1273-1284
[10] Preet S 2018 Water and phase change material based photovoltaic thermal management
systems: A review Renewable and Sustainable Energy Reviews 82,Part 1:791-807
IWEMSE 2018 - International Workshop on Environmental Management, Science and Engineering
154
