
Measurement of Post-earthquake Reconstruction System
based on Synergy Theory
X D Liang
1
, Q X Xiang
2
, C M Liu
3,*
and M Wang
4
1,2,3,4
Sichuan University, Sichuan, China
Corresponding author and e-mail: C M Liu,2016225025022@stu.scu.edu.cn
Abstract. This paper considers the post-earthquake restoration and reconstruction as a
complex Synergetic system from the perspective of Synergetic theory. In order to measure the
coordinated development and orderly evolution trend of the system, a comprehensive and
scientific index system is established from the two aspects of economic benefits and social
perfection. The information entropy weight method and TOPSIS (Technique for Order
Preference by Similarity to Ideal Solution) are used to construct a synthesized estimating
model and the restoration and reconstruction in Sichuan Province from 2008 to 2013 is taken
as an example to be an empirical analysis. The results show that the restoration and
reconstruction after Wenchuan earthquake in 2008 has evolved toward a healthy and orderly
direction. The results of the measurement are in agreement with the actual situation, proving
the validity of the model in the measurement of post-earthquake development.
1. Introduction
Earthquake is one of the most destructive disasters jeopardizing human survival and development,
bringing serious damages to regional economic and social development [1]. Post-earthquake
restoration and reconstruction is the first consideration to alleviate the serious losses caused by
disasters to the national economy and people’s livelihood. Existing researches mainly focus on
lessons learned from post-earthquake reconstruction [2], geological structures of earthquake
regions[3], earthquake emergency[4], the procedure of restoration and reconstruction[5], planning
program[6], policies [7] and so on. However, there have rarely been any study focusing on the actual
situation of post-earthquake restoration and reconstruction. This study conducts a research from this
perspective.
This article measures the regional development of post-earthquake restoration and reconstruction
from an integral angle. The post-earthquake restoration and reconstruction is considered as a complex
collaborative system by establishing a comprehensive and scientific index system [8] from the two
aspects of economic benefits and social perfection. Coordination of the post-earthquake restoration
and reconstruction is quantitatively predicted by using the information entropy weight method[1] and
TOPSIS[9] to establish a synthesized estimating model.
This year (2018) is the tenth anniversary of the Wenchuan earthquake. And suffered the severest
damages in the year, Sichuan Province, the recovery after the earthquake struck a chord in the hearts
of people across the world. Taking Sichuan Province as an example have certain scientific
significance to some extent.
232
Liang, X., Xiang, Q., Liu, C. and Wang, M.
Measurement of Post-earthquake Reconstruction System based on Synergy Theory.
In Proceedings of the International Workshop on Environmental Management, Science and Engineering (IWEMSE 2018), pages 232-239
ISBN: 978-989-758-344-5
Copyright © 2018 by SCITEPRESS – Science and Technology Publications, Lda. All rights reserved
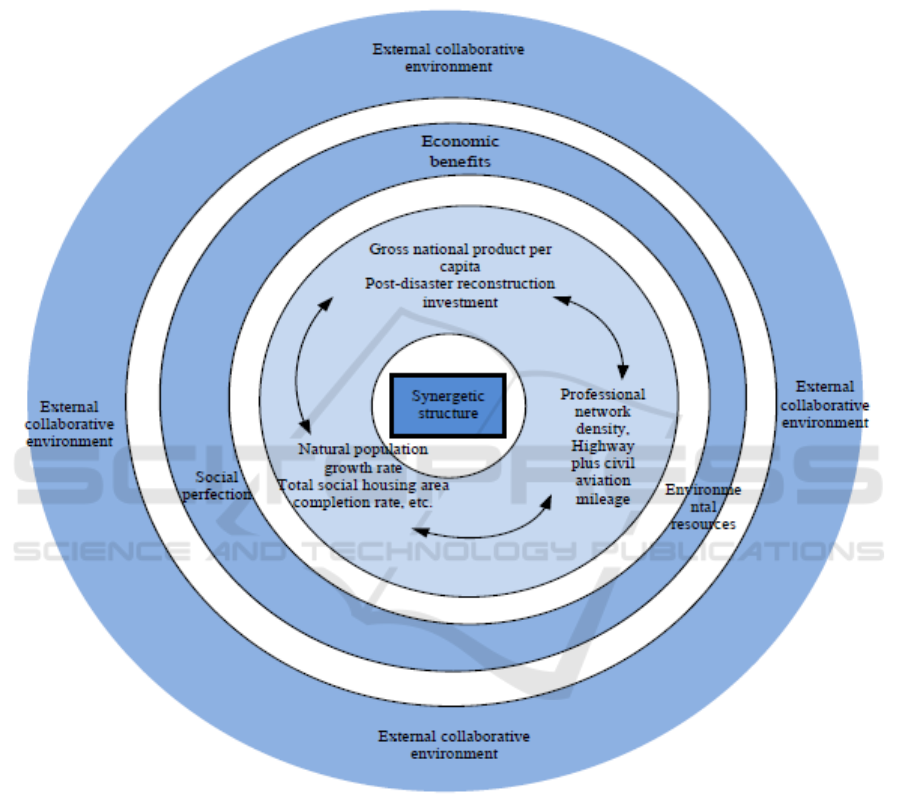
2. Synergetic structure of post-earthquake restoration and reconstruction
Synergetics mainly studies the formation and self-organization of patterns and structures in open
systems far from thermodynamic equilibrium. The post-earthquake restoration and reconstruction
evaluation system is an open economics-society-resources composite one, featured with the
characteristics in Figure 1 in its evolution. Thus, synergetics can well explain the complex evolution
of the post-earthquake restoration and reconstruction evaluation system.
Figure 1. Post-earthquake restoration and reconstruction evaluation system synergetic structure.
3. Index selection of the post-earthquake reconstruction system
Post-earthquake restoration and reconstruction evaluation system is quite complex system. Selection
of the evaluation indexes directly affects the eventual establishment of the evaluation index system.
This paper strictly following the principles of representative, comprehensive, systematic,
scientific, related, quantifiable, accessible, maneuverable, error-reducing, and efficient, and with
reference to previous papers’ index selection, this paper divides the post-earthquake recovery
evaluation system into the target layer, i.e., the post-earthquake restoration and reconstruction
evaluation system, and the principle layer, i.e., economic benefit and social improvement, and the
index layer, namely, the fourteen indexes including per capita gross national product (GNP),
Measurement of Post-earthquake Reconstruction System based on Synergy Theory
233

reconstruction investment, the whole society completion rate of housing areas, and health institution,
etc. (refer to Table 1).
Table 1. Post-earthquake Recovery and Reconstruction index set.
Target
Standard
Index
unit
property
Regional
development
measurement
system of
Post-
earthquake
Recovery
and
Reconstructio
n
A
Economic
B1
Per Capita GNP---C10
yuan
Benefit
Proportion of Investment in Fixed Assets to GDP--
C11
%
Benefit
Expenditure for Post-earthquake Recovery and
Reconstruction ---C12
yuan
Benefit
Taxes Revenue ---C13
yuan
Benefit
Society
B2
Natural Growth Rate---C20
%
Benefit
Unemployment Rate in Urban Areas---C21
%
Cost
Rate of Total Floor Space of Buildings Completed
in Construction ---C22
%
Benefit
Release information from Sichuan earthquake
preparedness and disaster reduction information
network---C23
piece
Benefit
Number of Health Care Institutions---C24
unit
Benefit
Number of Beds in Health Care Center---C25
unit
Benefit
Number of Fixed and mobile Telephone
Subscribers at Year-end---C26
10 000
subscribers
Benefit
Highways and Total Civil Aviation Routes ---C27
10 000 km
Benefit
Professional network density---C28
km/unit
Benefit
Per Capita Public Green Areas---C29
(sq.m)
Benefit
4. Establishment of evaluation model
Determine the
entropy weight
Evaluation
Determine the order
of the merits of each
year
Original data
Non-dimensional
treatment
Determine the
entropy weight
Construct a weighted
specification matrix
Determine the positive
ideal solution and the
negative ideal solution
Calculate the distance
between the evaluation
objects to the positive
ideal solution and the
negative ideal solution
Calculate the
similarity between
the ideal solution and
each year
X
11
X
12
X
1n
Y
11
Y
12
Y
1n
.
.
.
.
.
.
Figure 2. Measurement of post-earthquake reconstruction system based on synergy theory.
IWEMSE 2018 - International Workshop on Environmental Management, Science and Engineering
234
Common weighting methods include entropy weight method, standard deviation method, CRITIC
method and expert estimation method. Common evaluation methods include analytic hierarchy
process, index synthesis method, efficiency coefficient method, optimization distance method, fuzzy
comprehensive evaluation method, grey correlation method, etc. Entropy weight method is an
objective weighting method. In the entropy weight method, the entropy weight of each index is
calculated according to its information entropy and variation, and is then modified according to the
entropy in order to obtain an objective weight. Based on the double base point method, the TOPSIS
method (Technique for Order Preference by Similarity to Ideal Solution) detects the distance between
the object and the optimal and worst solutions. The object is deemed as best if it is closest to the
optimal solution and farthest from the worst solution; otherwise it is deemed as worst. The TOPSIS
method can objectively evaluate the plans with multiple indexes. The evaluation process in this
article is shown in Figure 2.
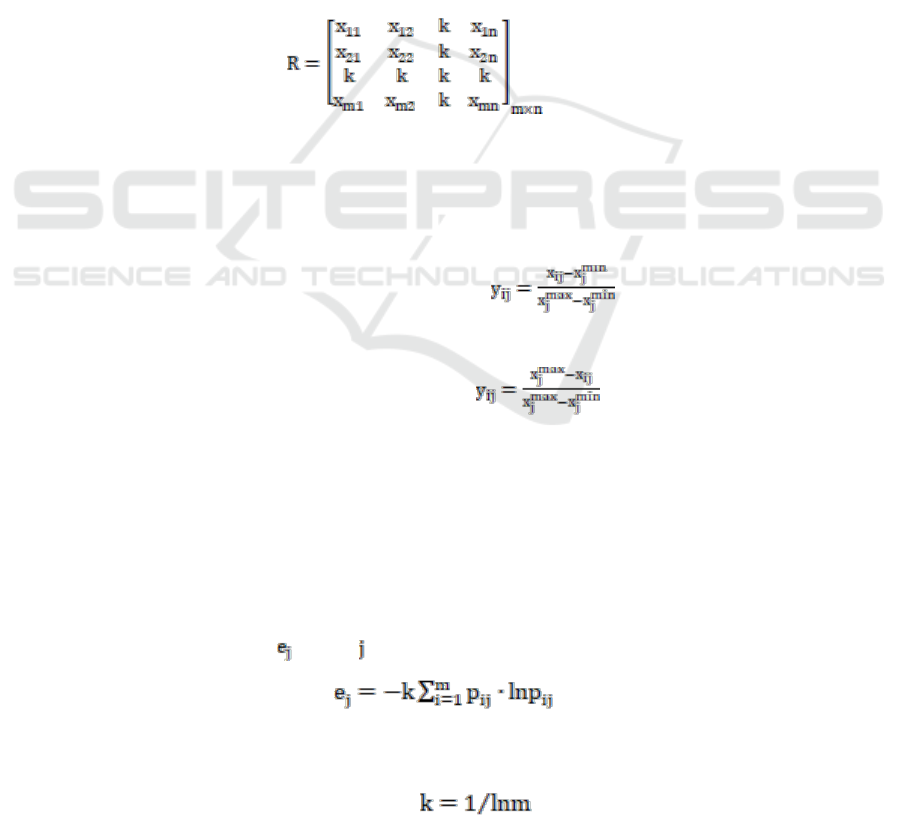
4.1. Determine the weight-entropy method
(1) Build a matrix
Use
m
year ,
n
measurement indicators to build the initial measure matrix in Regional
development measurement system for Post-Earthquake reconstruction
R
.
(1)
(2) Non-dimension treatment
Data non-dimension treatment is the first step in the comprehensive evaluation step. in
consideration of Natural Growth Rate may be negative number in the indexes,0-1 standard
transformation is selected to deal with the original data. Add 0.00001 to translate the non-dimension
data. The processing formula is as follows:
Benefit type: (2)
Cost type: (
3)
(3) Determine the entropy weight
According to the definition of entropy value, the smaller entropy value is, the grater variation of
the index value is, provided amount of information ,play a greater role of the index in the
comprehensive evaluation, and get the higher entropy weight in the index.
On the contrary, the greater entropy value is, the smaller variation of the index value is, provided
a relatively small amount of information ,play a smaller role of the index in the comprehensive
evaluation, the lower entropy weight should be got in the index.
Calculate the entropy value of the index :
(4)
In the formula:
(5)
Measurement of Post-earthquake Reconstruction System based on Synergy Theory
235
Calculate the entropy weight of the index:
(6)
4.2. Calculate the score of a particular year -- TOPSIS Algorithm model
TOPSIS (Technique for Order Preference by Similarity to Ideal Solution) The double base point
method is to rank the distances between the evaluation objects to the positive ideal solution and the
negative ideal solution, If the evaluation object is closest to the optimal solution and meanwhile is
farthest away from he worst solution, It Shows the evaluation object is the best one. otherwise it is
the worst one. The TOPSIS algorithm model can evaluate the plans in multiple indicators objectively.
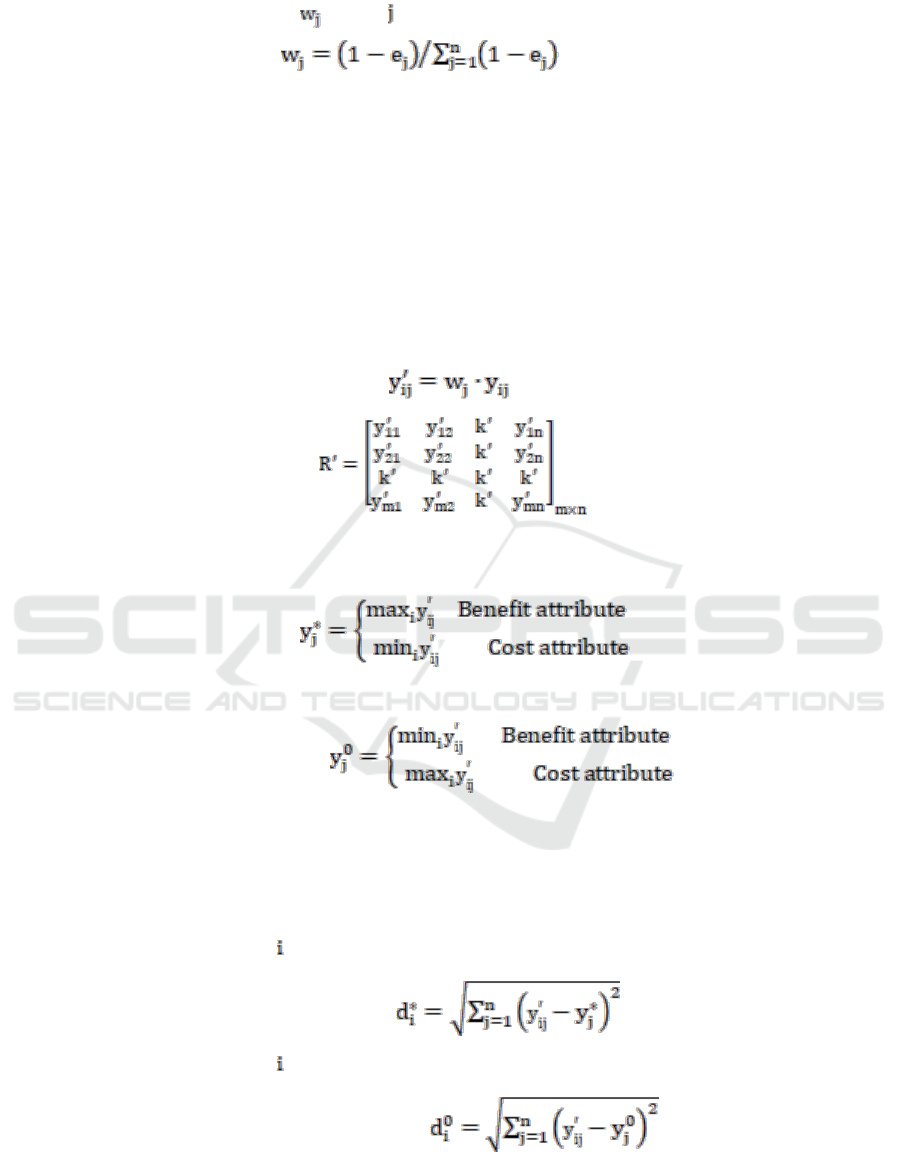
(1) Construct a weighted specification matrix
Considering the different weight of evaluation indexes to the Post-Earthquake reconstruction
measurement system, weight the evaluation indexes via information entropy and get the weighted
evaluation matrix.
(7)
(8)
(2) Determine the positive ideal solution and the negative ideal solution
Positive ideal solution:
(9)
Negative ideal solution:
(10)
When determine the positive ideal solution, Take the maximum value of the benefit indicator, and
take the minimum value in cost type. We should take the minimum value of the benefit indicator, and
take the maximum value in cost type if we determine the negative ideal solution.
(3) Calculate the distance between the evaluation objects to the positive ideal solution and the
negative ideal solution
Calculate the distance from year to the positive ideal solution.
(11)
Calculate the distance from year to the negative ideal solution.
(12)
(4) Calculate the similarity between the ideal solution and each year.
IWEMSE 2018 - International Workshop on Environmental Management, Science and Engineering
236

(13)
(5) Determine the order of the merits of each year
According to the TOPSIS model principle, the closer to the positive ideal solution and farther
away from the negative ideal solution, the better of the evaluation year is.
Sort the c* from big to small, the bigger of the c* is, it indicate this year got the better results
than other years in the Regional sustainable development measurement system for Post-Earthquake
reconstruction.
5. Example analysis
To ensure objectivity and comprehensiveness, the raw data is obtained from Sichuan Statistical
Yearbook, Annual Report on Government Information Disclosure of Sichuan Earthquake
Administration and expert estimation. China News Service Chengdu Jan. 10, 2012 report (Liu Xian)
Jiang Jufeng, of Sichuan Province, said on Jan. 10 in the Fifth Session of the 11th Sichuan Provincial
People’s Congress that the post-earthquake restoration
In the Fifth Session of the 11th Sichuan Provincial People’s Congress that the post-earthquake
restoration and reconstruction has successfully concluded. Since the restoration is a long-term
process, and suffers from secondary disasters without a definite concluding point, this paper selects
the 6 years data from 2008 to 2013 for analysis, and arrives at a conclusion
5.1. Comprehensive evaluation
According to formula (1) to (6), we get the entropy and entropy weight of the index. (Reference table
2).
Table 2. Sichuan development measurement system for Post-Earthquake reconstruction entropy
value and entropy weight.
Target
Standard
Index
entropy weight in index system
entropy value
Regional
development
measurement
system of Post-
earthquake
Recovery and
Reconstruction
A
Economic
B1
C10
0.595494665
0.06941247
C11
0.585568589
0.071115769
C12
0.483378048
0.088651503
C13
0.619444425
0.065302729
society
B2
C20
0.354316435
0.110798269
C21
0.362337034
0.109421947
C22
0.724367844
0.047298038
C23
0.509207337
0.084219238
C24
0.657976843
0.058690628
C25
0.66838624
0.056904392
C26
0.672634726
0.056175359
C27
0.586045558
0.071033922
C28
0.659325567
0.058459189
C29
0.693956667
0.052516548
According to formula (1) to (13), we get the comprehensive evaluation value and comprehensive
ranking from 2008 to 2013. (Reference table 3)
Measurement of Post-earthquake Reconstruction System based on Synergy Theory
237

Table 3. Sichuan sustainable development measurement system for Post-Earthquake reconstruction
result.
Regional development
measurement system of
Post-earthquake
Recovery and
Reconstruction
A
year
Comprehensive evaluation value
Rank result
2008
0.415266719
6
2009
0.497085743
5
2010
0.658781636
1
2011
0.502235321
4
2012
0.541540086
2
2013
0.529082342
3
5.2. Result analysis
It is known from the basic principles of entropy weight method that an index with a greater
information entropy weight provides more effective information for decision-makers, and one with a
smaller weight provides less effective information.
Table 2 shows that the Rate of Total Floor Space of Buildings Completed in Construction
occupies the biggest proportion (weight 0.724367844), as is described by Wang Yanru that the
housing reconstruction involving people’s fundamental requirement is especially important [10]. The
completion of basic facilities such as the Per Capita Public Green Areas (weight 0.693956667),
Number of Fixed and mobile Telephone Subscribers at Year-end (weight 0.672634726), Number of
Beds in Health Care Center (weight 0.66838624) are relatively important for post-earthquake
restoration and reconstruction. The Natural Growth Rate (with a proportion of 0.354316435) and the
Unemployment Rate in Urban Areas (with a proportion of 0.362337034) are relatively weaker
impacts on post-earthquake restoration and reconstruction. This is because post-earthquake
restoration and reconstruction must be fully considered on the basis of an appropriate population size
[11]. In general, the improvement of social functions is more important to post-earthquake economic
development.
As shown in Table 3, the 2nd to 3rd years after the earthquake is a critical period. During this
period, the sufficient investment and whole society housing completion make year 2010 the highest
ranking one.
The results reflect the importance of local government’s strategy on post-earthquake restoration
and reconstruction, providing scientific reference to other places with similar situations.
6. Conclusions and prospects
Based on the sustainable development evaluation method of TOPSIS (double base point), this paper
further explores the evaluation methods and ideas of the sustainable development of post-earthquake
restoration and reconstruction. With the advantages of TOPSIS in association vector relation and
proximity inherited, the objective entropy weigh method is adopted to determine weights for each
index, avoiding the shortcomings of evaluation methods in index weight. Government yearbook data
is also utilized to validate the feasibility and universalness of the method, which proves to be a
scientific one. The effective measurement of post-earthquake restoration evaluation system shows
that the two to three years after the earthquake is the critical period, during which local advantages
should be fully made use of to boost economy by integrating regional location and facilities and
guaranteeing people’s livelihood.
References
[1] Jiang R P 2011 the great impact of the East Japan earthquake on the Japanese economy
IWEMSE 2018 - International Workshop on Environmental Management, Science and Engineering
238

Japanese Journal (04): p 3-16
[2] Zhao B 2008 experience and lessons of Japan's post disaster reconstruction and enlightenment
to China Journal of Southwest University for Nationalities (HUMANITIES AND SOCIAL
SCIENCES EDITION) (09): p 33-35
[3] Wang H, Li H B, Si J L and Huang Y 2013 the relationship between the structural
characteristics of the Wenchuan earthquake fault zone and the uplift of Longmen mountain
Acta Petrology Sinica (06): p 2048-2060
[4] Gao P and Yu X 2013 study on earthquake emergency management in China,US and Japan
Journal of Natural Disasters | J Nat Disaster (04): p 50-57
[5] Fukutome, K., Aiba S, Ichiko T, Ninai N, Yono H K et al 2011 urban regeneration in Taiwan :
comparative studies on urban reconstruction process after earthquake among Turkey,
Taiwan and Japan : Part 5 Journal of Hepatology 55(55): p 369-78
[6] Hirayama, Y 2000 collapse and reconstruction: housing recovery policy in Kobe after the
Hanshin great earthquake Housing Studies 15(1): p 111-128
[7] Wu J Y and Lindell M .K 2004 housing reconstruction after two major earthquakes: the 1994
Northridge earthquake in the United States and the 1999 Chi-Chi earthquake in Taiwan
Disasters 28(1): p 63-81
[8] Chen S B 2009 Research on the main part of circular agriculture development based on
Synergy Theory South China Agriculture (05): p 103-107
[9] Zhou Y and Pu X G 2014 Application of entropy weight TOPSIS model in database
performance evaluation Library and Information Work (08): p 36-41
[10] Wang Y R,Dai J W and Mao C G 2010 Cost estimation method of post-earthquake
rehabilitation of buildings Journal of Natural Disasters | J Nat Disaster (4): p 163-168.
[11] Peng L,Liu S Q,Liu S Z and Su C J 2009 Studies on Bearing Capacity of Resources and
Environment of 10 counties in Area Hited byWenchuan Earthquake Engineering Science
Edition 41(3): p 294-300
Measurement of Post-earthquake Reconstruction System based on Synergy Theory
239
