
Determination of Trace Perchlorate in Drinking Water by
Developing Ion Chromatography Coupled with Mass
Spectrometry (IC-MS)
Y M Xu
1
, H J Guo
1
, H Y Ning
1
, H W Yuan
1
, X Hu
1
, J He
1,2
, P C Pan
1,2
and H
Chen
2,*
1
Sichuan West Analytical Testing Co., Ltd., Chengdu, 610101, China
2
Sichuan Institute of Atomic Energy, Chengdu, 610101, China
Corresponding author and e-mail: H Chen, haochen@siae.cn
Abstract. Perchlorate (ClO
4
-
) in drinking water poses healthy risk for human beings. The
routine method of IonPac AS16 polarizable anion analytical column to analyze ClO
4
-
in
drinking water failed due to the false positive behavior of perchloric acid. Therefore, an ion
chromatography coupled with mass spectrometry (IC-MS) method was developed to
determine the content of ClO
4
-
in drinking water based onIonPac AS20 column, 45 mM KOH
eluent and negative ion mode of mass spectrometry. The results show that the ClO
4
-
concentration displayed an excellent linear performance in the range of 1-20μg/L using the
newly developed method, its method detection limit (MDL) was determined to be 0.47μg/L,
and the recoveries of the spiked samples ranged from 92.0% to 101.5%, meeting the relevant
requirements of GB/T 6379.6-2009.
1. Introduction
Perchlorate (ClO
4
-
) has been widely used in many fields, such as rocket propellants, fireworks
manufacturing, arms industry, car airbag, highway safety flash board, etc[1]. Perchlorate is
chemical stable and highly soluble in water, so with entering into environment during industrial
production and discharge, it goes easily into the underground water, causing water pollution. These
contaminated water often harms human health through the food chain or drinking water[2,3].
Recently, overdose of perchlorate has been detected in the Chinese tea exported to Europe. So
European Union (EU) is preparing to set more strict standards to limit the importation of high
perchlorate-containing Chinese tea, which is causing more concern. In the late 2015, EU required the
maximum content of 0.75 mg/kg for the perchlorate in tea in the proposal of Circular on the Standard
for Perchlorate and Anthraquinone Content in Tea in the EU. It has been reported[4-6] that the ionic
radius of ClO
4
-
is very close to that of iodide (I) ions, so it tends to diffuse into the thyroid competed
with I ions, hinders the absorption of I ions in thyroid, decreasing the synthesis of thyroid hormone,
and resulting in metabolism of human body in disorder. The higher ClO
4
-
content even leads to
thyroid cancer. Especially, it is more harmful for the growth and development of fetal and infant
central nervous system.
266
Xu, Y., Guo, H., Ning, H., Yuan, H., Hu, X., He, J., Pan, P. and Chen, H.
Determination of Trace Perchlorate in Drinking Water by Developing Ion Chromatography Coupled with Mass Spectrometry (IC-MS).
In Proceedings of the International Workshop on Environmental Management, Science and Engineering (IWEMSE 2018), pages 266-271
ISBN: 978-989-758-344-5
Copyright © 2018 by SCITEPRESS – Science and Technology Publications, Lda. All rights reserved

Based on the above issues, American Environmental Protection Organization (EPA) has enacted
the Safe Drinking Water Act in which perchlorate is listed as one of the environmental pollutants, and
established a national standard for drinking water[7-8] that the reference dose of perchlorate for
human health is 0.7 μg/kg per day, that is, the concentration of perchlorate in drinking water is less
than 24.5 μg/L. Wu et al. [9] conducted a preliminary investigation on the perchlorate content of 300
water samples from 15 sites in 13 provinces in China and found that 86% of the water samples
contained perchlorate at a concentration ranging from 0.02 μg/L to 54.4 μg/L. Perchlorate pollution
was found in Liuyang City[10], China's largest fireworks production base. In addition, the
perchlorate concentration in the dust of northern China was in the range of 0.132-5300 mg/kg[11].
While in southern India, the perchlorate concentration in groundwater ranged from 0.005 to 7690
μg/L[12]. Apparently, perchlorate pollution of drinking water has become more and more global,
widespread and serious.
Over the years, the rapid development of ion chromatography and high sensitive techniques made
the analysis of trace perchlorate more accurate.
EPA has developed ion chromatography as the standard method 314.0[13]. However, with the
technological development of analyzing perchlorate[14], it was found that during analyzing some
drinking water samples using IonPac AS16 column, the qualitative determination of perchloric acid
appeared false positive behavior with the issue of eluting both 4-chlorobenzenesulfonic acid and
perchlorate. For this problem, IonPac AS20 column has been improved by modifying the filler
structure with a high-capacity, anion-exchange column of hydroxide system. This structure could
greatly reduce the adsorption of perchlorate by the stationary phase of 4-chlorobenzenesulfonic acid
and eliminate the interference of 4-chlorobenzenesulfonic acid to determining perchlorate content. In
the present study, we select IonPac AS20 as the pretreatment separation column to determine trace
perchlorate.
2. Experimental
2.1. Instruments and reagents
Thermo Scientific Dionex ICS-5000
+
Ion Chromatography with EGC Eluent Auto-Generator,
Conductivity Detector and ChromeLeon 7 Chromatography workstation;
Thermo Scientific MSQ plus with Electrospray Ion (ESI) source;
Dionex AS20 chromatography column, 250 × 2 mm;
Dionex AERS500 anion suppressor, 2 mm;
Dionex EGC500 KOH eluent;
Millipore Direct Q-8 Ultrapure water purification system;
Ultrapure water, 18.2 MΩ·cm;
Sodium perchlorate standard, 1 mg/L.
2.2. Chromatographic conditions
Eluent: 45 mM KOH, at the same concentration, automatically generated online by the EGC Eluent
Auto-Generator;
Flow rate: 0.3 mL/min;
Injection volume: 150 μL;
Response signal: 70 mA.
2.3. MS conditions
Spray source temp.: 390 ℃;
Polarity: negative ion mode;
Spray pressure: 20 psi;
Determination of Trace Perchlorate in Drinking Water by Developing Ion Chromatography Coupled with Mass Spectrometry (IC-MS)
267
Probe voltage: -3 kV;
Declustering voltage: -40 V;
Probe temp.: 450
○
C;
Selected Ion Monitoring (SIM) channel: 99, 101, and 107 mass/charge ratio (m/z);
Dwell time: 1 s;
Sampling time: 200 ms;
Run time: 18 min.
3. Results and discussion
3.1. Linear range, precision and detection limit
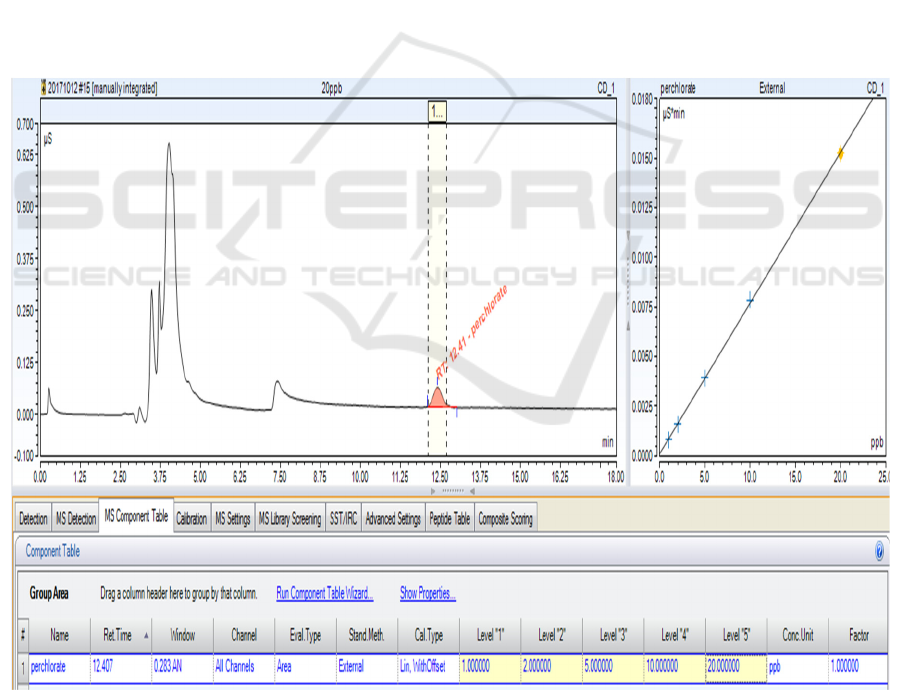
Configure a series of perchlorate standard solutions of 1, 2, 5, 10 and 20 μg/L respectively, inject 150
μL into mass spectrometry and record the peak area of perchlorate. The chromatogram and
calibration curve of perchlorate standard solutions are shown in Figure 1. The results show that the
method displays a good linearity in the range of 1~20 μg/L of perchlorate solutions, the linear
correlation coefficient r = 0.999. Table 1 shows the results from 7 replicate injections of 10 μg/L
perchlorate solution, and the values were calculated from an external standard calibration curve. The
method detection limit (MDL) is determined as 0.47 μg/L and the precision (relative standard
deviation, RSD) is 1.48%.
Figure 1. Chromatogram and calibration curve of perchlorate.
IWEMSE 2018 - International Workshop on Environmental Management, Science and Engineering
268
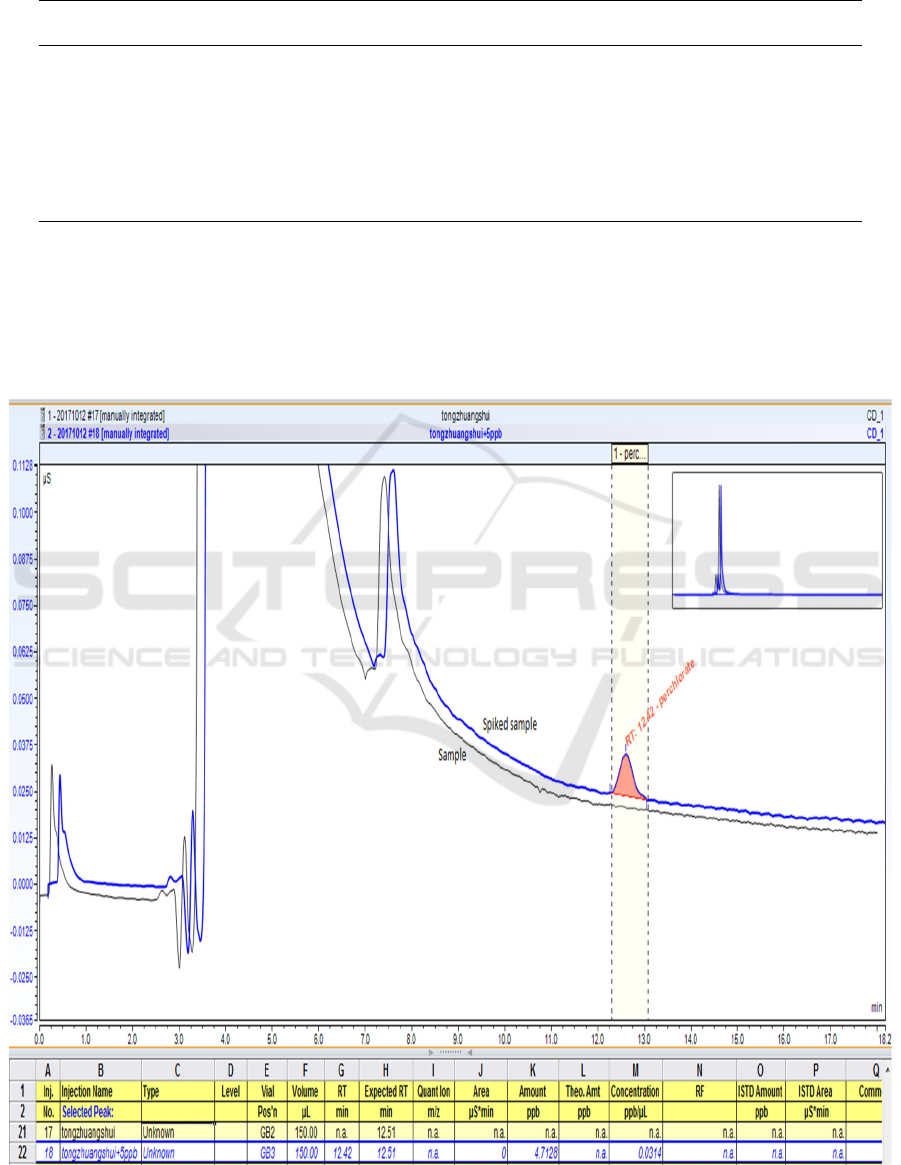
Table 1. MDL calculation using 10 μg/L perchlorate.
Replicate
Amount
(μg/L)
Average
(μg/L)
Standard deviation
(s.d., μg/L)
RSD
(%)
MDL
(3.14 × s.d., μg/L)
1 9.91
10.03 0.15 1.48 0.47
2 9.86
3 10.24
4 10.08
5 10.15
6 9.95
7 10.03
3.2. Sample analysis and spiked sample experiments
Taking tap water and bottled drinking water as samples, the samples were directly filtered through
0.22 μm aqueous membrane filter, and samples were spiked and analyzed respectively, the results are
shown in Figure 2 and Table 2. It can be seen that the recoveries of spiked samples are all in the
range of 92.0% ~ 101.5%, indicating that the method is accurate, stable and reliable.
Figure 2. Chromatogram of sample and spiked sample (bottled drinking water).
Determination of Trace Perchlorate in Drinking Water by Developing Ion Chromatography Coupled with Mass Spectrometry (IC-MS)
269

Table 2. Results of samples and spiked samples.
Samples
Amount
(samples,
μg/L)
Spiked
Amount
(μg/L)
Amount
(spiked samples,
μg/L)
Recoveries
(%)
tap wate
r
N.D. 2.0 1.84 92.0
bottled drinking
wate
r
N.D. 2.0 2.03 101.5
tap wate
r
N.D. 20.0 18.63 93.1
bottled drinking
wate
r
N.D. 20.0 19.54 97.7
tap wate
r
N.D. 50.0 47.27 94.5
bottled drinking
wate
r
N.D. 50.0 50.12 100.2
N.D.: Not be detected
4. Conclusions
In this paper, IC-MS method was developed to detect the trace perchlorate in drinking water, and
demonstrated low MDL, excellent precision and high accuracy which meet the relevant requirements
of GB/T 6379.6-2009 “Accuracy (trueness and precision) of measurement methods and results─Part
6: Use in practice of accuracy values”.
References
[1] Mamie N I, Kate M S and Dennis E R 2005 Reduction of perchlorate and nitrate by microbial
communities in vadose soil J. Appl. Environ. Microbiol. 71(7): 3928-3934
[2] David T, Robert A H, Anna M F and et al 2006 Development of a health-protective drinking
water level for perchlorate J. Environmental Health Perspectives 114(6): 881-886
[3] Alison S W, Evan E C and Elizabeth A E 2004 Perchlorate-reducing microorganisms isolated
from contaminated sites J. Environmental Microbiology 6(5): 517-527
[4] Collette T W, Williams T L, Urbansky E D and et al 2003 Analysis of hydroponic fertilizer
matrixes for perchlorate: comparison of analytical techniques J. Analyst 128(1): 88-97
[5] Jackson W A, Anderson T, Tock R and et al 2003 Final report submitted to Texas Commission
on Environmental Quality
[6] Tonnachera M, Princhera A, Dimida A and et al 2004 Relative Potencies and Additivity of
Perchlorate, Thiocyanate, Nitrate, and Iodide on the Inhibition of Radioactive Iodide
Uptake by the Human Sodium Iodide Symporter J. Thyoid 14: 1012-1019
[7] American Water Works Association (AWWA) 2005 Study of perchlorate occurrence in US J.
Membrane Technology 21(3): 5-6
[8] US Environmental Protection Agency (US EPA) 1998 S. Announcement of the Drinking Water
Contaminant: Candidate List
[9] Wu Q, Zhang T, Sun H W and Kannan K 2010 Perchlorate in tap water, groundwater, surface
waters and bottled water from China and its association with other inorganic anions and
with disinfection byproducts J. Archives of Environment Contamination and Toxicology
58(3): 543-550
[10] Li Q, Yu Y, Wang F and et al 2014 Urinary perchlorate exposure and risk in women of
reproductive age in a fireworks production area of China Arch. Environ. Con. Tox, 67
(2014) 42–49
[11] Gan Z, Sun H, Wang R and Deng Y 2014 Occurrence and exposure evaluation of perchlorate
in outdoor dust and soil in mainland China Sci. Total Environ. 470–471 (2014) 99–106
IWEMSE 2018 - International Workshop on Environmental Management, Science and Engineering
270

[12] Isobe T, Ogawa S P, Sugimoto R, Ramu K and et al 2013 Perchlorate contamination of
groundwater from fireworks manufacturing area in South India Environ. Monit. Assess. 185
(2013) 5627–5637
[13] EPA Method 314.0. Determination of Perchlorate in Drinking Water Using Ion
Chromatography, Rev. 1.0, November 1999, US EPA, Office of Ground Water and
Drinking Water, Publ. 815-B-99-003
[14] Cai Y Q and et al 2006 Perchlorate related environmental problems. Progress in Chemistry
18(11): 1554-1558
Determination of Trace Perchlorate in Drinking Water by Developing Ion Chromatography Coupled with Mass Spectrometry (IC-MS)
271
