
Optimization of Culture Conditions for Chlorella Vulgaris
Using Corresponding Normal Surface and Determination of
Coefficients for Batch Kinetics of Nitrogen Removal Rate
Y Zou, X C Xu
*
, X J Wang, F L Yang and S S Zhang
Dalian University of Technology
Corresponding author and e-mail: X C Xu, xxcep@dlut.edu.cn
Abstract. This study investigated the effects of CO
2
, light intensity, and phosphorus
concentration on rate of NH
4
-N removal by Chlorella vulgaris and determined kinetic
coefficients, such as biokinetic coefficients (k) and reaction rate constant (K
m
), using
Michaelis–Menten rate expression under optimal conditions. By using Box–Behnken design
under conditions of light intensity at 7446 lx, 2% CO
2
content, and phosphorus concentration
at 40 mg/L, the model predicted 38.56% maximum NH
4
-N removal rate. Maximum NH
4
-N
removal rate of 18.7% at light intensity of 11216 lx and CO
2
content of 4.4% was further
tested by using central composite rotatable design. Batch experimental results confirmed
kinetic equations of removal rate by C. vulgarisat optimal conditions and determined kinetic
coefficients of k = 11.49 d
−1
, and K
m
=64.49mg/L.
1. Introduction
Recently, global energy demand drastically increased because of worldwide population growth and
increase in quality of human life. Microalgal are considered as one of the most important sources of
renewable biodiesel, which can meet global demands for transport fuel, because of their high biomass
productivity [1]. Algae also received growing attention given their potential as source for removing
nutrients, such as nitrogen and phosphorus, and are considered as one of the best measures for
reducing pollutants. Different reference variables participate in algal removal of nitrogen and
phosphorus. Light intensity is an important property influencing microalgal growth, controlling
photosynthetic growth in almost all microalgal systems. Light intensity can also affect photosynthesis,
biomass concentration, and CO
2
and nitrogen removal rates [2–4]. Hulatt (2011) [5] researched 4%
CO
2
concentration at different levels of light intensity (10, 20, and 50 Wm
-3
) and showed significant
differences in growth of Chlorella vulgaris and Dunaliella tertiolecta. Light intensity also
participates in shading between microalgal, increasing penetration depth of incident light and
remarkably influencing removal of nitrogen and phosphorus [6–8]. Extremely strong light intensity
can restrain microalgal growth; optimal light intensity for removal of nitrogen and phosphorus
measures 135.3 µmol·m
-2
·s
-1
[9]. As a carbon substrate, CO
2
plays an important role in microalgal
metabolism, participating in formation of microalgal cells while working in synergy with other gases,
including other CO
2
molecules [10]. For algae cultures, an efficient system for removal of nitrogen
and phosphorus must ensure appropriate CO
2
concentration [11]; 5% CO
2
concentration in air is
Zou, Y., Xu, X., Wang, X., Yang, F. and Zhang, S.
Optimization of Culture Conditions for Chlorella Vulgaris Using Corresponding Normal Surface and Determination of Coefficients for Batch Kinetics of Nitrogen Removal Rate.
In Proceedings of the International Workshop on Environmental Management, Science and Engineering (IWEMSE 2018), pages 517-523
ISBN: 978-989-758-344-5
Copyright © 2018 by SCITEPRESS – Science and Technology Publications, Lda. All rights reserved
517

considered the most suitable concentration for organism growth, with maximum biomass dry weight
(DW) of 4.4 g/L [12]. At low concentrations of 1% (v/v) [13–14] and 2% to 3% (v/v), CO
2
is widely
applied in actual wastewater treatment [15]. Further research should then investigate cross-
pollination of factors, such as CO
2
, light intensity, and phosphorus concentration and their effects on
nitrogen and phosphorus removal rate by microalgal. Thus, the present work investigates different
factors influencing conditions of single and multiple effects during nitrogen and phosphorus removal
by microalgal and calculates nitrogen dynamics equations under optimal conditions.
2. Methods
2.1. Microalgal strain and culture condition
C. vulgaris was obtained from microalgal culture collection in Wuhan Botanical Garden, Chinese
Academy of Sciences. Microalgal were then cultured in 5 L photobioreactor composed of transparent
polyvinyl chloride pipe under indoor conditions at 25°C until late-log phase. During cultivation, 3500
lx cool-white fluorescent light illumination and 2% v/v CO
2
content were provided at the top and
bottom of the photobioreactor, respectively. All analytical grade chemicals were procured from
China. All experiments were performed in triplicate.
2.2. Measurement of temperature, light intensity, dissolved oxygen (DO), and pH
Light intensity was recorded by a photometer (GLZ-C, China), and temperature of algal culture was
measured using a thermometer (Brannan, England) at 5 min intervals. Temperature and pH were
monitored daily using a pH meter (WTW, Germany) at 3 pm, at which pH was at its daily peak. DO
concentration was measured using a DO meter (WTW, Germany). Nitrogen and
phosphorusremovalwas evaluated in accordance with the Standard Methods for the Examinations of
Water and Wastewater. Optical density (OD) of algal cells was used to determine OD at 680 nm
(OD680) using a spectrophotometer (UV-1000) as indicator. DW was calculated in Eq. (1):
DW (g/L)=2.6828OD
680nm
+0.0677 (1)
2.3. Experimental design and analysis of response surface through Box–Behnken design (BBD)
In this experiment, using Design Expert software version 8.0.6, BBD was used for statistical analysis
of experimental data based on three factors, namely, CO
2
, phosphorus concentration, and light
intensity, which were selected to evaluate optimum conditions and as indicators. Experimental results
were calculated in Eq. (2):
Y=b
0
+b
1
X
1
+b
2
X
2
+b
3
X
3
+b
12
X
1
X
2
+b
13
X
1
X
3
+b
23
X
2
X
3
+b
11
X
1
2
+b
22
X
2
2
+b
33
X
3
2
(2)
where Y, b
0
, b
1
, b
2
, b
3
, X
1
, X
2
,and X
3
represent the response variable, interception coefficients,
regression coefficients, and independent variables. Responses were analyzed by analysis of variance
(ANOVA), whereas quality of fit of the polynomial model equation was expressed by coefficient of
determination (R
2
). Interaction of independent variables was investigated by constructing response
surface and optimizing the model through exclusion of confidence level of 0.10.
2.4. Experimental design and analysis of response surface through central composite rotatable
design (CCRD)
CCRD is based on two factors, namely, CO
2
and light intensity, which serve as indicators and can
minimize variable limitations and encompass the largest possible design space. Experimentation was
designed as a classic response surface design by a 2
2
full-factorial central composite design. Effects
of CO
2
and light intensity were calculated in Eq. (3).
x
i
= (X
i
- X
0
)/ΔX
i
(3)
IWEMSE 2018 - International Workshop on Environmental Management, Science and Engineering
518

where xi, X
i
, X
0
, and ΔX
i
represent coded value, real value, real value at center point, and step
change value, respectively. Results were analyzed through ANOVA. These variables were selected
based on results of preliminary experimentation. CO
2
concentration and light intensity were used to
prepare 13 experimental formulations.
3. Results and discussion
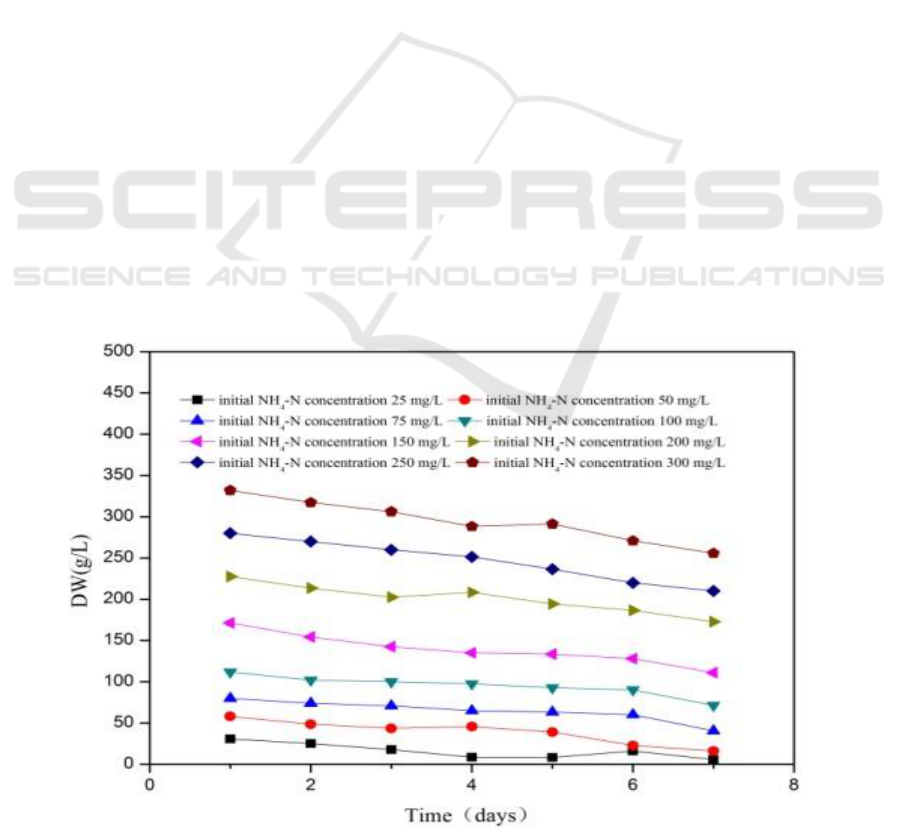
3.1. Effect of initial NH4-N concentration
Figure 1.a depicts the curves of NH
4
-N removal rate at different initial NH
4
-N concentrations for
seven days of batch operation. NH
4
-N was removed above 50% from the media when initial
concentration was below 79.8 mg/L. Increasing initial NH
4
-N concentration resulted in decreased
NH
4
-N removal rate (23.2%) at NH
4
-N concentration of 332 mg/L. These results indicate that
C. vulgaris can effectively decrease NH
4
-N concentrations to below 111 mg/L. Initial substrate
removal rate is calculated in Eq. (4).
(4)
where P
i
, q
0
, and q
t
represent substrate removal rate, initial NH
4
-N concentration, and corresponding
NH
4
-N concentration, respectively at t
t
, which is the time at which biomass DW did not change
significantly. Specific rate of substrate removal (P
bi
) is determined in Eq. (5).
P
bi
= P
i
/DW
0
(5)
As depicted in Figure 1.b, specific rate of substrate removal decreased with increasing initial NH
4
-
N concentration. Maximum and minimum specific removal rates reached 11.21 and 3.65 d
-1
,
respectively, when specific rate of substrate removal and initial NH
4
-N concentration showed a linear
relationship
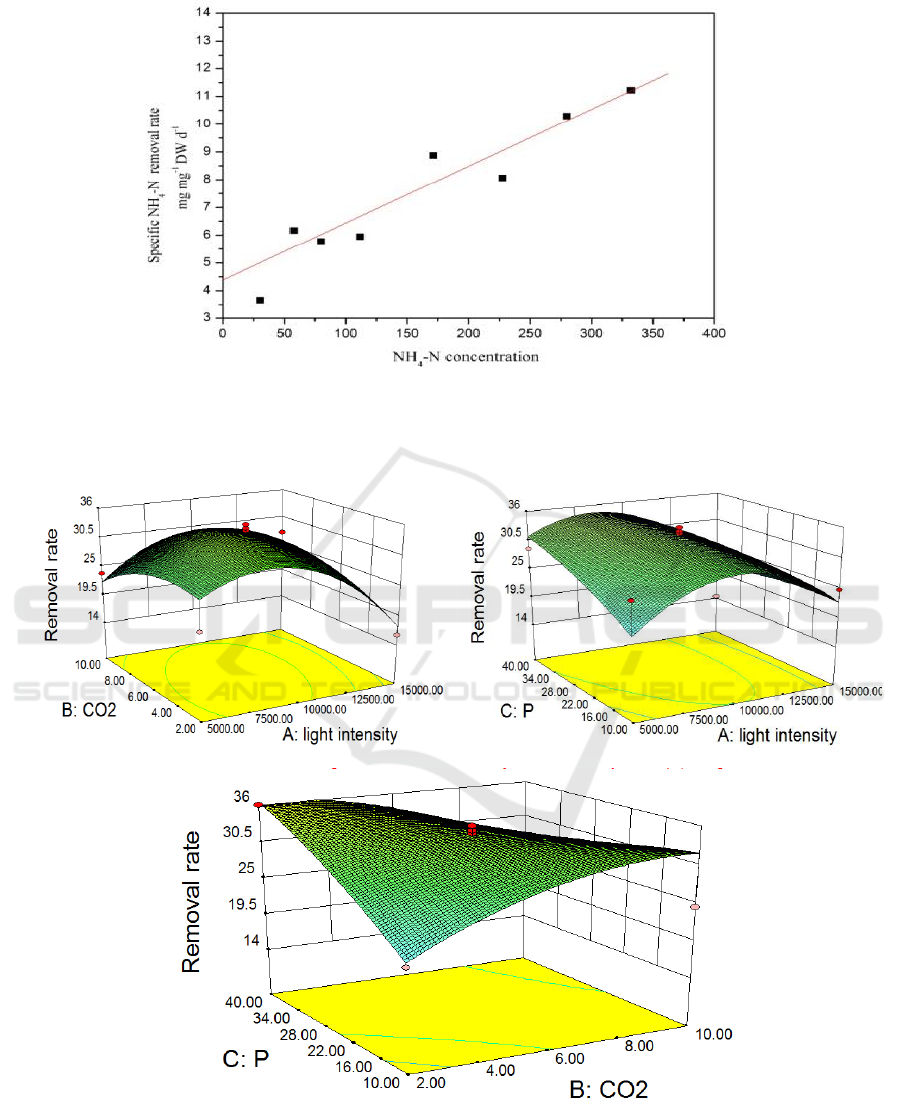
3.2. BBD statistical analysis on effects of CO
2
concentration, light intensity, and phosphorus
concentration on nitrogen removal rate
A BBD experiment was performed using Design-Expert 8.0.6, in which removal rate corresponds to
a specified range for optimal culture condition, to investigate three factors (CO
2
, light intensity, and
phosphorus concentration). As suggested by Statistical Model Fit Summary, a mathematical
regression model was fitted as the best model, as indicated by Eq. (6):
Removal rate = 32.93-2.57 × A−0.40 × B+1.78 × C+2.25 × A × B-2.81 × A × C-5.35 × B × C-7.76×
A
2
-2.79 × B
2
-1.12 × C
2
(6)
ANOVA results showed that among the parameters, light intensity presents the highest F-value of
1.34 and lowest p-value of 0.2854, revealing that this factor more significantly influence NH
4
-N
removal in model diesel. Parameters could not be analyzed independently because of interaction
effects between variables. Figure 2 provides the contour plots of NH
4
-N removal conversion; the
plots indicate interaction effects using a regression equation. When phosphorus concentration
remained unchanged, light intensity and CO
2
showed slightly remarkable interaction effect on the
removal rate of NH
4
-N. When CO
2
concentration decreased (6%), NH
4
-N removal rate increased
with increasing light intensity. When CO
2
concentration increased from 6% to 10%, removal rate and
light intensity increased with direct proportions. The same situation was also noted for light intensity.
NH
4
-N removal rate was inversely and directly proportional to low and high light intensity and CO
2
concentrations, respectively. Raised surfaces were detected at CO
2
concentration ranges and light
intensities of 2% to 4% and 5000–7500 lx and 8% to 10% and 12500–15000 lx, respectively,
indicating that light intensity and CO
2
are essential for photosynthesis. Extremely high or low levels
of these factors can inhibit photosynthesis. Figure 2.b and Figure 2.c respectively show remarkable
Optimization of Culture Conditions for Chlorella Vulgaris Using Corresponding Normal Surface and Determination of Coefficients for
Batch Kinetics of Nitrogen Removal Rate
519
surface changes and interaction gradient between the two factors and unclear effect of phosphorus on
NH
4
-N removal rate. As shown in the figures, phosphorus presented a weaker influence than CO
2
concentration and light intensity, which played an important role on growth of algae but was not
apparent enough to distinguish it from that of strength. The adjusted coefficient of determination
accounted for model significance, which revealed suitability of the equation to describe responses
during experiment. All contour plots demonstrated considerable interaction effects of CO
2
, light
intensity, and phosphorus concentration. Interaction between CO
2
and light intensity was the highest
among the three factors of CO
2
, light intensity and phosphorus concentration.
3.3. Statistical analysis using CCRD on effects of CO2 and light intensity on NH4-N removal rate
As a result of the slight influence of phosphorus on the three factors, another statistical analysis using
CCRD was conducted to identify independent variables that significantly influence NH
4
-N removal
rate between CO
2
concentration and light intensity. Figure 3 displays mutual influences of light
intensity and CO
2
on NH
4
-N removal rate. As shown in the figures, removal rate fitted a second-
order equation, as shown below. Despite the non-statistical significance of terms B
2
and AB at p <
0.05, they were maintained in the model equation to avoid decreasing the value of R
2
, as indicated by
Eq. (7).
Removal rate =17.28+2.75 × A−3.39 × B−1.04 × A × B-4.82 × A
2
−3.38 × B
2
(7)
where A represents CO
2
concentration in air, and B represents light intensity. Some response data are
not available. Possibly, reaction conditions of light intensity at 5000 lx and 6% CO
2
concentration
were too mild to remove NH
4
-N in Run 3, and removal rate was significantly affected by low
CO
2
concentration and high light intensity in wastewater . Graphs demonstrated that at a certain
constant, very slight and moderate influences occur at low light intensities and high light intensity,
respectively. With changing CO
2
concentration in wastewater, removal rate first increased and then
decreased. CO
2
concentration increased from 4.65% to 18% and finally decreased to 10%. After
crossing the saddle point, final DW increased with decreasing CO
2
, and light intensity increased.
Maximum NH
4
-N removal rate was 18.7% at light intensity of 11216 lx and CO
2
concentration of
4.44%. Under these conditions, the model predicted biomass DW of 1.04 g L
-1
d
-1
.
(a)
IWEMSE 2018 - International Workshop on Environmental Management, Science and Engineering
520
(b)
Figure 1. Variation of DW with initial NH4-N concentration (a) and effect of initial NH4-N on
NH4-N removal rate (b).
Figure 2. Response surface and contour plots for removal rate; effects of (a) CO
2
and light
intensity, (b) phosphorus concentration and light intensity, and (c) CO
2
and phosphorus
concentration.
Optimization of Culture Conditions for Chlorella Vulgaris Using Corresponding Normal Surface and Determination of Coefficients for
Batch Kinetics of Nitrogen Removal Rate
521
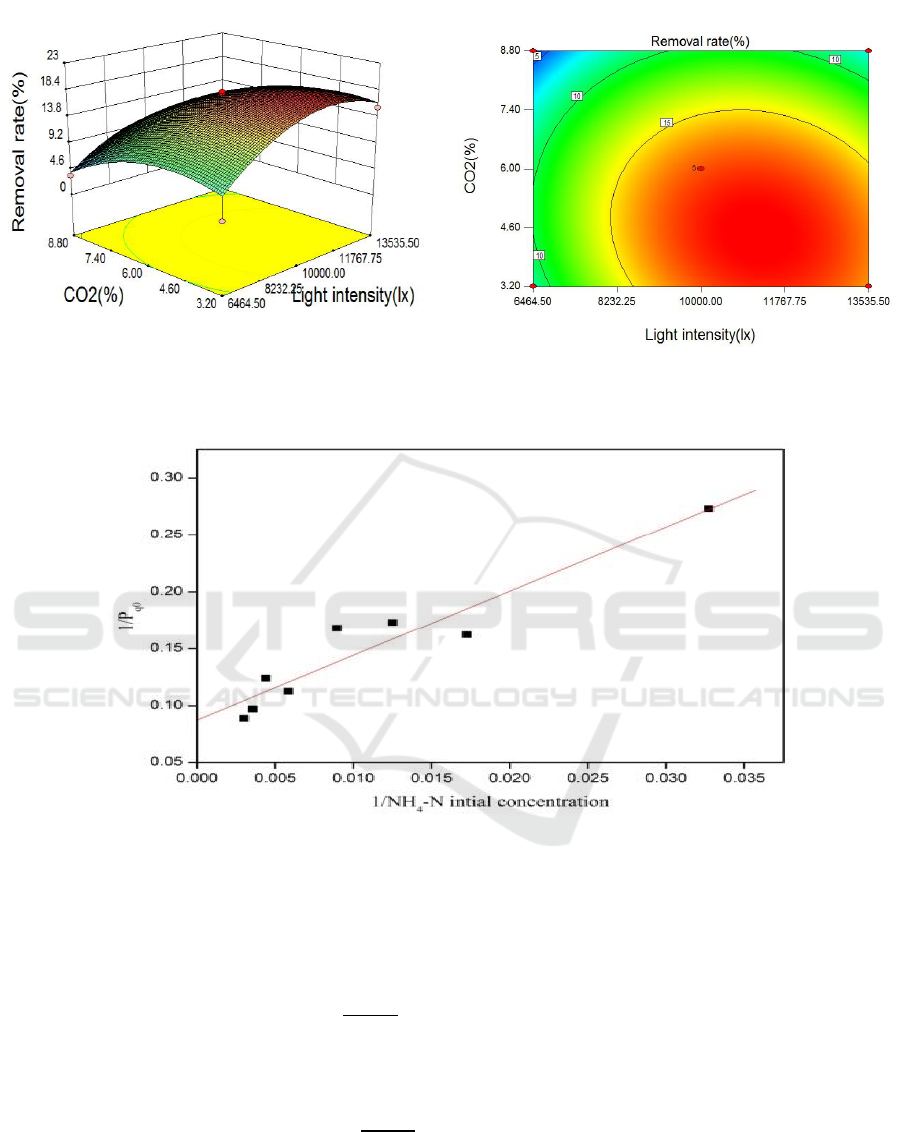
Figure 3. Response surface and contour plots for removal rate on the effects of CO
2
and light
intensity.
Figure 4. Determination of yield coefficient for NH4-N removal by C. vulgaris.
3.4. Determination of batch kinetic coefficients
For the determination of kinetic coefficients, K
m
, saturation constants, k, the Michaelis–Menten
kinetic relationship was used in Eq. (8).
(8)
P
max
and q represent maximum nitrogen removal rate and effluent nitrogen concentration,
respectively. Eq. (8) can be converted into Eq. (9):
(9)
P
max
= k·b
0
corresponds to the maximum initial rate of substrate removal. k and b
0
represent
reaction rate constant (time
−1
) and initial DW of microalgae, respectively. Specific rate of substrate
removal (P
bi
) was determined by dividing the initial rates to DW in Eq. (10):
IWEMSE 2018 - International Workshop on Environmental Management, Science and Engineering
522

(10)
Eq. (10) can then be converted to Eq. (11):
(11)
Figure 4 shows1/P
q0
versus 1/ (NH
4
-N)
0
. Kinetic equation of biomass DW growth rate by
C. vulgaris can be obtained from the slope and intercept of the best-fit line of this episode. Thus,
kinetic coefficient of ammonia nitrogen removal was determined, as shown in Eq. (12). Kinetic
coefficients of NH
4
-N removal by C. vulgaris are as follows: k=11.49 d
−1
and K
m
=64.49mg/L (R
2
=
0.911).
(12)
4. Conclusions
CO
2
concentration, phosphorus concentration, and light intensity play vital roles in NH
4
-N removal
rate, and effects CO
2
and light intensity are more important than those of phosphorus concentration.
This study investigated the cross effects of three factors on removal rate by C. vulgaris in batch
cultivation. Experimental results indicated the optimal conditions for photosynthesis: light intensity
at 7446 lx, 2% (v/v) CO
2
concentration, and phosphorus concentration at 40 mg/L. Based on
experimental data, batch kinetic coefficients of NH
4
-N removal by C.vulgaris were determined as
follows :k = 11.49 d
−1
, and K
m
= 64.94mg/L. This study constitutes an important step in the
development of strategies for rapid cultivation of microalgae using biological approaches. Future
research will be conducted to optimize several other cultural parameters, and fractional factorial
design experiments will be used widely.
Acknowledgement
The authors wish to thank Dr. Xiaojing Wang and for the help on this study. This research did not
receive any specific grant from funding agencies in the public, commercial, or not-for-profit sectors.
References
[1] Ohkawa T, Hiramoto K and Kikugawa K 2001 Biology and Chemistry 6 515
[2] Chittra Y and Benjamas C 2011 Bioresour. Technol. 102 3034.
[3] Raeesossadati M J, Ahmadzadeh H, McHenry M P and Moheimani N R 2014 Algal Research
6 78
[4] Ong S C, Kao C Y, Chiu S Y, Tsai M T, Lin C S, 2010 Bioresour. Technol. 101 2880.
[5] Hulatt C J and Thomas D N 2011 Bioresour. Technol. 102 5775
[6] Solovchenko A E, Khozin-Goldberg I, Didi-Cohen S, Cohen Z, Merzlyak M N 2008 J. Appl
Phycol. 20 245
[7] Levine R B, Costanza-Robinson N S and Spatafora G A 2011 Biomass and Bioenergy 35 40
[8] Posten C 2009 Eng. Life Sci. 3 165
[9] Wu Z, Duangmanee P, Zhao P, Juntawong N and Ma C 2016 Jundishapur J. Microbiol. 9
e26732
[10] Kang J, Wen Z 2015 Algal Research 9 204
[11] Yadav G, Karemore A, Dash S K, Sen R 2015 Bioresour. Technol. 191 399
[12] Kumar K and Das D 2012 Bioresour. Technol. 116 307
[13] An J Y, Sim S J, Lee J S, Kim B W2003 Journal of Applied Phycolog. 15 185
[14] Woertz I, Feffer A, Lundquist T, Nelson Y 2009 J. Environ. Eng. 135 1115
[15] Ruiz-Marin A, Mendoza-Espinosa L G and Stephenson C 2010 Bioresour. Technol. 28 64
Optimization of Culture Conditions for Chlorella Vulgaris Using Corresponding Normal Surface and Determination of Coefficients for
Batch Kinetics of Nitrogen Removal Rate
523
