
Assessment on Nutrients and Fertilities of Soils in Different
Land Use Types within Dazhai Village Watershed in Yunnan
Province, China
X H Guo
1, 2
, Y X He
2
, J J Chen
2
, Y Li
2,
*, Y M He
2
, X H Li
2
and Y Y Hu
2
1
State Key Laboratory of Soil and Sustainable Agriculture, Institute of Soil Science,
Chinese Academy of Sciences, Nanjing 210008, China
2
College of Resources and Environment, Yunnan Agricuitural University, Kunming
650201, China
Corresponding author and e-mail: Y Li, liyuan@ynau.edu.cn
Abstract. Soil nutrient and fertility are two important factors of the recovery of agricultural
production in remote and impoverished area. The study of small watershed of Yiliang County
Dazhai village is carried out by researching on soil fertility of different land use, and
evaluating the soil fertility by comprehensive index. The results showed that the soil in this
area was mainly acidic and weak acid, organic matter, total nitrogen, total phosphorus and
cation exchange capacity was very high. Total potassium, alkali solution nitrogen, available
potassium was in the medium level, while the available phosphorus was in the lower level.
The relationship of soil fertility coefficient in this watershed was that the dry land area (1.32) >
forest land (1.24) > paddy field area (0.96). It means that soil fertility of dry land was the best,
while soil fertility of paddy field was the worst, and soil fertility of forest land was in the
middle level. Based on the soil fertility diagnosis and evaluation of arable land in the South
(NY/T1749-2009), these three different areas were all in the second level. Effective
phosphorus was a key limiting factor.
1. Introduction
As the most important constituent part of agricultural sustainable development, soil is the basis on
which human survival depends on[1-2]. Soil fertility is soil ability of providing nutrients, moisture
and excellent environmental conditions for plant growth. The soil fertility is one of the main factors
for land evaluation [3]. As comprehensive reflection of all kinds of human land use activities, land
use is the most common, direct and profoundest factor influencing soil fertility change[4].
Reasonable land use mode can improve quality of surrounding air and moisture so as to improve soil
structure, enhance soil resistance against external environmental change and improve soil fertility;
however, unreasonable land use mode will result in degraded soil quality and finally cause severe
land degradation [5].
Soil fertility evaluation is an important foundation for sustainable land use and management.
Scientific, reasonable and pragmatic evaluation of soil fertility provides theoretical basis for guiding
agricultural production, land use planning and management[6]. Soil fertility evaluation contents
include selection of evaluation units, determination of evaluation indicators, soil sampling and
524
Guo, X., He, Y., Chen, J., Li, Y., He, Y., Li, X. and Hu, Y.
Assessment on Nutrients and Fertilities of Soils in Different Land Use Types within Dazhai Village Watershed in Yunnan Province, China.
In Proceedings of the International Workshop on Environmental Management, Science and Engineering (IWEMSE 2018), pages 524-538
ISBN: 978-989-758-344-5
Copyright © 2018 by SCITEPRESS – Science and Technology Publications, Lda. All rights reserved

comprehensive evaluation method[7]. Evaluation units consist of a series of factors influencing soil
fertility and are also the basic units for soil fertility evaluation. Determination of evaluation
indicators need to consider soil functions, detect direction, velocity and degree of soil change and
determine improvement or degradation of multiple ecosystems[8-9]. Soil sampling mainly includes
selecting representative soil samples through random sampling method based on statistical principles
and grid sampling method suitable for geographic information system analysis[10]. Comprehensive
evaluation method of soil fertility is the key of evaluation, but there is no unified standard yet, and
there are mainly scoring method and numerical method. Accuracy degree of scoring method is
restricted by professional level of evaluators. Corrected Nemerow formula is mostly used as the main
numerical method and comprehensive evaluation method in recent years. Corrected Nemerow
formula can highlight influence of the poorest factor among soil property factors on soil fertility and
reflect minimum factor law for plant growth in ecology, so it can improve confidence level of
evaluation results[11-12].
Yiliang County, Zhaotong City in Yunnan Province is located in the middle of Zhaotong City
(east longitude 103°51′-104°45′ and north latitude 27°16′-27°57′) and transitional zone from the
Yunnan-Guizhou Plateau to Sichuan Basin, the mountain range belongs to Wumeng Mountain
system, and total mountain area is 2,804.16 square kilometers. At 11:09 on September 7, 2012, 5.7-
magnitude earthquake burst at border between Yiliang County and Weining Yi, Hui and Miao
Autonomous County in Bijie prefecture in Guizhou Province, and focal depth reached 14km; at
12:16, 5.6-magnitude earthquake attacked Yiliang County again and focal depth was about 10km[13].
Yiliang is both a minority area and a poverty-stricken area with few arable lands, so post-earthquake
reconstruction and repair is of vital importance.
Dazhai Village watershed, Luoze River Town, Yiliang County, was selected as study object. Soil
nutrients and fertilities in arid slope cropland, paddy field and forestland in this basin were studied.
Study results can provide fundamental basis for post-earthquake repair.
2. Materials and method
2.1. Study object
Dazhai Village watershed is located in Luoze River Town, Yiliang County, Zhaotong City, total land
area in the small watershed is 1,600 hm2, it belongs to strongly erosive medium alpine and gorge
landform, the general terrain is high in the north and low in the south, the highest elevation is 2,478m
and the lowest elevation is 1,383m. There are mainly three land use modes in this small watershed
namely forest land, arid slope cropland and paddy field, partial arid slope cropland has realized
conceding the land to forestry, and main grain crops in this watershed are corn and rice. Main
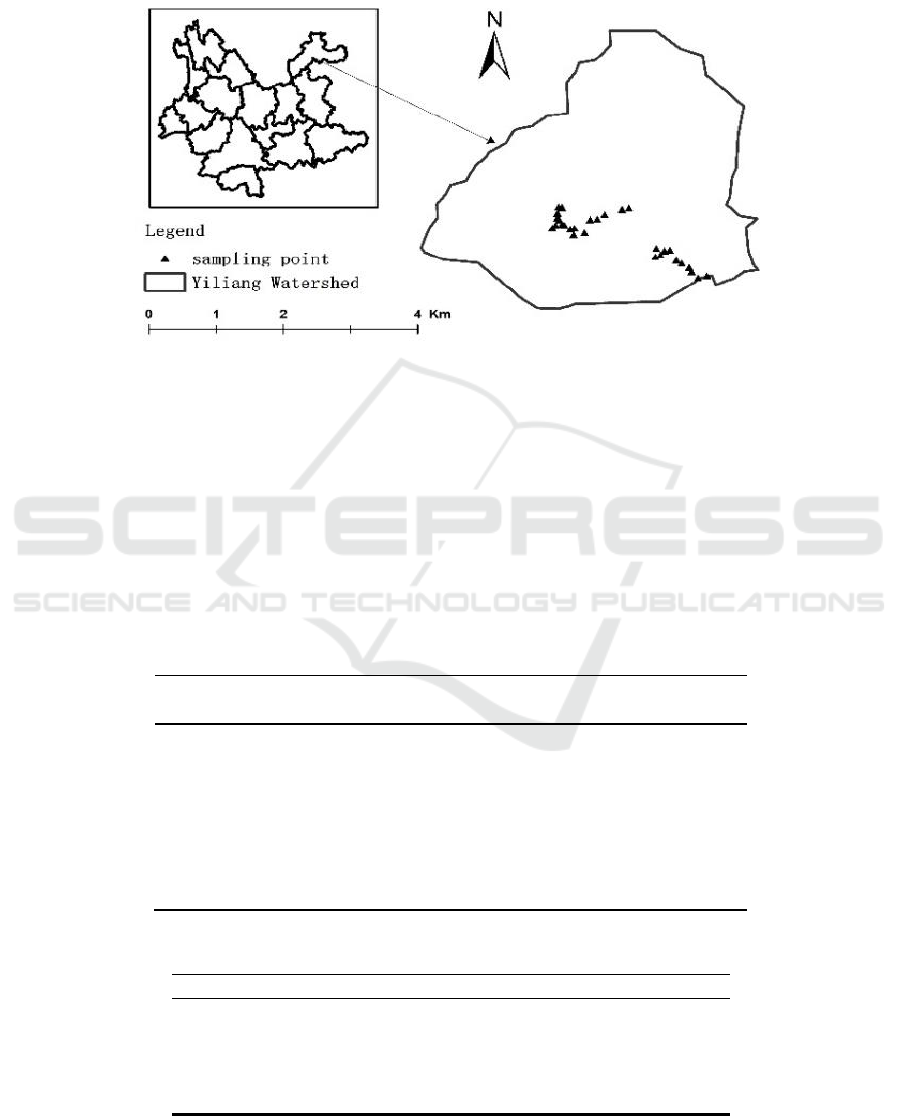
commercial crops are potato, sweet potato, konjac and other vegetables. Sampling points are seen in
the following Figure There are 10 sampling points in forest land, 11 ones in arid slope cropland and 9
ones in paddy field (Figure 1). 0-20cm topsoil was acquired from all sampling points. One
representative sampling point was respectively selected from the three land use types—forest land
(1,507m-2,478m), arid slope cropland (1,498-1,709m) and paddy field (1,495-1,540). Rectangular
soil profile pits were dug, and then profile soils at 0-20cm, 20-40cm and 40-60cm depths were
respectively taken. 10cm×10cm×10cm undisturbed soils were taken using a knife during soil
sampling process.
Determination of soil physical and chemical properties mainly monitored pH, organic matters,
total nitrogen, alkali-hydrolysable nitrogen, total phosphorus, available phosphorus, total potassium,
rapidly available potassium, cation exchangeable capacity and base saturation degree. These
chemical methods are used to analyze these indicators such as pH meter, capacity act, automatic
nitrogen determination instrument, alkaline solution diffusion method, molybdenum anti-colorimetric
method, spectrophotometry and flame photometry. Test data were processed using SigmaPlot 12.5
Assessment on Nutrients and Fertilities of Soils in Different Land Use Types within Dazhai Village Watershed in Yunnan Province, China
525
and Excel2016, SPSS software was used for statistical analysis, mean values and standard deviations
of measured values in the sample plot were calculated, and multiple comparisons and significance
test were conducted for measured values.
Figure 1. The distribution map of samples in the study area in Yunan Province
Indicators and data analysis.
2.2. Evaluation criteria
Fertility degree evaluation was based on Soil Fertility Diagnosis and Evaluation in Arable Land in
South China (NY/T1749-2009), and corrected Nemerow index method was used for evaluation[14].
pH, organic matters, total nitrogen, alkali-hydrolysable nitrogen, total phosphorus, available
phosphorus, total potassium, rapidly available potassium and cation exchangeable capacity were
taken as evaluation factors. As the monitored area contained arid land and paddy field, standard
values of main physical and chemical indicators are seen in Table 1 and 2.
Table 1. Main physical and chemical indicators standard value of S
i.
term
standard value recommended
Dry land
Paddy land
organic matter(g/kg)
12.5
22.5
total nitrogen(g/kg)
1.0
1.2
available phosphorus(mg/kg)
7.5
12.5
rapidly available potassium(mg/kg)
80
100
cation exchangeable capacity(cmol/kg)
12
15
alkali-hydrolysable nitrogen(mg/kg)
105
total phosphorus(g/kg)
0.59
total potassium(g/kg)
16
Table 2. Main physical and chemical indicators standard value of P
i
in
Soil fertility assessment.
term
Individual Fertility Index(P
i
)
pH
P
i
(C
i
/ S
i
)=1.0;
P
i
(C
i
/ S
i
)=1.5; when pH is within 5.0-5.5 or 8.5-9.0;
P
i
(C
i
/ S
i
)=2.0; when pH is within 5.5-6.0 or 8.0-8.5;
P
i
(C
i
/ S
i
)=2.5; when pH is within 6.0-6.5 or 7.5-8.0;
P
i
(C
i
/ S
i
)=1.0; when pH is within 6.5-7.5 (equal 6.5 or 7.5);
IWEMSE 2018 - International Workshop on Environmental Management, Science and Engineering
526

2.3. Soil fertility indexes
Comprehensive index Pcom of soil fertility is computed according to the following formula
√
-
(1)
Where P
com
comprehensive index of soil fertility;
C
i
measured data of the index i in soil;
S
i
evaluation standard value of the index i in soil;
(C
i
/ S
i
)
2
min
square of minimum value of a single fertility index among all soil indexes;
(C
i
/ S
i
)
2
ave
square of mean value of all soil fertility indexes;
Nnumber of indexes participating in soil fertility evaluation.
(note: when a single fertility index satisfied P
i
> 3, this index would be calculated by P
i
=3)
2.4. Soil fertility rating
Comprehensive soil fertility index comprehensively reflects soil fertility level, and soil fertility rating
is graded into I, II and III, specifically seen in the following Table 3.
Table 3. Soil fertility rating.
Grading
Soil fertility
index
Evaluation descriptions
Grade I
P
com
fertilizers, crop yield is high, and marginal effect of yield increase through
fertilizer application is reduced
Grade II
com
< 1. 7
Soil fertility is under general level, indicators may be
deficient, and crop yield increases obviously with increase of fertilizer
application amount.
Grade III
P
com
< 0. 9
deficiency, most fertility indicators are lacked, and some indicators
are severely lacked or inappropriate, and yield increase is significant
through fertilizer application.
3. Results and analysis
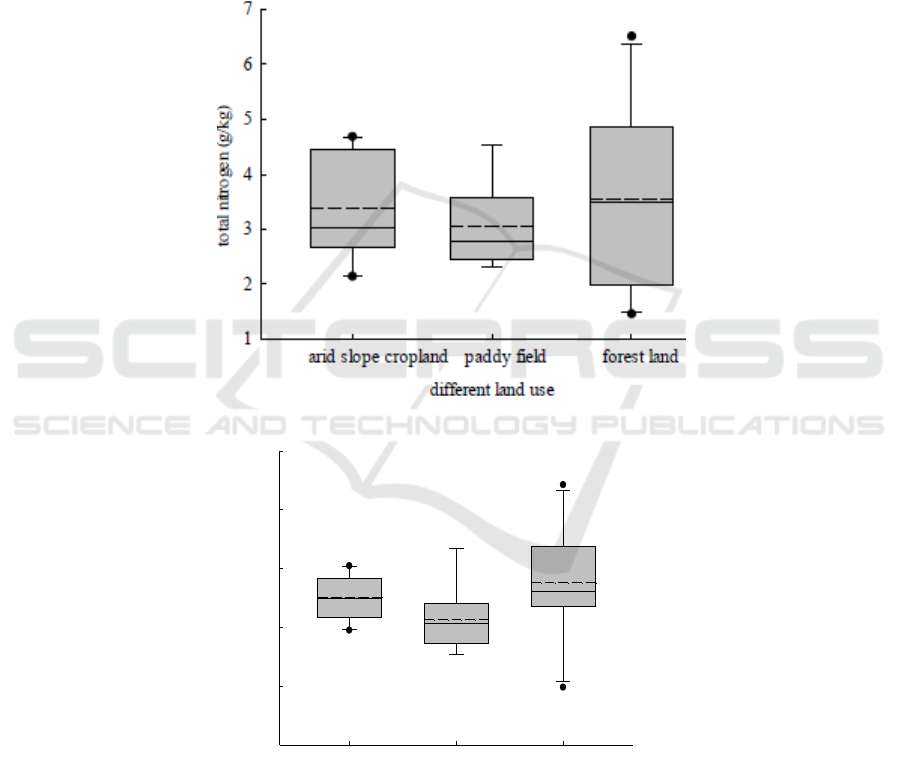
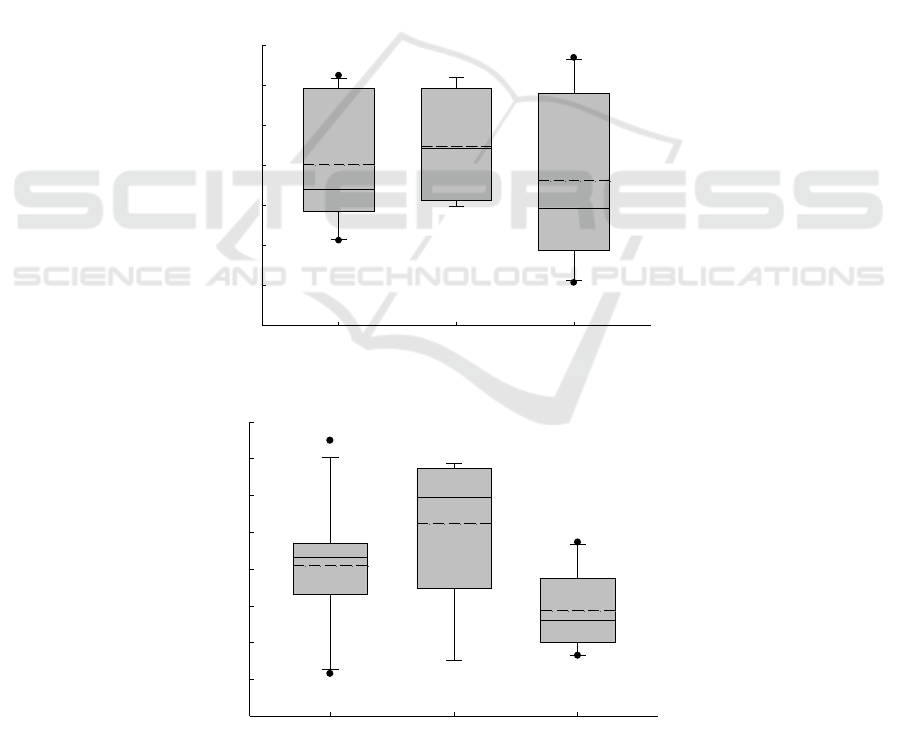
3.1. Total nitrogen and hydrolyzed nitrogen contents in soil
Total nitrogen content in forest land was the highest and mean value reached 3.55g/kg (1.47 -6.52
g/kg), followed by arid slope cropland (3.38 g/kg (2.15 -4.69 g/kg)) and paddy field (3.07 g/kg (2.32
-4.55 g/kg)), and the differences among the three were insignificant. According to nutrient grading
standard in national second soil survey, all of the three reached grade I level. Due to stable plant
population and community system, forest land had high plant species abundance. Influenced by plant
root system, the forest land was of abundant soil nitrogen with great nitrogen supply potential. In
addition, livestock breeding industry existed in this watershed, and cow and sheep manures provided
nutrient sources for forest land soil as fertilizers. However, in arid slope cropland and paddy field
within this watershed, total nitrogen in soil also presented high level because farmers used industrial
chemical fertilizers. Hydrolyzed nitrogen content and total nitrogen content in soil presented
consistent tendencies under different use modes. Hydrolyzed nitrogen content in forest land was the
highest, and the mean values were sorted from high to low as forest land 138.22mg/kg (49.02 -
221.23mg/kg), arid slope cropland 125.96mg/kg (97.51 -152.32 mg/kg) and paddy field (76.97 -
167.43 mg/kg) in succession (Figure 2). The differences among the three were unobvious either.
Forest land and arid slope cropland reached grade II level and paddy field reached grade III level.
Assessment on Nutrients and Fertilities of Soils in Different Land Use Types within Dazhai Village Watershed in Yunnan Province, China
527
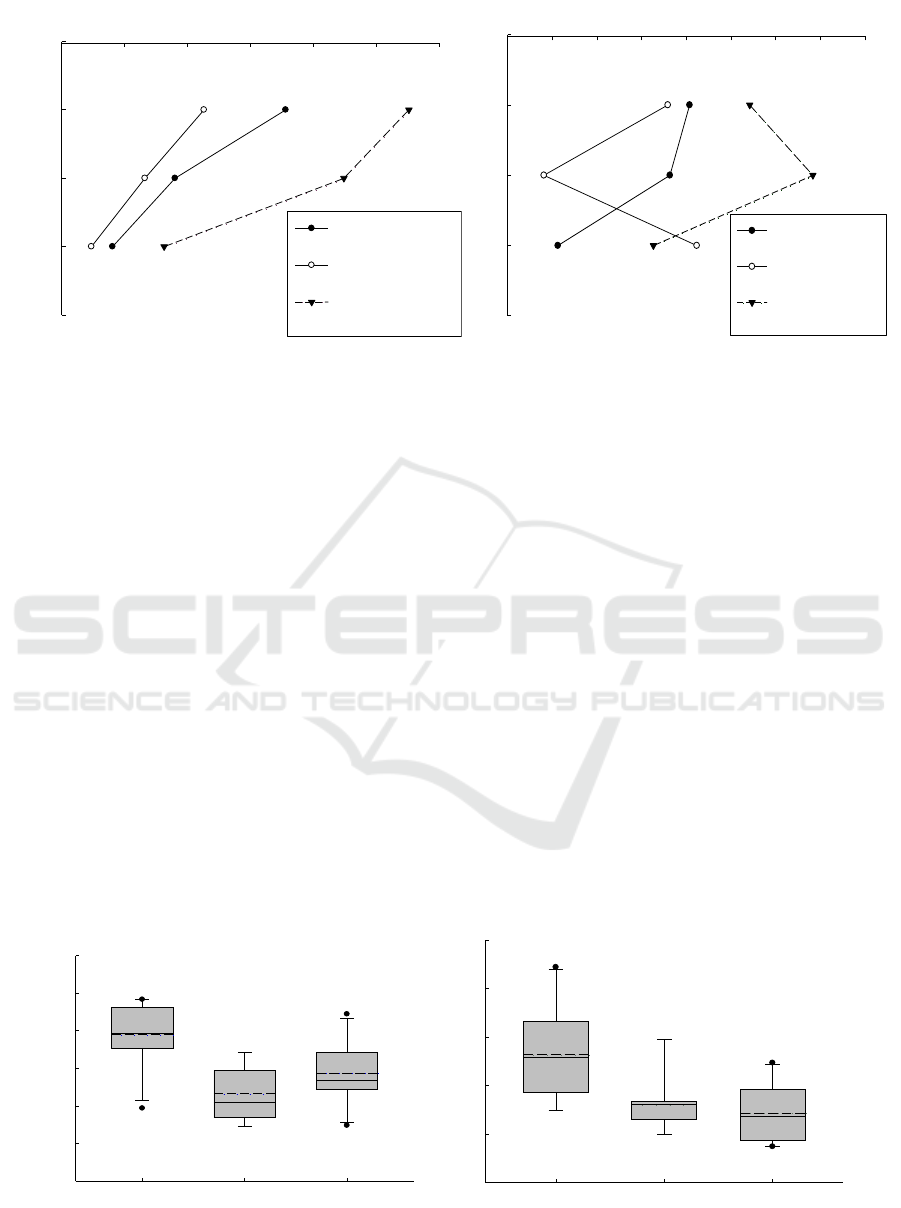
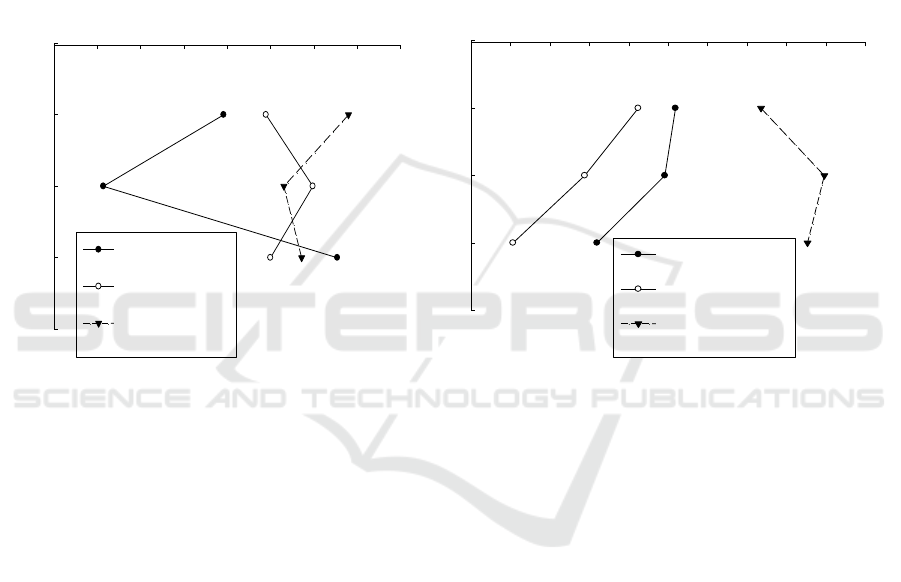
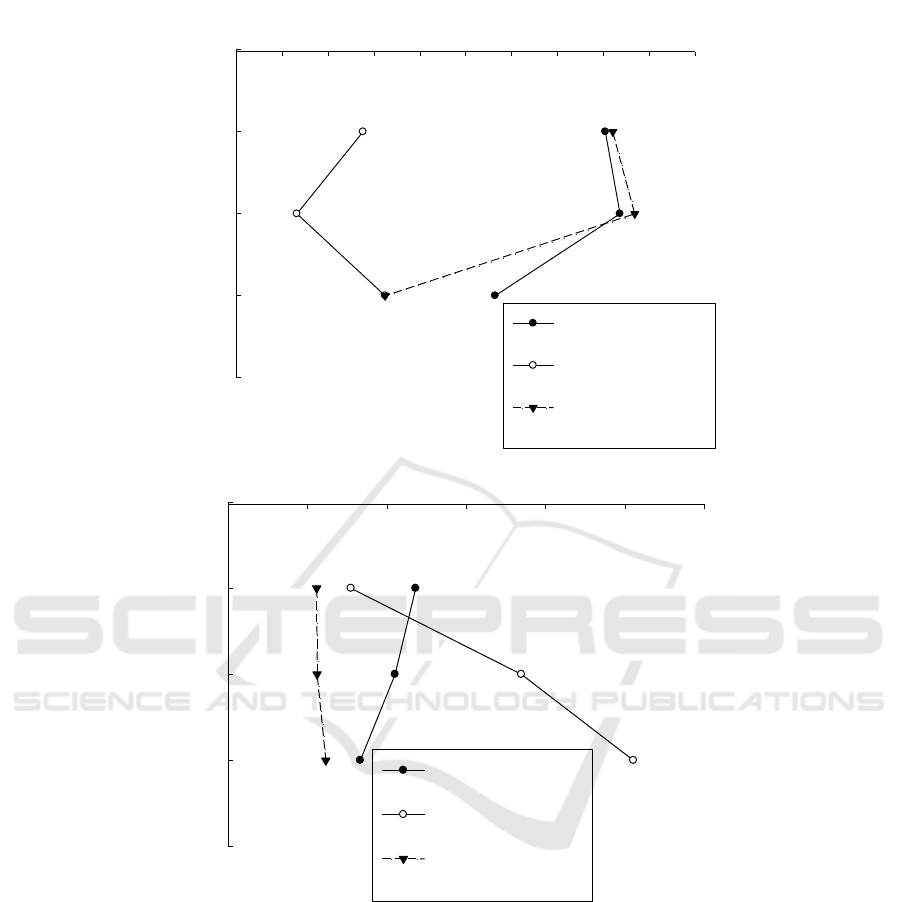
From vertical distribution of total nitrogen (Figure 3), total nitrogen contents in arid slope
cropland, paddy field and forest land reduced with increase of soil depth. However, from vertical
distribution of hydrolyzed nitrogen, hydrolyzed nitrogen in arid slope cropland reduced with increase
of soil depth, that in forest lad reached the highest at 20-40cm soil layer, and that in paddy field
reached the highest at 40-60cm soil layer while presenting a low level at 20-40cm soil layer.
Correlation analysis indicated that: total nitrogen had extremely significant positive correlation
with hydrolyzed nitrogen with correlation coefficient being 0.560 (p < 0.01), indicating that soil total
nitrogen content under three different land use modes affected hydrolyzed nitrogen content to a
certain degree, and hydrolyzed nitrogen content needed by plant growth relied on total nitrogen
content.
different land use
arid slope cropland paddy field forest land
alkali-hydrolysable nitrogen (mg/kg)
0
50
100
150
200
250
Figure 2. Total nitrogen and alkali-hydrolysable nitrogen in the soil (0-20cm soil layer).
IWEMSE 2018 - International Workshop on Environmental Management, Science and Engineering
528
total nitrogen(g/kg)
1 2 3 4 5 6 7
soil depth(cm)
10
30
50
arid slope cropland
paddy field
forest land
alkali-hydrolysable nitrogen(mg/kg)
60 80 100 120 140 160 180 200 220
soil depth(cm)
10
30
50
arid slope cropland
paddy field
forest land
Figure 3. The characteristics of total nitrogen and alkali-hydrolysable nitrogen in the soil.
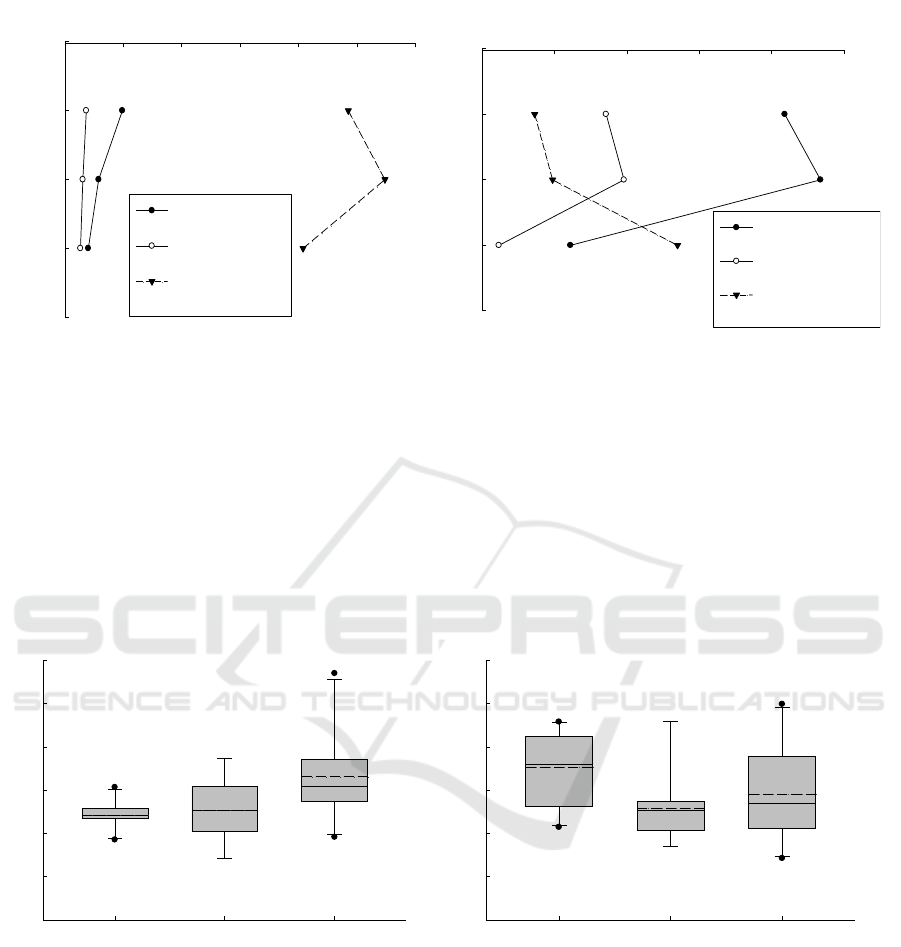
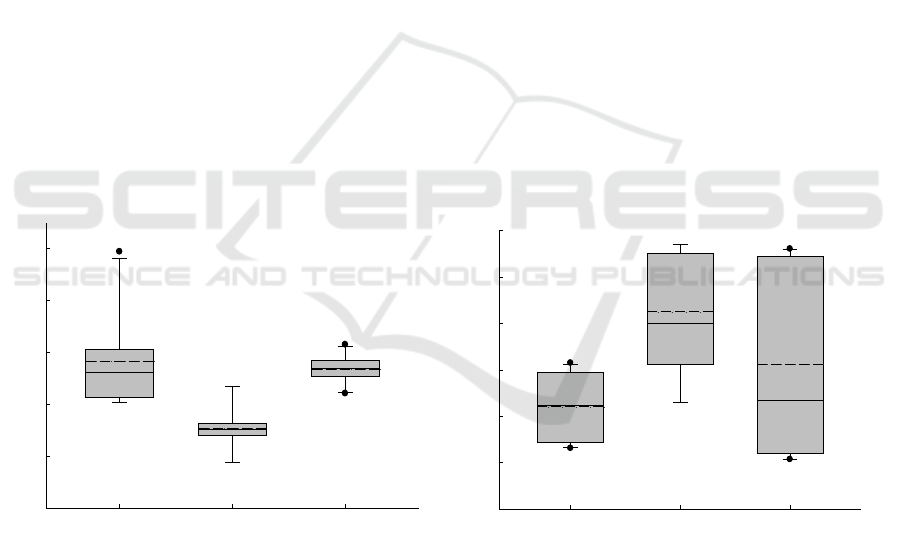
3.2. Soil total phosphorus and available phosphorus contents
Total phosphorus content in arid slope cropland was the highest, being 1.95g/kg (0.97-2.42 g/kg).
Total phosphorus in the small watershed presented high levels, total phosphorus in forest land was
1.44 (0.74-2.22 g/kg) which was slightly higher than that (1.66, (0.73-1.71 g/kg)) in paddy field, and
the two didn’t present obvious difference. According to nutrient grading standard in national second
soil survey, all of the three reached grade I level. Available phosphorus content in this watershed was
the highest in arid slope cropland, being 5.27mg/kg (2.96-8.88 mg/kg), followed by that in paddy
field namely 3.21 mg/kg (1.97-5.92 mg/kg) which was slightly higher than that 2.86 mg/kg (1.48-
4.93 mg/kg) in forest land, and the two didn’t present significant difference (Figure 4). Arid slope
cropland, paddy field and forest land respectively reached grade IV, V and VI levels. On the whole,
available phosphorus content in this watershed was low, and local farmers scarcely used phosphate
fertilizers, and consequently, available phosphorus content in soil within this watershed was under
low level for a long term.
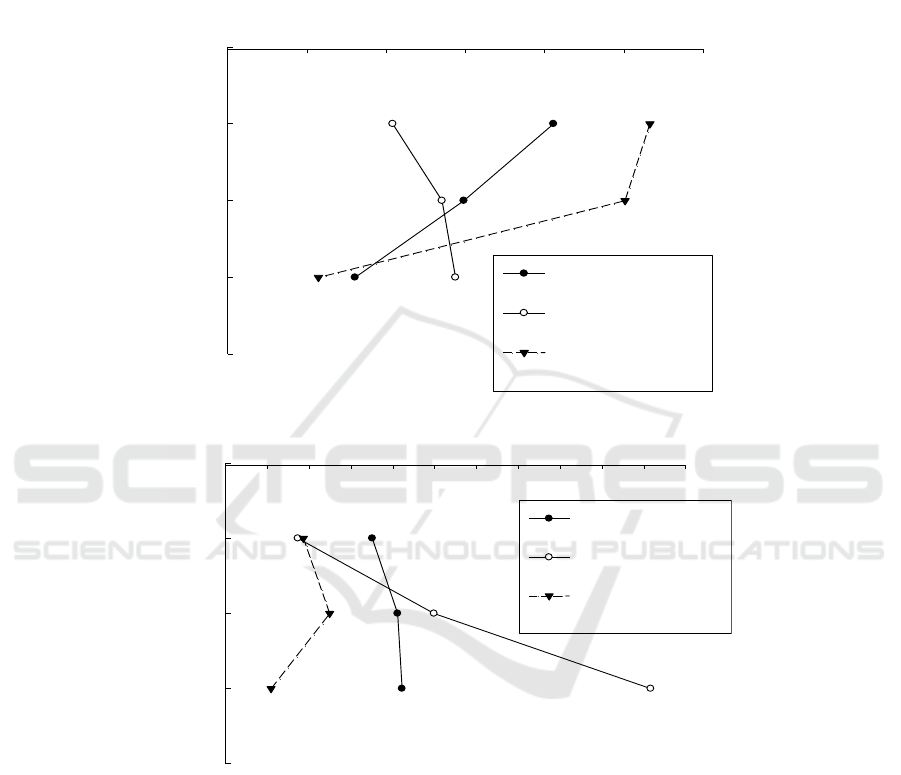
From vertical distribution of total phosphorus, total phosphorus in arid slope cropland and paddy
field both reduced with increase of soil depth, and that in forest land presented the highest level at
20-40cm soil layer (Figure 5). Vertical distribution law of available phosphorus was obviously
different from that of total phosphorus. Available phosphorus in three land use types presented rising
trends at 0-20cm to 20-40cm soil layers. At 40-60cm soil layer, available phosphorus contents in
paddy field and arid slope cropland reduced to the lowest level while that in forest land presented the
highest level.
different land use
arid slope cropland paddy field forest land
total phosphorus(g/kg)
0.0
.5
1.0
1.5
2.0
2.5
3.0
different land use
arid slope cropland paddy field forest land
available phosphorus(mg/kg)
0
2
4
6
8
10
Figure 4. Total phosphorus and available phosphorus in the soil (0-20cm soil layer).
Assessment on Nutrients and Fertilities of Soils in Different Land Use Types within Dazhai Village Watershed in Yunnan Province, China
529
total phosphorus(g/kg)
0 2 4 6 8 10 12
soil depth(cm)
10
30
50
arid slope cropland
paddy field
forest land
available phosphorus(mg/kg)
1 2 3 4 5 6
soil depth(cm)
10
30
50
arid slope cropland
paddy field
forest land
Figure 5. The characteristics of total phosphorus and available phosphorus in different soil layers.
Correlation analysis showed that: total phosphorus and available phosphorus presented significant
positive correlation and correlation coefficient was 0.367 (p < 0.05), indicating that soil total
phosphorus contents under three land use modes affected available phosphorus content to a certain
degree. Available phosphorus content needed by plant growth depended on total phosphorus content.
Local soil total phosphorus content was extremely high while available phosphorus content was low,
indicating that available phosphorus content needed increasing by man-made means so as to facilitate
better crop growth.
3.3. Soil total potassium and available potassium contents
different land use
arid slope cropland paddy field forest land
total potassium(g/kg)
0
5
10
15
20
25
30
different land use
arid slope cropland paddy field forest land
rapidly available potassium(mg/kg)
0
50
100
150
200
250
300
Figure 6. Total potassium and available potassium in the soil (0-20cm soil layer).
The highest mean value of total potassium content in forest land was 16.55g/kg (9.57-28.51 g/kg),
and that in paddy field was 12.72 (7.10-18.73 g/kg) which was slightly higher than that (12.14 (9.26-
15.34 g/kg)) in arid slope cropland and the two didn’t have significant difference. According to
nutrient grading standard in national second soil survey, forest land reached grade III level while
paddy field and arid slope cropland reached grade IV level. Potassium element returned to soil in
forest land mainly in the form of dry branches and fallen leaves so as to present high total potassium
content. Available potassium content was the highest in arid slope cropland and the mean value was
176.94mg/kg (107.14-228.99 mg/kg), and that in forest land was 145.59 mg/kg (71.17-249.49 mg/kg)
IWEMSE 2018 - International Workshop on Environmental Management, Science and Engineering
530
which was slightly higher than that in paddy field (129.54 mg/kg (85.10-230.15 mg/kg)) (Figure 6)
and the two didn’t present significant difference. Arid slope cropland reached grade II level while
forest land and paddy field reached grade III level, which was mainly related to local use of
potassium fertilizers, and arid slope cropland had favorable fertility conditions.
From vertical distribution of total potassium, total potassium contents in forest land and paddy
field didn’t change obviously with increase of soil depth, and total potassium in arid slope cropland
presented the highest level at 40-60cm soil layer and the lowest level at 20-40cm soil layer (Figure 7).
Overall trends of rapidly available potassium contents in three land use types were approximate.
Rapidly available potassium contents in arid slope cropland and paddy field both reduced with
increase of soil depth. Rapidly available potassium content in forest land was the lowest at 0-20cm
soil layer and then presented firstly increasing and then decreasing trend.
total potassium(g/kg)
4 6 8 10 12 14 16 18 20
soil depth(cm)
10
30
50
arid slope cropland
paddy field
forest land
rapidly available potassium(mg/kg)
60 80 100 120 140 160 180 200 220 240 260
soil depth (cm)
10
30
50
arid slope cropland
paddy field
forest land
Figure 7. The characteristics of potassium and available potassium in different soil layers.
Correlation analysis indicated that: correlation between total potassium and rapidly available
potassium was insignificant, verifying that available potassium content needed by plants was not
completely affected by total potassium content.
3.4. Soil pH (H
2
O/kcl) value
Distribution trends of pH(H2O) and pH(kcl) were consistent. Because soil in paddy field was
immersed in water for a long time, which exerted certain diluting effect on soil pH, pH value in
paddy field was the highest with 5.68 pHH2O (4.47-7.53) and 4.54 pHkcl (3.66-5.21) and it’s weak-
acid soil. pH in arid slope cropland was the lowest with 4.66 pHH2O (4.10-5.88) and 3.69 pHkcl
(1.17-4.95), so it’s acid soil. Thus, difference between paddy field and arid slope cropland was
obvious, but forest land was insignificantly different from paddy field and arid slope cropland,
namely it’s at intermediate level with 5.20 pHH2O (4.45-6.66) and 3.92 pHkcl (1.06-5.44), so it’s
acid soil. Soil pH value in the whole watershed was low, because soil in this watershed was mainly
yellow soil, it belonged to moderate weathering intensity leaching, and exchangeable Al3+ was
water-soluble active acid which had great toxic effect on plants[15].
In terms of vertical distribution of pH, pH H2O and pHkcl also presented consistency. pH value in
arid slope cropland increased with increase of soil depth, that in paddy field presented firstly
increasing and then decreasing trend, and the difference in forest land was unobvious
Correlation analysis indicated that: pH H2O and pHkcl presented extremely significant positive
correlation and correlation coefficient was 0.489 (p < 0.01).
Assessment on Nutrients and Fertilities of Soils in Different Land Use Types within Dazhai Village Watershed in Yunnan Province, China
531
3.5. Organic matters and carbon/nitrogen ratio
Organic matters within this watershed presented extremely high levels, paddy field had the highest
organic matter content (89.64g/kg (59.55-123.91 g/kg)) while forest land had the lowest organic
matter content (72.45g/kg (21.45-133.66 g/kg)). Arid slope cropland had intermediate organic matter
content (80.54 g/kg (42.50-124.75 g/kg)), and the differences among the three were insignificant
(Figure 8). According to nutrient grading standard in national second soil survey, all of the three
reached grade I level, mainly because this region was of high altitude, low mean temperature
throughout the year and great humidity, and then organic matters were accumulated at high level.
Distribution trend of carbon/nitrogen ratio was consistent with that of organic matters. Mean value of
carbon/nitrogen ratio was the highest in paddy field being 14.49 mg/kg (7.01-17.74 mg/kg) and the
lowest in forest land being 9.76 mg/kg (7.30-13.46 mg/kg), and arid slope cropland had intermediate
mean value of carbon/nitrogen ratio being 12.20 mg/kg (6.31-19.00 mg/kg). There were many factors
influencing carbon/nitrogen ratio, including structural factors like soil parent material, terrain factor
and soil type; random factors like all kinds of human activities such as fertilization, farming measures
and cropping system, etc. As paddy field was under drowned and low-temperature state, organic
matters were degraded slowly with easy accumulation so that soil carbon/nitrogen ratio in paddy field
was under relatively high level
different land use
arid slope cropland paddy field forest land
organic matters(g/kg)
0
20
40
60
80
100
120
140
different land use
arid slope cropland paddy field forest land
C / N
4
6
8
10
12
14
16
18
20
Figure 8. Organic matter and C / N ratio in the soil (0-20 cm soil layer).
IWEMSE 2018 - International Workshop on Environmental Management, Science and Engineering
532
Vertical distribution of organic matters in arid slope cropland was consistent with that in forest
land, presenting decreasing trend with increase of soil depth, but that in paddy field presented the
contrary trend, namely increasing with increase of soil depth. In a similar way, carbon/nitrogen ratio
in arid slope cropland was approximate to that in forest land, namely presenting small change
amplitude with increase of soil depth. However, carbon/nitrogen ratio in paddy field presented
obvious increasing trend with increase of soil depth (Figure 9).
organic matters(g/kg)
20 40 60 80 100 120 140
soil depth (cm)
10
30
50
arid slope cropland
paddy field
forest land
C / N
6 8 10 12 14 16 18 20 22 24 26 28
soil depth(cm)
10
30
50
arid slope cropland
paddy field
forest land
Figure 9. The characteristics of organic matter and C / N ratio in different soil layers.
Correlation analysis indicated that: organic matters presented extremely significant positive
correlation with total nitrogen and correlation coefficient was 0.690 (p < 0.01). As most nitrogen
elements in soil were under organic binding form and nitrogen content in organic matters was
relatively fixed, then the two presented extremely significant positive correlation. It could be
obtained from correlation analysis among organic matters, total nitrogen and carbon/nitrogen ratio
that organic matters in this watershed presented extremely significant positive correlation with
carbon-nitrogen ratio and correlation coefficient was 0.634 (p < 0.01), but total nitrogen and
carbon/nitrogen ratio didn’t have significant correlation.
Assessment on Nutrients and Fertilities of Soils in Different Land Use Types within Dazhai Village Watershed in Yunnan Province, China
533
3.6. Cation exchangeable capacity, base composition and base saturation degree
Cation exchangeable capacity (CEC) in arid slope cropland was the maximum and its mean value
was 48.35cmol/kg (40.32-69.44 cmol/kg), that in forest land was close to that in arid slope cropland
being 46.83cmol/kg (42.08-51.52 cmol/kg), and the two didn’t have significant difference. CEC was
the lowest in paddy field, being 35.41 cmol/kg (28.80-43.52 cmol/kg) as seen in Figure 10.
According to nutrient grading standard in national second soil survey, all of the three reached grade I
level. Base saturation degree results indicated that base saturation degree in paddy field was the
highest being 65.19% (26.15-94.17%); that in arid slope cropland was the lowest being 24.82%
(6.30-43.07%); that in forest land was at intermediate level being 42.60% (1.48-92.23%). The latter
two were base unsaturated soils which could be improved using modifying agents like limestone.
From vertical distribution of CEC, arid slope cropland had consistent trend with forest land,
namely CEC presented firstly increasing and then decreasing trend, and CEC in paddy field
presented firstly decreasing and then increasing trend (Figure 11). Base saturation degree in forest
land increased with increase of soil depth but change amplitude was not great; base saturation degree
in arid slope cropland decreased with increase of soil depth; base saturation degree in paddy field
presented significant increasing trend with increase of soil depth.
According to correlation analysis, CEC presented significant negative correlation with base
saturation degree and correlation coefficient was -0.429 (p < 0.05); exchangeable Ca
2
+ and Mg
2
+
presented extremely significant positive correlations and correlation coefficients were 0.957 (p < 0.01)
and 0.732 (p < 0.01) respectively, but CEC had no significant correlation with K+ Na+. As for
contributions of exchangeable base ions and base saturation degrees in soil within this watershed, the
contribution of Ca2+ was the greatest, followed by Mg2+, K+ and Na+ in succession. This was
identical with descriptions in related literatures [16].
different land use
arid slope cropland paddy field forest land
cec(cmol/kg)
20
30
40
50
60
70
different land use
arid slope cropland paddy field forest land
salt saturation
-20
0
20
40
60
80
100
Figure 10. CEC and salt saturation in the soil (0-20 cm soil layer).
IWEMSE 2018 - International Workshop on Environmental Management, Science and Engineering
534
cec(cmol/kg)
30 32 34 36 38 40 42 44 46 48 50
soil depth(cm)
10
30
50
arid slope cropland
paddy field
forest land
CEC
30 40 50 60 70 80 90
soil depth(cm)
10
30
50
arid slope cropland
paddy field
forest land
Figure 11. The characteristics of CEC and salt saturation in different soil layers.
3.7. Comprehensive evaluation of soil fertility
Soil fertility indexes in arid slope cropland, paddy field and forest land in the study area were
calculated. Generally speaking, comprehensive fertility index in arid slope cropland was the largest
while that in paddy field was the smallest. Comprehensive fertility index in arid slope cropland was
1.375 times of that in paddy field and 1.06 times of that in forest land, and that in forest land was
1.29 times of that in paddy field, so the following sorting was satisfied: arid slope cropland (1.32) >
forest land (1.24) > paddy field (0.96). This indicated that fertility in arid slope cropland was the
optimal and that in paddy field was the poorest, and that in forest land was intermediate. All of the
three were at grade II level, so it’s okay for soil fertility to be at a general level, and individual
indicators might show deficiency. Crop yield increased obviously with fertilization amount. The
indicator-available phosphorus—was under obvious deficient state. Results are seen in Table 4.
Assessment on Nutrients and Fertilities of Soils in Different Land Use Types within Dazhai Village Watershed in Yunnan Province, China
535

Table 4. The comprehensive evaluation of soil fertility.
land use
type
p
i
P
com
Grading
pH
(H
2
O)
organic
matters
total
nitrogen
total
phosphorus
total
potassium
alkali-
hydrolysable
nitrogen
available
phosphorus
available
potassium
CEC
arid
slope
cropland
1.00
6.44
3.38
3.31
0.76
1.20
0.70
2.21
4.03
1.32
Grade
II
paddy
field
2.00
3.98
2.56
1.97
0.80
1.02
0.26
1.30
2.34
0.96
Grade
II
forest
land
1.50
5.80
3.55
2.44
1.03
1.32
0.38
1.82
3.90
1.24
Grade
II
4. Discussion
Soil within this watershed is mainly yellow soil which is rich in hydrated iron oxide (goethite) and
formed under subtropical humid climate. Relevant physical and chemical indicator results basically
conform to essential features of the soil in yellow soil region. On the whole, soil pH in this watershed
presents faintly acid and acid with high contents of organic matters, total nitrogen, total phosphorus
and CEC, all reaching national grade I level. Total potassium, alkali-hydrolysable nitrogen and
rapidly available potassium are at intermediate level. Content of rapidly available phosphorus is
under medium and low level. Fertility indexes in forest land are approximate to those in arid slope
cropland, while paddy field presents low fertility indexes. Generally speaking, soil nutrients will
reduce with increase of man-made interference degree under different land use modes [17]. Bearing
relatively small influence from human activities, forest land keeps natural or semi-natural state, so it
can reflect natural state of soil within the watershed. Much influenced by human activities, a rid slope
cropland and paddy field have input many nutrients into soil, like application of chemical fertilizers
and organic fertilizers, and meanwhile, their outputs are large. Nutrients absorbed from soil will be
brought away after the crops are harvested[18]. Immersed in water for a long time with a certain
hydraulic settlement effect, nutrients in paddy field soil are at a low level compared with arid land.
On the whole, soil nutrients among the three present approximate change trends with depth at 20-
40cm and 40-60cm soil layers, and soil nutrients present approximate change trends with depth
between forest land and arid slope cropland at 20-40cm and 40-60cm soil layers. This certifies that
local human cultivation activities have changed vertical distribution of soil nutrients to a certain
degree.
Available phosphorus within this watershed becomes a key restrictive factor of soil
comprehensive index. Total phosphorus content in this region is high and reaches grade I level, but
total phosphorus content can’t decide available phosphorus, so input of phosphorus fertilizer should
be enlarged into soil in this region. Meanwhile, in consideration of acid soil condition in this
watershed, soil in this watershed can be improved by using organic fertilizers, calcined lime, humic
acid and other soil conditioners so that the soil in this watershed is more suitable for crop growth and
yield increase[19]. Based on base saturation degree analysis with high correlation with pH, it can be
found that within this watershed, base saturation degree presents high peak value (being about 90%)
when pH is about 6. Afterwards, it presents descending trend, and relevant studies indicate that pH
and base saturation degree present quadratic functional relation[16]. Because base saturation degree
can’t realize unlimited growth, and instead it has an upper limit, base saturation degree in soil is
generally high when pH is close to 6 within Dazhai Village watershed. pH can be considered as an
indicator so as to rapidly predict fertilizer maintenance effect of soil.
IWEMSE 2018 - International Workshop on Environmental Management, Science and Engineering
536

5. Conclusions
1) Soil fertility indexes in arid slope cropland and paddy field within this watershed present
consistent change trends with soil depth at 0-20cm and 20-40cm soil layers. Change trends of
soil nutrients with soil depth are approximate between forest land and arid slope cropland at
20-40cm and 40-60cm soil layers.
2) Contents of organic matters, total nitrogen and CEC are high in this region, all reaching
national grade I level. Total potassium, alkali-hydrolysable nitrogen and rapidly available
potassium are at intermediate level. Available phosphorus content is partially low, being at
medium and low level.
3) Nemerow index is used to calculate soil comprehensive fertility coefficients P
com
in all land
use types, and they are sorted as: arid slope cropland (1.32) > forest land (1.24) > paddy field
(0.96), indicating that fertility in arid slope cropland is optimal, that in paddy field is the
poorest and that in forest land is intermediate. All of three are at grade II level.
Comprehensive fertility index in arid slope cropland is the greatest while that in paddy field
is the smallest. Comprehensive fertility index in arid slope cropland is 1.375 times of that in
paddy field and 1.06 times of that in forest land, and that in forest land is 1.29 times of that in
paddy field.
Acknowledgement
The work was financially supported by the National Natural Science Foundation of China (Nos.
41461117, 41565010 and 41663011) and Research Fund of State Key Laboratory of Soil and
Sustainable Agriculture, Nanjing Institute of Soil Science, Chinese Academy of Science
(Y412201411).
References
[1] Nambiar K K M, Gupta A P, Fu Q and et al 2001 Biophysical, chemical and socil-economic
indicators for assessing agricultural sustainability in the Chinese coastal zone agriculture.
Ecosystem& Environment vol 87 p 209-214
[2] Bouma J 2002 Land quality indicators of sustainable land management across scales.
Ecosystem& Environment vol 88 p 129-136
[3] Pang Y M 2009 Progress in Soil Fertility Evaluation. Journal of Shanxi Agricultural Sciences,
vol 37(02) p 85-87
[4] Zhu Z X 1983 Soil Science( Beijing: Agriculture Press) p 36
[5] Su Y Z, Li Y L, Cui J Y and et al 2005 Influences of continuous grazing and livestock
exclusion on soil properties in a degraded sandy grassland, Inner Mongolia, northern
China.Catena vol 59(3) p 267-278
[6] Ye H C, Zhang S W, Huang Y F, Zhou Z M and Shen C Y 2014 Application of Rough Set
Theory to Determine Weights of Soil Fertility Factor Scientia Agricultura Sinica vol 47(04)
p 710-717
[7] Wang Z L, Fu Q and Jiang Q X 2007 Research Progress in the Integrated Evaluation of Soil
Fertility System Sciences and Comprehensive Studies in Agriculture vol 23(01) p15-18
[8] Stephen N 2002 Standardization of soil quality attributes J. Agriculture, Ecosystems&
Environment vol 88 p 161- 168
[9] Arshad M A and Martin S Identifying critical limits for soil quality indicators in agro-
ecosystems Agriculture, Ecosystems& Environment vol 88 p 153-160
[10] Yang L P 2000 Review and Prospect of sampling techniques for evaluating regional soil
fertility Soils And Fertilizers vol (01) p 3-8
[11] An K, Xie X P, Zhang H Z and Zhou H 2015 Spatial pattern and impact factor of soil fertility
in West Lake Scenic Area Chinese Journal of Ecology vol 34(04) p 1091-1096
Assessment on Nutrients and Fertilities of Soils in Different Land Use Types within Dazhai Village Watershed in Yunnan Province, China
537

[12] Wang B and Chen L X 2006 Review on methods of soil quality evaluation J.Science of Soil
and Water Conservationvol 4(02) p 120-126
[13] Wang D P, He S M, Ge S J, Pan C P and Zhai M G 2013 Mountain Hazards Induced by the
Earthquake of Sep 07,2012 in Yiliang and the Suggestion of Disaster Reduction Journal of
Mountain Science vol 31(01) p 101-107
[14] Ministry of agriculture of People's Republic of China 2009 NY/T 1749-2009 Diagnosis and
evaluation of soil fertility in arable land in southern China Beijing: China Agriculture
Press
[15] Yang J L, He Y F and Zheng S J 2005 Research progresses in aluminum tolerance mechanisms
in plantsJ.Plant Nutrition and Fertilizer Science vol 11(06) p 130-139
[16] Mao H A, Xie D T and Yang J J 2005 Relation of pH and Cation Saturation of Orange
Orchard Soil in ChongQing Jiangjin Chinese Journal of Soil Science vol 3 6(06) p 63-65
[17] Luo Y L, Li Q Q and Wang C Q et al 2015 Spatial variability of soil C/N ratio and its
influence factors at a county scale in hilly area of Mid-Sichuan Basin, Southwest China
Chinese Journal of Applied Ecology vol 26(01) p 177-185
[18] Xie J, Li Y M and Hou T 2012 CIntegrated Soil Fertility Quality Analysis under Different
Land Use Types in Naban River Watershed Journal of Yunnan Agricultural University vol
27(03) p 401-407
[19] Xie K Z, Xu P Z, Yan C and et al 2009 Study the Effects of Soil Improvement on Acid Soil in
the South of China J.Chinese Agricultural Science Bulletin vol 25(20) p 160-165
IWEMSE 2018 - International Workshop on Environmental Management, Science and Engineering
538
