
Evaluation of Sentinel-2 Composited Mosaics and Random
Forest Method for Tree Species Distribution Mapping in
Suburban Areas of Kyiv City, Ukraine
M Kutia
1,2,*
, V Myroniuk
3
and A J Sarkissian
1
1
Bangor College China, joint unit of Bangor University, Bangor, UK
2
Central South University of Forestry and Technology, Changsha, China
3
Department of Forest Mensuration and Forest Inventory, National University of Life
and Environmental Sciences of Ukraine, Kyiv, Ukraine
Corresponding author and e-mail: M Kutia, m.kutia@bangor.ac.uk
Abstract. The availability of comprehensive and cost-effective information on the state of
suburban forests and their protection and rational use is necessary for policymakers and urban
planners to make informed decisions. The lack of this information can be problematic in their
efforts to develop sustainable infrastructure and the local economy while improving the
environment and general wellbeing of inhabitants. The recently launched Sentinel-2 satellite
presents us with the potential for improving inventory and mo nitoring of suburban forests.
We used spatial and spectral powers of this remote sensing data through a Google Earth
Engine platform for creating cloudless seasonal mosaics of Sentinel-2 imagery for the year
2015. The non-parametric Random Forest classification algorithm was used for creating
continuous dominant tree species composition raster map of Kyiv suburban forests. The
developed methodology, including data collection and analysis showed substantial time-
savings compared to traditional inventory methods while achieving high accuracy of trees
species mapping (97.8 % of overall accuracy). In summary, our approach could be considered
as an application that would greatly satisfy inventory, monitoring and sustainable
management of suburban forests.
1. Introduction
Managing urban and peri-urban forests requires comprehensive spatial and biophysical information
for ensuring long-term sustainability of these natural spaces. These forests are an integral part of the
urban framework and provide social, environmental and economic benefit to its inhabitants.
Comprehensive knowledge of the status and trends of species distribution, composition, regeneration,
health, growth and development of urban and suburban forests is essential for policymakers and
urban planners [1]. Remote sensing technologies provide researchers with an alternative solution for
solving forest inventory tasks that are less time-consuming and more cost-effective for medium to
large scale analysis.
The scale and detail of mapping have gradually evolved with development of finer spatial and
spectral resolutions of sensors. Freely available imagery such as Landsat and Sentinel have been
applied for mapping large areas of diverse types of forest cover such as tropical, temperate,
Kutia, M., Myroniuk, V. and Sarkissian, A.
Evaluation of Sentinel-2 Composited Mosaics and Random Forest Method for Tree Species Distribution Mapping in Suburban Areas of Kyiv City, Ukraine.
In Proceedings of the International Workshop on Environmental Management, Science and Engineering (IWEMSE 2018), pages 597-604
ISBN: 978-989-758-344-5
Copyright © 2018 by SCITEPRESS – Science and Technology Publications, Lda. All rights reserved
597

deciduous, coniferous etc. [2]. Landsat-8 and Sentinel-2 images are also used in mapping land use
types for managing natural resources [3]. The recent Sentinel-2 mission, which started in June 2015,
provides great potential for the land cover type classification at large and medium scales. Because of
its high spatial resolution, wide coverage and quick revisit time (about 5 days), Sentinel-2 offers
innovative features for environmental remote sensing techniques and can be successfully used for
vegetation sensing, monitoring and forest cover mapping purposes [4]. Recent studies have shown
successful use of Sentinel-2 imagery for solving various mapping tasks [5].
Based on time series of satellite images received during one calendar year or longer, various tasks
of the thematic classification can be solved. Thus, the annual set of images informs users about
phenological changes in the vegetation cover or the seasonal condition of the surface of various
objects (e.g. ice, snow cover, arable land, tree species distribution) during the year. However,
perennial sets reflect the average long-term dynamics of their spectrum and the most significant
changes. Phenological changes help in identifying the differences between similar types of terrestrial
cover, and as а result improves the accuracy of the thematic decoding of satellite images. Given the
large number of variable required, non-parametric methods provide reliable results without the
assumption that the forms of the underlying densities are known, even for arbitrary data sets [6].
Hence, these methods (e.g. Random Forest) provide a simple and effective means for accurately
classifying forest types [7].
This research explores the potential gains in using medium to high spatial resolution multispectral
imagery provided by the newly lunched Sentinel-2 satellite systems for suburban forest mapping. We
hypothesised that using Sentinel-2 multi-temporal multi-seasonal imagery, in combination with the
Random Forest classifier, the tree species distribution thematic raster map can be produced
efficiently with a high accuracy.
2. Methodology
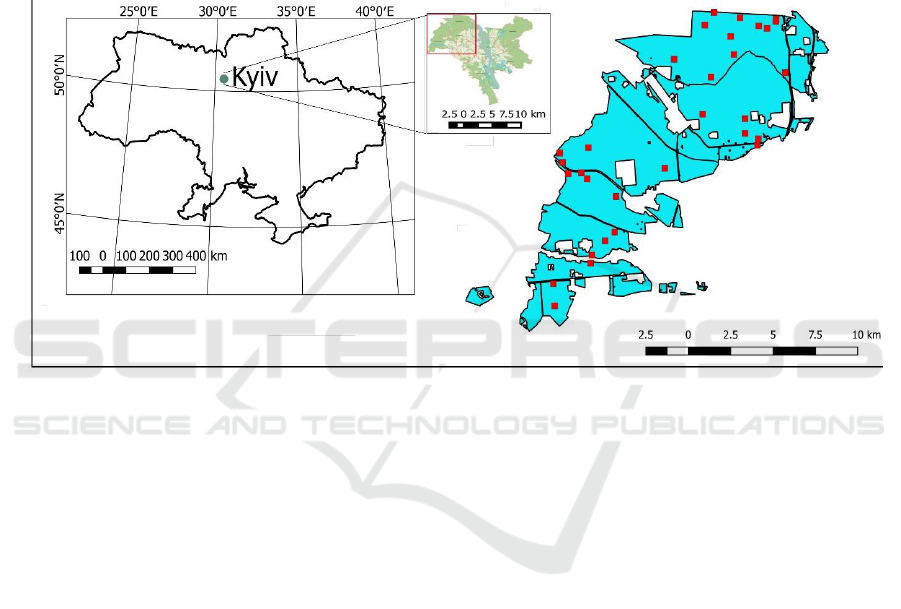
2.1. Study area
The study area was located in the western part of Ukraine’s capital city of Kyiv (50°27′00″N
30°31′24″E), covering approximately 12,510 hectares, of which 11,700 hectares is forest cover
(Figure 1). These suburban forests consist of mostly middle-aged, mature and over-mature coniferous
and deciduous stands and are managed by Sviatoshynske State Forest-Park Enterprise. The most
common forest tree species are Scots pine (Pinus silvestris), European oak (Qurcus robur), silver
birch (Betula pendula), European black alder (Alnus glutinosa) and poplar (Populus tremula). Forest
cover control maps were obtained as ESRI ArcGIS shape-files from the official Government Forest
Inventory’s (“Ukrderzhlisproekt”) database.
The territory exhibits a moderate continental climate with relatively high average annual
temperature (+6.7 °С) and annual rainfall (400-800 mm), thus suitable conditions for most temperate
forests species. The average length of the growing season is 204 days with winter frosts averaging
around 140 days. The relief of the study area is relatively flat with altitudes ranging from 130-160 m.
2.2. Field data
Field data were collected in the summer 2014. A total of 31 polygonal plots were established with the
average area 0.9 ha and were distributed above the whole study area (Figure 1). We used the Forest
Inventory’s database to allocate forest polygons occupied by four dominant tree species: pine, oak,
birch and alder. The forest stands were selected if proportional basal area of the tree species was
more than 90%. We therefore considered only pure forest stands forming four stratums for collecting
field data. The sampling plots were distributed proportionally to the total area of each strata using
random locations.
IWEMSE 2018 - International Workshop on Environmental Management, Science and Engineering
598
Each plot was established using a GPS receiver MAGELLAN Triton-400. In each sample plot, the
basic forest inventory characteristics were reordered (e.g. dominant tree species, age, diameter at
breast height (DBH), mean height, basal area, growing stock volume, etc.). Since forest canopy of
approximately 70% and higher was an important criterion of establishing plots. Summarized
characteristics of all plots as a training field dataset were organized into a KML-file with the
appropriate attribute table for further settings of the classification model.
A total number of 10x10m pixels covered by training polygons was 2790 with the distribution
among the main tree species: Scots pine (n=1183), European oak (n=927), silver birch (n=465), and
European black alder (n=216). We used random bootstrapped samples of 2/3 of this dataset for the
training classifier and 1/3 – in the out-of-bag sample for accuracy assessment.
Figure 1. Study area showing a general map of Ukraine (left panel) and close-up panel of Kyiv city
and the suburban forest study area in red outline (middle); (right panel) forest cover map of
Sviatoshynske Forest-Park Enterprise polygon (in light blue) and sample plots distribution (red
points).
2.3. Remote sensing data acquisition and preprocessing
Compilation of the remote sensing data was performed using the Google Earth Engine API (GEE)
platform. GEE uses state-of-the-art cloud-computing and storage capabilities that have been archived
in a large catalogue of earth observation data [8]. It was accessible to the scientific community to
work on petabytes of satellite imagery rapidly using parallel processing [9]. The Sentinel-2 mission,
launched on the 23
rd
of June 2015, was a land monitoring constellation of two satellites (Sentinel-2a
and Sentinel-2b) providing global optical imagery with 13 spectral bands using a Multispectral
Imager (MSI). Temporal resolution of Sentinel-2 was 10 days with one satellite alone, whereas it
would be 5 days with combining two satellites [10]. As a result, it created a large amount of earth
observation data with a spatial resolution ranging from 10m to 60m that could be used for several
research applications. For our study, we collated Sentinel-2 image data for the period ranging from
June 1st – October 31
st
, 2015. To reduce the influence of atmospheric effects on the classification
results, data were collected with a cloud cover of less than 20%.
All selected images were organized in three seasonal cloudless mosaics based on the algorithm
that maximizes the effect of pixels with the highest values of the index NDVI and allows for
selecting the "best" observations [11]. The three seasonal composites were organized as follows: a)
Summer (Su), b) Autumn (Au), c) April-October (ApOc). Accordingly, the series of observations for
each spectral channel were selected only for those pixels that did not contain cloud cover. If this
Evaluation of Sentinel-2 Composited Mosaics and Random Forest Method for Tree Species Distribution Mapping in Suburban Areas of
Kyiv City, Ukraine
599

criterion for the i-th pixel satisfied several images at once, then observations with the largest value of
NDVI were chosen. For Su and Au seasonal mosaics, the training sample is formed according to the
following channels: Band 4 (red), Band 8 (NIR), Band 11 (SWIR1), Band 12 (SWIR2); channel
relations Band 4 / Band 8, Band 4 / Band 12, Band 8 / Band 11, Band 8 / Band 12, Band 11 / Band 12,
NDVI index. For the ApOC mosaic, special metrics were selected using the following statistics: the
median, the 1
st
and 3
rd
quartiles of the bands: Band 4, Band 8, Band 11, Band 12 and the NDVI index.
The ApOc approximately corresponds to the growing season in Kyiv region. We therefore aimed to
capture the dynamics of spectral features of different tree species within this timeframe (April to
October). The mosaics we extracted were three metrics corresponding to the start of the season (1
st
quartile), middle (median), end (3
d
quartile). The minimum and maximum values were not applied
because they would potentially highlight extreme pixel values. We believe this set of predictors is
effective in detecting the seasonal variability of the spectral properties of various categories of the
forest cover, particularly in identifying the dominant tree species.
In the GEE computing environment, all characteristics (metrics) of seasonal composite mosaics
were composed into one multichannel image with 10m resolution. The total number of channels we
selected was 45. Prior to collating the images, each Sentinel-2 image was converted to Top-of-
Atmosphere reflectance values to enable supervised classification.
2.4. Settings of the classification algorithm
Given the large number of predictors, exclusively non-parametric methods for classifying satellite
images were considered. Recently, the Random Forest (RF) machine learning algorithm has been
widely used as an enhancement of traditional decision trees consisting of many of decision trees [12].
For the construction of each decision tree, an individual bootstrap sample (usually two thirds) was
drawn from the original dataset (i.e. sampling with replacement). The rest of the observations were
used to estimate OBB (out-of-bag) classification errors. Bagging was repeated n times, after which
results from all classification trees were averaged. Finally, the predicted class of an observation was
determined by the majority case from all the decision trees developed within the RF [13].
In the RF method, the decision of classification trees is weakly correlated due to the double
realization of a random selection process, i.e. at the stage of the formation of training subsets and the
selection of predictors for branching. However, the optimization of the training sample of a large set
of predictors is important [8].
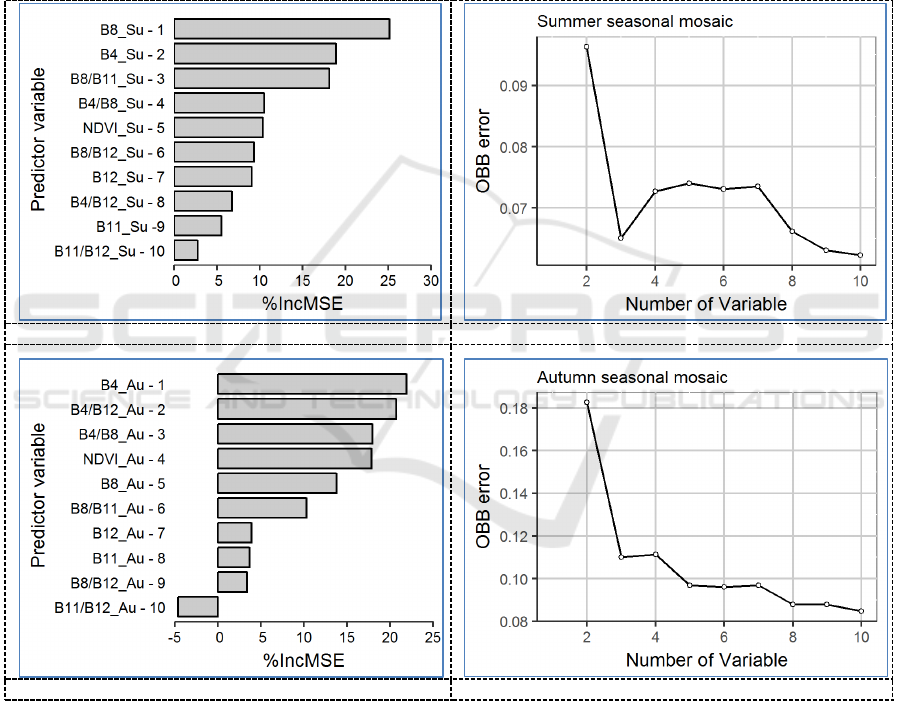
In order to evaluate the relative impact of each predictor on the accuracy of the RF model,
the %IncMSE indicator was used. It indicates how many percentages the mean square error of
classification will increase if we excluded the corresponding variable from the model, and is the most
commonly used indicator in studies to interpret the accuracy of RF classifiers [14], [15].
In order to select the optimal values for the parameters of the RF model, we used the tuneRF
function from the randomForest statistical package in the R programming language. The magnitude
of the relative influence of the predictors on the accuracy of the classification was estimated by the
mean arithmetic error value (OBB error), calculated as a result of 50 repetitive launches of the
randomForest algorithm. Subsequently, each variable was assigned a rank according to the decrease
of %IncMSE.
In the first stage, we analyzed how different the accuracy of the classification of individual
seasonal mosaics was (Figure 2). The slightest error showed the classification of images of the ApOc
period (OBB was approximately 1%), but the two other classifications of seasonal mosaics of Su and
Au showed slightly lower accuracy (OBB is approximately 2 and 8% respectively). For some
indicators, the %IncMSE characteristics acquired negative values and indicated the need to exclude
them from the calculations.
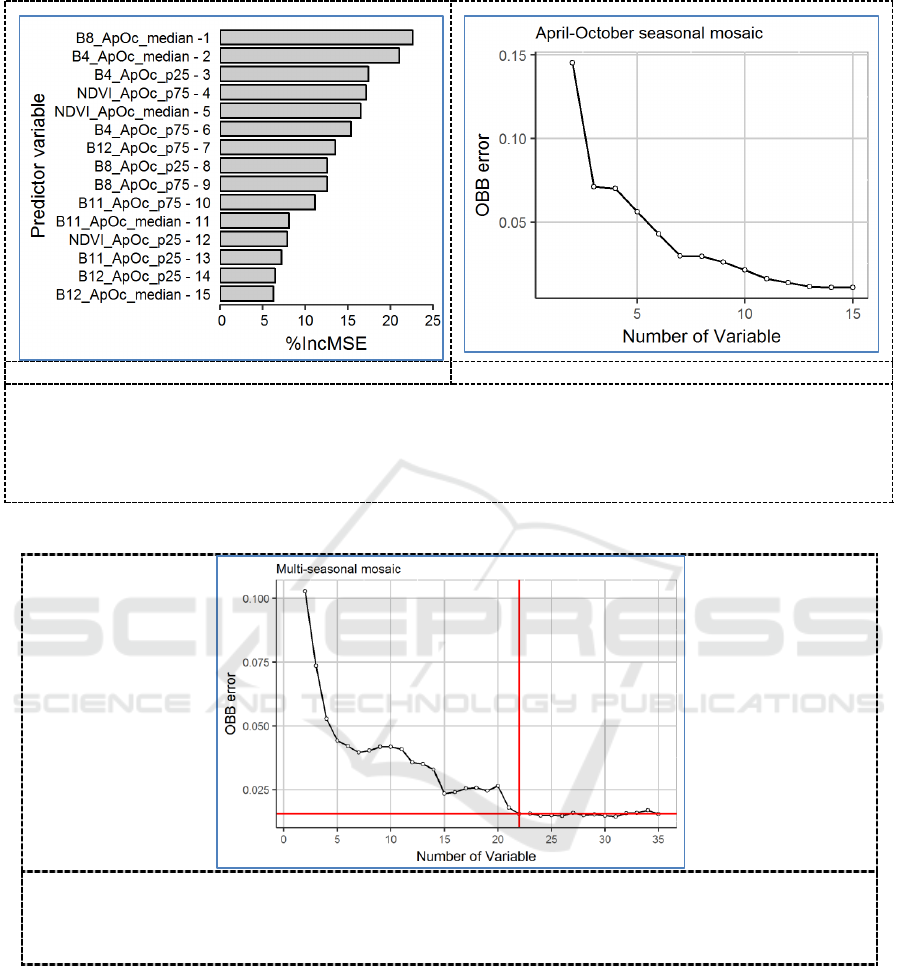
In the second stage we used the entire list of predictors for estimating the classification OBB error.
Of the 35 variables used, those with the lowest errors were obtained (about 0,1%). This enabled us to
IWEMSE 2018 - International Workshop on Environmental Management, Science and Engineering
600
determine what the optimal number of variables was and thus provided the highest accuracy of the
classification (Figure 3). We can define the needed list of predictors by analysing how the
classification error changes with the gradual increase of the number of predictors. To solve this
problem, we used the results of the ranking of variables in terms of their contribution to the accuracy
of the classification. In our case, it was sensible to choose the first 22 variables because their
contribution had the most significant impact on the accuracy, after which the improvement had a
little effect. (Figure 3).
Moreover, for the accuracy assessment of the classified study area, the confusion matrix was
created on the base of out-of-bag pixels sample that was not included for the training RF classifier
(495 reference pixels). As a result, producer’s and user’s accuracies were calculated for each class as
well as overall accuracy and Kappa statistics.
a)
b)
c)
d)
Evaluation of Sentinel-2 Composited Mosaics and Random Forest Method for Tree Species Distribution Mapping in Suburban Areas of
Kyiv City, Ukraine
601
e)
f)
Figure 2. Impact of predictor variables onto the classification accuracy of seasonal mosaics. Left
panels (a, c, e) show the ranked predictors’ impact onto the decrease of MSE of a model. Right
panels (b, d, f) show the relationship between the number of variables and out-of-bag
classification error).
Figure 3. Dependence of the error of tree species distribution classification model (OBB
error) on the number of predictor variables. Vertical red line indicates the most efficient
number of variables which provide optimal accuracy (horizontal red line).
3. Results and discussion
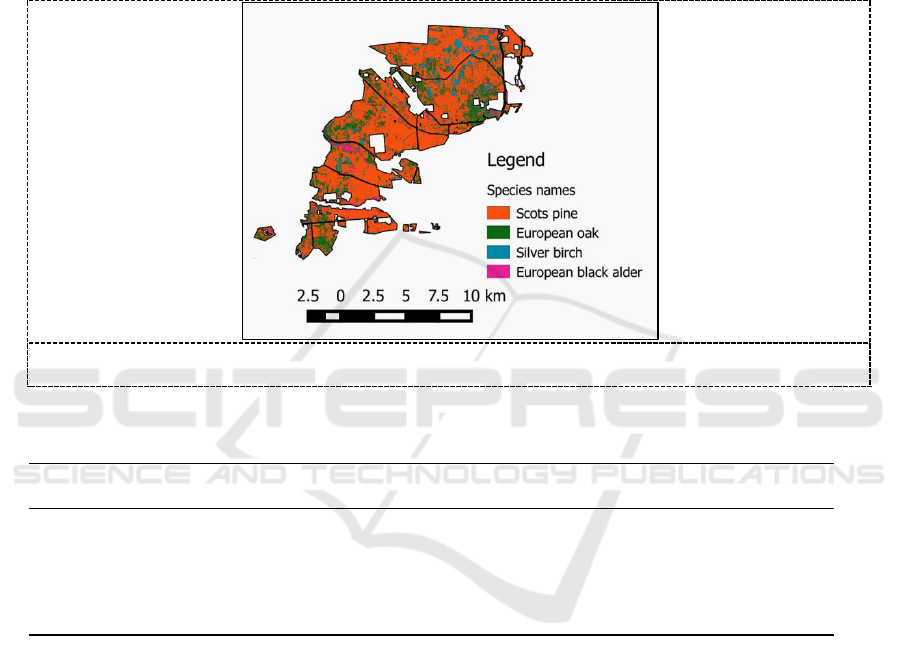
The study of forest cover area in the Sviatoshynske Forest-Park Enterprise (11,700 hectares) was
classified based on the developed random forest classification model and seasonal composite mosaics
of Sentinel-2 imagery (22 predictors). As a result, we developed the dominant trees species
distribution thematic raster map at 10m resolution (Figure 4). The accuracy assessment of the
developed map was performed based on the confusion matrix, which was created from observations
of the training sample that was not included in the development of the RF classification model (out-
of-bag error). In total, 495 pixels were randomly selected for constructing an error matrix. The
overall accuracy of the classification model RF for the entire study area was 97.8% with a Kappa
value of 0.97 (Table 1). As expected, accuracy of the coniferous-pine forests identification was the
IWEMSE 2018 - International Workshop on Environmental Management, Science and Engineering
602
highest (100% for producer's and user's). The classification of European oak and silver birch forests
also showed very high accuracies (about 97%). The lowest producer's and user’s accuracies were
obtained after the identification of black alder forest compartments (87.9 and 82.9%, respectively).
Based on the results obtained from seasonal composite mosaics of Sentinel-2 imagery and RF
algorithm, we show this method to be an efficient and effective means for medium-scale mapping of
dominant tree species distribution with high accuracy. In general, this approach could be considered
as meeting expectations for research in this field and has a great potential for future development and
applications.
Figure 4. Sviatoshynske Forest-Park Enterprise dominant tree species distribution map.
Table 1. Classification results achieved by RF ensemble learning method for Sentinel-2
seasonal mosaics.
Species name
Prod. acc.(%)
User's acc.(%)
Overall acc.(%)
Kapp Stat.
Scots pine
100
100
97.8
96.7
European oak
96.9
97.5
Silver birch
97.7
98.8
Black alder
87.9
82.9
4. Conclusions
This study assessed the utility of multi-seasonal time-series Sentinel-2 satellite imagery for mapping
dominant tree species distribution of Kyiv-city suburban forests, using the Random Forest (RF)
algorithm. We concluded that a) the use of Google Earth Engine platform allows us to save a
significant time in collating and processing large number of free available Sentinel-2 images; b) RF
can be considered a good non-parametric classifier algorithm for tree species composition mapping
on the base of seasonal Sentinel-2 image mosaics; and c) with an overall accuracy of 97.8%, we
could demonstrate a high potential of Sentinel-2 data for mapping of dominant tree species
composition on a medium scale. The described approach could be a foundation for future
development and application in suburban forest management system in order to provide sustainable
development of urban ecosystems.
References
[1] Salbitano F, Borelli S, Conigliaro M and Chen Y 2016 Guidelines on urban and peri-urban
Evaluation of Sentinel-2 Composited Mosaics and Random Forest Method for Tree Species Distribution Mapping in Suburban Areas of
Kyiv City, Ukraine
603

forestry FAO Forestry Paper No. 178. Rome
[2] Gjertsen A K 2007 Accuracy of forest mapping based on Landsat TM data and a kNN-based
method Remote Sens. Environ. 110 pp 420-430
[3] Topaloglur R H, Sertele E and Musaoglune N 2016 Assessment of classification accuracies of
Sentinel-2 and Landsat-8 data for land cover / use mapping. XXIII ISPRS Congress
(Prague).
[4] Immitzer M, Vuolo F and Atzberger C 2016 First Experience with Sentinel-2 Data for Crop
and Tree Species Classifications in Central Europe Remote Sens. 8(3) 166-185
[5] Novelli A, Aguilar M A, Nemmaoui A, Aguilar F J and Tarantino E 2016 Performance
evaluation of object based greenhouse detection from Sentinel-2 MSI and Landsat 8 OLI
data: A case study from Almería (Spain) Int. J. of Applied Earth Observ. and
Geoinformation 52 403–411
[6] Breiman L 2001 Random forests Mach. Learn. 45 5–32
[7] Duda R O, Hart P E and Stork D G 2000 Pattern Classification 2nd ed. (New York: John
Wiley & Sons, NY, USA)
[8] Shelestov A, Lavreniuk M, Kussul N, Novikov A and Skakun S 2017 Exploring Google Earth
Engine Platform for Big Data Processing: Classification of Multi-Temporal Satellite
Imagery for Crop Mapping Frontiers in Earth Science 5 1-10.
doi:10.3389/feart.2017.00017
[9] Hansen M, Potapov P, Moore R, Hancher M, Turubanova S, Tyukavina A, Thau D, Stehman S,
Goetz S, Loveland T, Kommareddy A, Egorov A, Chini L, Justice C and Townshend J
2013 High-Resolution Global Maps of 21st-Century Forest Cover Change Science 15 850-
853
[10] Drusch M, Del Bello U, Carlier S, Colin O, Fernandez V, Gascon F, Hoersch B, Isola C,
Laberinti P and Martimort P 2012 Sentinel-2: ESA’s Optical High-Resolution Mission for
GMES Operational Services Remote Sens. Environ. 120 25–36
[11] Hansen M C, Egorov A, Roy D P, Potapov P, Ju J C, Turubanova S and Loveland T R 2011
Continuous fields of land cover for the conterminous United States using Landsat data: first
results from the Web-Enabled Landsat Data (WELD) project Remote Sens. Letters 2(4)
279–288 https://doi.org/10.1080/01431161.2010.519002
[12] Eisavi V, Homayouni S, Yazdi A M and Alimohammadi A 2015 Land cover mapping based
on random forest classification of multitemporal spectral and thermal images Env. Monitor.
and Assess. 187(5) doi:10.1007/s10661-015-4489-3
[13] Bilous A, Myroniuk V, Holiaka D, Bilous S, See L D and Schepaschenko D 2017 Mapping
growing stock volume and forest live biomass: a case study of the Polissya region of
Ukraine Env. Research Letters 12(10) doi:10.1088/1748-9326/aa8352
[14] Chrysafis I, Mallinis G, Gitas I, and Tsakiri-Strati M 2017 Estimating Mediterranean forest
parameters using multi seasonal Landsat 8 OLI imagery and an ensemble learning method
Remote Sens. Environ. 199 154–166
[15] Genuer R, Poggi J M and Tuleau-Malot C 2010 Variable selection using random forests
Pattern Recognition Letters 31(14) 2225–2236 doi:10.1016/j.patrec.2010.03.014
IWEMSE 2018 - International Workshop on Environmental Management, Science and Engineering
604
