
The Evaluation and Prediction of Urban Ecological Security:
a Case Study of Dongguan, China
H Xie
1
, S H Chen
1
, Z Y Chen
1
, Q H Chen
1
and M R Su
2, *
1
School of Environment and Civil Engineering, Dongguan University of Technology,
Dongguan 523808, China
2
Research Center for Eco-Environmental Engineering, Dongguan University of
Technology, Dongguan 523808, China
Corresponding author and E-mail: M R Su, sumr@dgut.edu.cn
Abstract. A rational evaluation of the current impacts of urban industries is a prerequisite for
their transformation and upgradation. Integrating the classical pressure-state-response (PSR)
framework with the technology-resource-environment (TRE) perspective, we constructed a
PSR-TRE urban ecological security index system for this study. Using the weights of
different indicators for information entropy, we applied the weighted sum method to calculate
a comprehensive urban ecological security index for Dongguan. We subsequently formulated
five categories for assessing the security levels of the urban ecology. We also established a
learning vector quantization neural network model to predict levels of urban ecological
security in Dongguan under different scenarios. The results indicated that the urban
ecological security level for Dongguan gradually increased during the period 1999–2015,
showing the following progression: critically safe relatively safe safe. To a certain
extent, this transformation indirectly reflects a successful process of industrial transformation
and upgradation in Dongguan. We recommend a continued managerial emphasis on industrial
transformation and upgradation within urban development planning. Moreover, reasonable
guarantees should be provided to ensure the smooth progress of industrial upgrading.
1. Introduction
Industrial upgradation constitutes the foundation of eco-city construction [1], promoting mutual and
coordinated development of the three pillars of the economy, society, and environment. It leads to
improved efficiency of production and the advancement of the social economy, while simultaneously
contributing to a reduction of pollutant emissions and the protection of the eco-environment. The
impacts of industrial transformation and upgrading are thus manifold. However, there is still a lack of
scientific evaluation of industrial transformation and upgrading, while most of studies focus on the
necessity of industry transformation, the advantages and obstacles, the thinking and countermeasures,
and the mode of transformation [2]. We believe that given its comprehensive characteristics,
ecological security can serve as an evaluation tool for assessing the security of industrial
transformation and upgradation. Ecological security refers to a state in which people do not
experience any threats relating to their lives, health, basic rights, and sources of life security.
Moreover, in this state, there is an absence of threats to necessary resources, the social order, and
Xie, H., Chen, S., Chen, Z., Chen, Q. and Su, M.
The Evaluation and Prediction of Urban Ecological Security: a Case Study of Dongguan, China.
In Proceedings of the International Workshop on Environmental Management, Science and Engineering (IWEMSE 2018), pages 645-653
ISBN: 978-989-758-344-5
Copyright © 2018 by SCITEPRESS – Science and Technology Publications, Lda. All rights reserved
645
societal adaptation to environmental changes. Thus, ecological security reflects the overall level of
ecosystem integrity and health [3]. Existing studies on ecological security have focused mainly on
the construction of index systems [4-5] for evaluating ecological security, evaluations of the eco-
environment (e.g., sensitivity assessment, vulnerability assessment and quality evaluation),
assessments of ecosystem health (e.g., structural and functional evaluations, stability and sustainable
evaluation) [6], as well as evaluation of ecological service functions and ecological risks [7].
As ecological systems with high population densities, urban ecosystems are particularly
vulnerable in terms of their security [8]. Security in the context of urban ecological systems means
that the environment and resources of an urban area can meet the requirements for sustainable
development of the associated human society and economy. Moreover, in a secure urban ecological
system, the eco-environment is not threatened, or is not seriously threatened, by economic and social
adjustments implemented within it [9]. Most of the existing studies conducted on urban ecological
security have focused on overall evaluations of urban ecological security [10], applying evaluation
models and index systems relating to urban ecological security. Prevailing research methods for
assessing urban ecological security, such as the fuzzy comprehensive method [11], system dynamics,
the ecological footprint method, and the landscape pattern method have entailed largely static
evaluations, evidencing some limitations in their ability to make predictions. A more accurate
method of predicting early warning analysis entails modifying the learning vector quantization (LVQ)
neural network method [12] by incorporating self-learning interactions between neurons and the
outside world, which allows for nonlinear correlations between the indexes
[13].
2. Research method
2.1. Construction of the index system
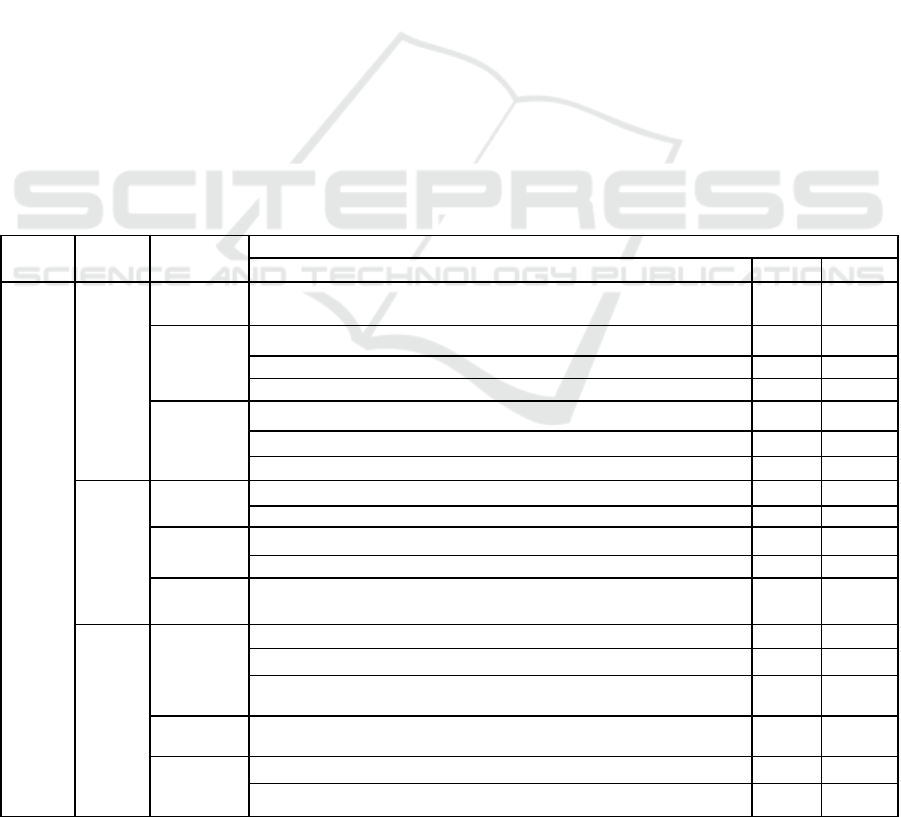
Table 1. Urban ecological security indicators.
Objective
Item
Factor
Index
Evaluation Indicator
Unit
Direction
Urban
ecological
security
Pressure
Technology
pressure
Pt
1/
Non-high-tech enterprises account for the total number of enterprises
%
-
Resources
pressure
Pr
1
/Population density
10
4
/km
2
-
Pr
2
/Annual precipitation
mm
+
Pr
3
/Land area per capita in a built-up area
10
4
/km
2
-
Environment
pressure
Pe
1
/Industrial output value of industrial waste water per 10,000 yuan
t/10
4
yuan
-
Pe
2
/Emission of industrial waste residue per 10,000 yuan
t/10
4
yuan
-
Pe
3
/Industrial waste gas emission per 10,000 yuan of industrial output
m
3
/yuan
-
State
Technology
state
St
1
/Education and health expenditure accounting for a proportion of fiscal
%
+
St
2
/The total output value of new and advanced technology
10
8
yuan
+
Resources
state
Sr
1
/Rate of green coverage of the built-up area
%
+
Sr
2
/Forest coverage
%
+
Environment
state
Se
1
/ Acid rain frequency
%
-
Response
Technology
response
R
t1
/Tertiary industry accounting for a proportion of the GDP
%
+
Rt
2
/Research and development expenditure
10
4
yuan
+
Rt
3
/Investment ratio in scientific research and in a technology service
industry
%
+
Resources
response
Rr
1
/Park area
m
2
+
Environment
response
Re
1
/The comprehensive utilization rate of industrial solid waste
%
+
Re
2
/Standard rate of automobile exhaust emissions
%
+
IWEMSE 2018 - International Workshop on Environmental Management, Science and Engineering
646

We constructed the framework of a PSR evaluation index system, which was then divided into three
sets of factors relating respectively to technology, resources, and the environment. Thus, we created a
PSR-TRE urban ecological security assessment system comprising 18 indexes, as shown in Table 1.
2.2. Calculation of the urban ecological security index
Standardization of the index: To eliminate differences within each evaluation index unit, and in the
levels and nature of their quantities, it was necessary to standardize the data.
For positive indicators:
max
x
x
y
ij
ij
(1)
For negative indicators:
ij
ij
x
x
y
min
(2)
In the above formulas, x
ij
denotes the original value of j index in i year, x
ma x
denotes the
maximum value in m year, x
min
denotes the minimum value in m year, and y
ij
denotes the standard
value after y
ij
.
To determine the weight of the indicator, we applied the entropy weight method. We first
calculated the entropy value of the e
j
index as follows:
m
i
ijijj
yyke
1
ln
(3)
where K = 1/lnm and y
ij
denotes a standardized indicator data. The weight of index J was calculated
as follows:
n
j
j
j
j
d
d
w
1
(4)
In the above formula, d
j
= 1-e
j
denotes the difference coefficient of the index y
j
. A reduction in
entropy corresponds to the increasing difference and importance of the index.
Exponential computation based on the weighted summation method: The weighted summation
method is widely used in ecological security assessments. The computation is performed as follows:
n
ij
ijj
ywA
(5)
Where y
ij
denotes the value of the i year j index, w
j
denotes the weight value of the j index, and n
denotes the index number. To obtain the comprehensive contribution value of n, the contribution
value of w
j
y
ij
to the ecological security index is added to the sum of any n items. A higher composite
index of the comprehensive index calculation and evaluation corresponds to a higher security level.
2.3. Determination of the level of urban ecological security
Considering the influence of various factors, and referring to previous research findings [14], we
designed a 5-level classification system comprising the following categories: quite unsafe, unsafe,
critically safe, relatively safe and safe, as shown in Table 2:
Table 2. Urban ecological security classification system.
Comprehensive coefficient
< 0.25
0.25–0.40
0.40–0.60
0.60–0.75
> 0.75
Security description
quite unsafe
unsafe
critically safe
relatively safe
safe
Security level
1
2
3
4
5
The Evaluation and Prediction of Urban Ecological Security: a Case Study of Dongguan, China
647

2.4. Construction of a learning vector quantization neural network
Basic principles of LVQ neural networks: The LVQ neural network comprises an input layer, a
hidden layer, and an output layer. These three layers are closely connected, with each neuron in the
output layer connected to neurons from different groups in the hidden layer. The connection weights
between the neurons in the hidden layer and those in the output layer are fixed at a value of 1. In the
course of network training, the weights between neurons in the input and hidden layers are modified.
When an input pattern is incorporated into the network, neurons within the latent layer in the closest
mode win the competition because of the excitation, thus prompting their production of a value of 1,
whereas the other neurons that are suppressed are forced to produce a value of 0. The neurons in the
output layer that are connected to the neurons in the hidden layer containing the winning neurons also
produce a value of one, whereas other neurons in the output layer produce a value of 0.
Neural network algorithm of LVQ: The basic steps for performing the LVQ algorithm are as
follows:
(1) Network initialization: The initial value of weights between the input and hidden layers is set
as a small random number.
(2) Addition of vector input: The input vector x = [x
1
,x
2
,x
3
,..., x
n
]
T
is added to the input layer.
(3) The distance between the weighted vector in the hidden layer and the input vector is calculated
from the neurons in the hidden and the input vector, which is the same as the self-organization
mapping:
n
i
ijij
wxd
1
2
)(
(6)
(4) Selection of the neurons closest to the weighted vector: The smallest neurons in the input and
weighted vectors are computed and selected as the winning neurons, recorded as j*.
(5) Updating of the connection weight: If the winning neuron is consistent with a predetermined
classification, called the correct classification, this is called an incorrect classification. The correct
and incorrect classifications of the weight of the adjustment are obtained using the following
formula:
)(
)(
iji
iji
ij
wx
wx
w
(7)
(6) To determine whether the maximum number of iterations meets the preset, when the algorithm is
completed, or return steps (2), into the next round of learning.
Construction of an urban ecological security LVQ model: The LVQ neural network method is an
effective method for predicting urban ecological security. The procedure for predicting urban
ecological security using this model comprises two steps as follows. In the first step, some index data
are randomly extracted as training samples, and the remaining samples are tested to verify the
accuracy of the model. In the second step, the index data for each year of the study period are used as
training samples to predict the result.
2.5. LVQ neural network prediction
Network training: After creating the neural network, we set up its training parameters at 1,000 times.
The training target was 0.05 and the learning rate was 0.01. The data input network was randomly
selected from all of the samples during the study period as samples for training the network. The
network input was the index value of the sample in the city, and the network output was a sample of
the urban ecological security grade. The five urban ecological security grades numbered 1, 2, 3, 4,
and 5 corresponded respectively to the following categories: extremely quite unsafe, unsafe, critically
safe, relatively safe, and safe.
IWEMSE 2018 - International Workshop on Environmental Management, Science and Engineering
648
Detection of the LVQ neural network: After the network training was completed, the remaining
samples were used as simulation test samples, and the simulated test was performed within a trained
neural network to obtain the actual output security level of the samples. Because each operation
entailed re-establishing a neural network, the accuracy varied for each one. To reduce errors and
avoid contingency, the average number of run verifications was applied in this study.
3. Results and discussion
3.1. Changes in ecological security during the process of industrial transformation and upgradation
in Dongguan
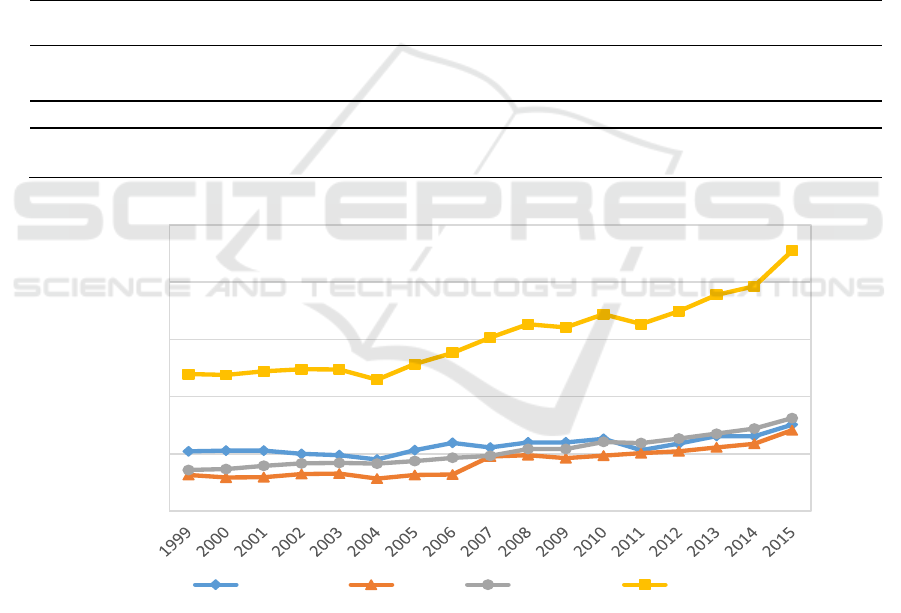
Table 3 and Figure 1 show changes in the levels of ecological security in Dongguan during the period
1999—2015. The values indicate a gradual increase in Dongguan’s ecological security from critical
safe to relative safe and finally safe during the respective periods 1999–2006, 2007–2011, and
2012–2015.
Table 3. Urban ecological security values for Dongguan during the period 1999–2015.
Year
1999
2000
2001
2002
2003
2004
2005
2006
2007
Security
value
0.479
0.475
0.488
0.496
0.495
0.459
0.514
0.553
0.606
Year
2008
2009
2010
2011
2012
2013
2014
2015
Security
value
0.653
0.642
0.688
0.653
0.698
0.755
0.785
0.910
Figure 1. Changes in the ecological security level for Dongguan during the period 1999–2015.
3.2. Analysis of bottleneck factors constraining Dongguan’s ecological security
Pressure layer: As shown in Figure 2, the indicators with the most impact on the pressure layer were
the industrial production value per 10,000 yuan industrial waste, waste water, and exhaust gas.
Although emissions of pollutants in Dongguan have been reduced, the government should pay
attention to the environmental pressure layer, continuing to make efforts to reduce industrial waste
residues, waste water, and the exhaust emission index value of every million industrial output value.
0
0.2
0.4
0.6
0.8
1
Ecological security level
year
pressure state response total
The Evaluation and Prediction of Urban Ecological Security: a Case Study of Dongguan, China
649
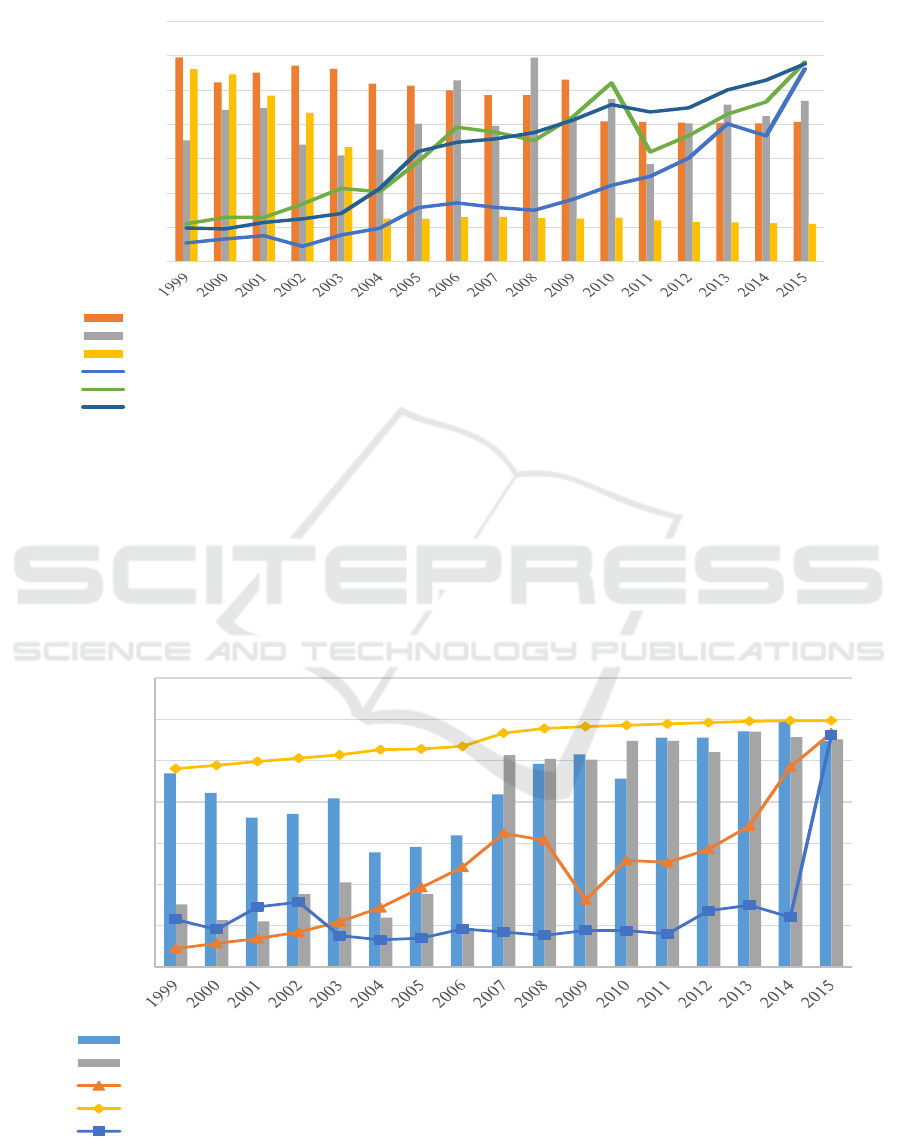
Moreover, alternatives to the ―three high‖ enterprises should be sought and efforts should be made to
improve production efficiency.
Figure 2. The security level reflected by each index at the pressure layer.
State layer: As shown in Figure 3 shows, the two index levels of education and health expenditure
accounting for a proportion of fiscal, accounted for the total output value of new and advanced
technology were relatively high and on the rise in terms of their technical status, with small
fluctuations evident during the middle period. Therefore, the focus should be on the technical state
layer, with supplementary efforts made to improve the resource state layer. Investments in science
and education should continue to increase, and the urban area’s core creation level should be
increased.
Figure 3. The security level reflected by each index at the state layer.
0
0.01
0.02
0.03
0.04
0.05
0.06
0.07
The security level reflected by each index
Year
Population density
Annual precipitation
Land area per capita in a built-up area
Industrial output value of industrial waste water per 10,000 yuan
Emission of industrial waste residue per 10,000 yuan industrial output
Industrial waste gas emission per 10,000 yuan industrial output
0
0.01
0.02
0.03
0.04
0.05
0.06
0.07
The security level reflected by each index
Year
Education and health expenditure accounted for the proportion of fiscal expenditure
Rate of green coverage of the built-up area
The total output value of high and new technology
Forest coverage
Acid rain frequency
IWEMSE 2018 - International Workshop on Environmental Management, Science and Engineering
650
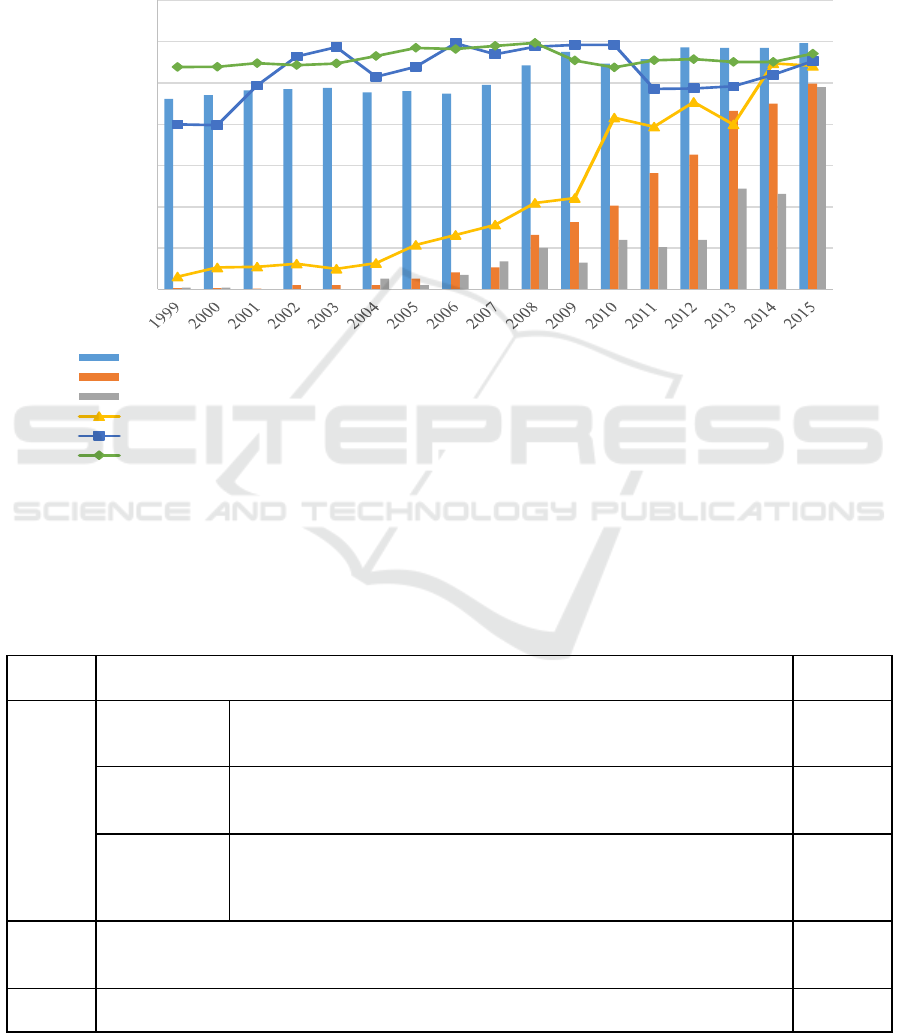
Response layer: As Figure 4 shows, the park area, research and development expenditure and
investment ratio in scientific research and in a technology service industry are the main influencing
factors. The government should provide strong support for the development of scientific research
projects and increased investments in scientific research to further promote the transformation of
industry in a positive direction. Simultaneously, more parks should be created to provide more
recreational venues for the public, while improving the environment and reducing ecological risks.
Figure 4. The security level reflected by each index at the response layer.
3.3. Analysis of LVQ prediction results in 2020
As shown in Table 4, the index data inputted into the LVQ model for each scenario was derived from
the corresponding security level.
Table 4. Prediction results obtained with the learning vector quantization model in 2020.
Scenario
levels
Basis of scenario setting
Security
level
Low
Failed mode
of industrial
transformation
The industrial development pattern is still extensive, resource
consumption and the intensity of pollutant emissions are high, and
other industries have reached the anticipated targets
Safe
Failed mode
of industrial
upgrading
High-end industries have suffered setbacks. The development of
high-tech industries is not ideal, with other aspects having reached the
anticipated targets
Relatively
safe
Mode of
environmental
protection
missing
Industrial transformation and upgradation have been implemented to
achieve the anticipated goals. However, necessary policies on
environmental protection have been neglected and are not in place.
Safe
Normal
Industrial transformation and upgradation have been implemented to achieve the desired
goal. A variety of implemented policies are relatively established, producing enhanced
results
Safe
High
Industrial transformation and upgradation are highly successful. Various
countermeasures have been implemented and are established with outstanding results.
Safe
0
0.01
0.02
0.03
0.04
0.05
0.06
0.07
The security level reflected by each index
Year
Tertiary industry accounting for a proportion of the GDP
Research and development expenditure
Investment ratio in scientific research and in a technology service industry
Park area
The comprehensive utilization rate of industrial solid waste
Standard rate of automobile exhaust emissions
The Evaluation and Prediction of Urban Ecological Security: a Case Study of Dongguan, China
651

From the prediction results shown in Table 4, it can be seen that the security levels for the
outcomes of the normal and high-level scenarios in 2020 are categorized as safe. In 2015, the ecology
of Dongguan was categorized as safe. For the low-level scenarios in 2020, only the scenario entailing
the failure of industrial upgradation was associated with a decline in the security level of the urban
ecology, with the scenario outcomes for failed industrial transformation and failed environmental
protection both remaining safe. In the absence of environment protection, environmental pollution at
the source is greatly reduced by the rational industrial structure and fine industry. This compensates
for the government’s unfavorable policy-related influence on environmental protection. The situation
regarding industrial upgradation is directly related to urban ecological security for all aspects of the
impacts of various factors. Consequently when formulating urban development plans, the
government should focus on the situation regarding industrial upgradation and develop a mechanism
for achieving rational industrial upgradation and environmental protection.
4. Conclusions
It is necessary to comprehensively evaluate the effect of urban industrial transformation and
upgrading after a few decades’ implementation. Considering the fact that there is a lack of scientific
evaluation method for industrial transformation, we introduced ecological security in this paper as an
useful evaluation tool.
Taking Dongguan as a case study, we first proposed a new PSR-TRE evaluation index system
using the weighted summation method to calculate and analyze changes in the urban ecology’s
security levels associated with the process of transforming and upgrading Dongguan’s industry.
Moreover, we applied the LVQ neural network method with self-learning ability to predict the
change trend of Dongguan’s urban ecological security for better planning in the future. The results of
the analysis indicated that the level of ecological security in Dongguan rose gradually during the
period 1999–2015, progressing from critically safe to relatively safe and then to safe. This
progression to some extent reflects the success of Dongguan’s industrial transformation and
upgradation process. The prediction results revealed that the urban ecological security levels for all
of the scenarios were categorized as safe, with only one scenario entailing failure of industrial
upgradation being categorized as relatively safe.
Although ecological security provides a helpful evaluation tool of urban industrial transformation,
a lot of improvement can be conducted in the future, especially considering the underlying
uncertainties caused by the limitations of data quality, determined weights of each index, and the
grading standards of security levels.
Acknowledgments
This research was financially supported by the National Key R & D Program of China (No.
2016YFC0502800), the National Natural Science Foundation of China (No.71673027), the Natural
Science Foundation for Distinguished Young Scholars of Guangdong Province
(No.2017A030306032), GDUPS (2017), and the Scientific Research Foundation for High-level
Talents and Innovation Team in Dongguan University of Technology (No. KCYKYQD2016001).
We thank Radhika Johari from Liwen Bianji, Edanz Editing China (www.liwenbianji.cn/ac), for
editing the English text of a draft of this manuscript.
References
[1] Zhang X W 2014 Evaluation of Industrial Upgrading in Ecological city Construction of
Baotou Inner Monolia University of Science & Technology
[2] W Cao 2004 Introduction to Urban Ecological Security China Architecture & Building Press.
[3] Tao X Y 2013 Industrial Transformation Ability of Cites by Principal Component Analysis
Resource & Industries 15(02) pp 1-5
IWEMSE 2018 - International Workshop on Environmental Management, Science and Engineering
652

[4] Li Y 2009 The evaluation of ecological vulnerability basing GIS – As an example in the
mining area Pingshuo China University of Geosciences (Beijing)
[5] Zhang H Y, Peng P, Xiao W and Tang S L 2008 Assessment on ecologlical environment status
of mining area based on AHP and GIS Coal Science and Technology 36 (9) pp 102-105
[6] Li C H, Zheng X K, Cui w, Pang A P and Yang Z F 2008 Watershed eco-health assessment of
Hengshui Lake Geographical Research 27(3) pp 565-573
[7] Cheng G, Zhang Y, Gao H, Tian Z Q and Wan J 2010 Contamination Characteristics and
Potential Ecological Risk Assessment of Planning Areas in Baiguishan Reservior Research
of Environmental Sciences 23(4) pp 452-458
[8] Wu K Y 2003 Principal Component Projection Applied to Evaluation of Regional Ecologic
Security China Soft Science (9) pp 123-126
[9] Li P W, Li G C, Zhang J H, Xu F and Chen L 2009 Several assessment models and application
analysis of urban ecological security Geographical Research 28(02) pp 293-302
[10] Yang Y L, Ren W, Ren J and Li X 2012 Assessment Index System Construction of Artificial
Wetland Eco-security Safety and Environmental Engineering 19(04) pp 66-69
[11] Zhao C R and Zhao W M 2015 Application of Fuzzy Comprehensive Evaluation to Urban
Eco-security Assessment Environmental Science & Technology 33(3) pp 179-183
[12] Peng J, Tao J X and Liu Y X 2015 Temporal characteristics of ecological risk assessment
indicators in coal-mining city with the application of LVQ method Chinese Journal of
Applied Ecology.26(3) pp 867-874
[13] Wen X, Li X and Zhang X W 2015 The Application of MATLAB Neural Network National
Defense Industry Press pp 253-257
[14] Yang Z F, Xu L Y and Mao J S 2013 Urban Ecological Security Assessment and regulation
Science Press
The Evaluation and Prediction of Urban Ecological Security: a Case Study of Dongguan, China
653
