
The Identification of Developmental Pattern of Urban
Agglomerations in China based on GIS
H X Lin
1,2,3,*
, J C Huang
1,2,3
and Y Q Chen
4
1
Key Laboratory of Regional Sustainable Development Modeling, CAS, Beijing
100101, China
2
Institute of Geographic Sciences and Natural Resources Research, CAS, Beijing
100101, China
3
College of Resources and Environment, University of Chinese Academy of
Sciences, Beijing 100049, China
4
Beijing National Day School, Beijing 100039, China
Corresponding author and e-mail: H X Lin, linhx.14b@igsnrr.ac.cn
Abstract. Urban agglomeration is an advanced spatial organization form that occurs when
urban areas develop into a certain mature stage, and is regarded as the main form of new
urbanization strategy in China. Nevertheless, the past few years have witnessed an acute
shortage of research on urban agglo me ration’s dynamic evolution at large scale and over
mu ltiple periods. This shortage has aroused widespread concern about how to scientifically
and quantitatively identify the developmental boundary of urban agglomeration, and this
remains an urgent scientific issue to be solved. Following the objective logic of urban
development and evolution, metropolitan area is the basic component unit of urban
agglomeration, while joint metropolitan area, quasi metropolitan interlocking region and
metropolitan interlocking region are the main types of urban agglomeration. With the aid of
GIS, this paper identified the developmental pattern of urban agglomeration in virtue of
socio-economic indexes such as urban population, urbanization rate, per capita GDP, the
proportion of non-agricultural GDP/employment, economic density and population density of
2858 county-level administrative units in 2010. As the result showed, there were 325
metropolitan area units among 657 cities, including 239 big central cities, 86 small central
cities and 196 peripheral compliant counties. The overall pattern of urban agglomeration was
formulated by 156 metropolitan areas, 25 joint metropolitan areas, 3 quasi metropolitan
interlocking regions and 3 metropolitan interlocking regions. In the future, in consideration of
the evolutionary trend of urban agglomeration and the guiding role of national economic
spatial structure, China will form one giant metropolitan interlocking region, two large-scale
metropolitan interlocking regions, five metropolitan interlocking regions, seven quasi
metropolitan interlocking regions, which together forming a spatial developmental pattern
including fifteen key urban agglomerations.
1. Introduction
Urban agglomeration is an advanced spatial organization form bearing both the national economic
and social strategy. Nobel laureate in economics Joseph E. Stiglitz regards urbanization in China and
Lin, H., Huang, J. and Chen, Y.
The Identification of Developmental Pattern of Urban Agglomerations in China based on GIS.
In Proceedings of the International Workshop on Environmental Management, Science and Engineering (IWEMSE 2018), pages 663-671
ISBN: 978-989-758-344-5
Copyright © 2018 by SCITEPRESS – Science and Technology Publications, Lda. All rights reserved
663

high technology in USA as two important events mostly influenced the process of human for
the twenty-first Century. On the one hand, the speed and scale of urbanization in China has already
exceeded any developed countries. Nowadays, about 15 million people from rural countries
transform to urban population every year, which pushes the urbanization rate in China to 58.52% in
2017. As the data showed, it only took 27 years for china to lift the urbanization rate from 20% to
50%, which was around twice as fast as western developed countries on average. On the other hand,
the urban agglomeration has been the dominant form in the process of urbanization in China. With
the rapid development of science, technology, transportation and communication, it presents a grand
picture that modern urban function expands to a broader area gradually and regionalization trend of
urbanization appears. At the same time, the connections and influences between cities have been
more and more intense and different sizes of cities in a certain geographical range interweave with
each other to become urban agglomeration, which occupy the key position in the global urban system
and become a brand new geographical unit participating in the global competition and international
division of labor.
Urban agglomeration contributes to increasing economic efficiency, promoting
knowledge centralization, and improving energy efficiency, which is a rather suitable spatial scale for
implementing regional sustainable development policies [1]. As an excellent example, eleven urban
agglomerations (metropolitan areas) in northeast coast, Midwest, south of California, the Gulf of
Mexico in USA aggregate 80% big cities (population>1 million) and are home to 197 million
people, almost accounting for 68% of national total population. According to the world development
report 2009 (World bank), as giant functional areas with high density, short distance and shallow
segmentation emerge, these years have seen a widespread phenomenon that urban agglomerations
were centered on large cities that are orderly arranged and divided by labor cooperation[2]. It’s
without saying that urban agglomeration is the most dynamic and potential core growth pole in the
field of economic development in the future[3].Therefore, the "12th Five-year" plan for national
economic and social development put forward policy as follows. According to the principle of
unified planning, rational layout, perfecting functions and pushing forward the small ones by
developing the big ones, and following the objective rules of urban development, depending on big
cities and focusing on small cities, gradually forming urban agglomeration with radiation effects and
foster the coordinated development of large, middle and small cities as well as small towns. President
Xi's report at 19th Party Congress further pointed out clearly that we should strive for the urban
pattern of coordinated development both large and medium-sized cities as well as small towns with
urban agglomeration as the strong emphasis. As an essential spatial carrier of urbanization, urban
agglomeration has been the focus of national regional policy. In response, the local governments
have carried out a large number of planning practice focused on urban agglomerations. It is roughly
estimated that except from Qinghai Province, Tibet Autonomous Region and a few other provinces
and cities have organized 54 urban agglomeration plans one after and other [4]. Exclusion of some
urban agglomerations overlapped spatially, there are at least 23 urban agglomerations that are well
known to the public and discussed in academic fields. What’s most discussed is that governments at
all levels lack unified standards, tend to be arbitrary, often ignore the growth and evolution tend of
urban agglomeration and transcend the stage of development when determining the planning scope.
It’s without hard work to find the underlying reasons. For one thing, urban agglomeration is a kind of
dynamic space with vague boundary and different radiation range. For another, the concept of urban
agglomeration itself remains many disputes in the academic fields and even views on the same urban
agglomeration may also differ. Also, identifying the growth boundary dynamically and reflecting on
the planning scope of urban agglomeration are the basic premises for: (1) Theoretically analyze and
deepen the academic research in urban agglomeration. (2) Scientifically predict and plan for the
urbanization process.
IWEMSE 2018 - International Workshop on Environmental Management, Science and Engineering
664

2. Methodology
2.1. Definition and concept
The definition of urban agglomeration hasn’t been in a robust consensus both at home and abroad.
The foreign terms related to urban agglomeration are as follows, Megalopolis [5], Town Cluster [6],
Courbation, Urban Agglomeration[7], Metropolitan Area[8], Desakota[9] and so on. While in China,
the corresponding terms are as follows, Urban Concentrated Region, City-and-Town Concentration
Area [10], Metropolitan Area, Metropolitan Interlocking Region [11], Metropolis [12] and so on.
After comprehensive consideration of various expressions and analyses of relevant concepts, this
paper deems that the most common and essential characteristics of urban agglomeration lie in three
aspects, that is, the centralization of national elements, the decentralization of regional elements and
the connection between cities. Besides, it’s noteworthy that metropolitan area is the basic and
indispensable component unit of urban agglomeration. Accordingly, this paper is oriented towards
the evolution of urban agglomeration, which ranges from built-up area, municipal district,
metropolitan area, joint metropolitan area (or metropolis) to metropolitan interlocking region. To be
more specific, the built-up area is physically built area within a certain city, the municipal district is a
kind of urban region under the administrative jurisdiction of a single government, the metropolitan
area is the basic functionally component unit of urban agglomeration, which links the urban and rural
closely together, and finally the joint metropolitan area and metropolitan interlocking region are the
primary forms of urban agglomeration. From the perspective of spatial scale, metropolitan area is
generally the extended linkage area of urban and rural 50 km away from the built area. Moreover, the
joint metropolitan area covers an area with a radiation radius of 100 km and the quasi metropolitan
interlocking region covers an area closely linked with a radiation radius of 200 km. The most
advanced form, metropolitan interlocking region covers an extended area with a radiation radius of
300 km. In the wake of economic development to a certain extent, the centralization of
non-agriculture industry and other urban functions commences exerting an ever-growing impact on
the surrounding areas, leading to high social and economic ties between the central city and the
surrounding areas to a certain range. On the basis of tied connections, a new form bearing the
intention of integration called Functional Urban Regions [13] thus comes into being with sharing of
resources, environment and infrastructure as well as close relevancy of industrial economic activities.
Functional urban regions are composed of the core city and its surrounding areas which maintain
close relationship with the core city, providing basic functions like residence, employment, shopping,
medical care and recreational activities [14]. Joint metropolitan area is highly connected intercity
area which is made up of several coterminous metropolitan areas with tied social and economic
connections. Following this logic, joint metropolitan area is the component unit of metropolitan
interlocking region. Metropolitan interlocking region is a giant urban and rural integration area cored
on several big cities, develops along transportation corridors and maintains strong interaction in
social and economic ties with surrounding areas [15]. For one thing, metropolitan interlocking region
itself is the result of spatial concentration of various physical and non-physical elements. For another,
metropolitan interlocking region is also the phenomenon presented in the stage of gradually
dispersed development instead of absolute concentration during the process of urbanization.
Concentration goes hand in hand with the function of hub and incubator, while the dispersion is the
reasonable logical extension of incubator. Thus, the dual processes of concentration and dispersion
strengthen the regional poly-centric structure and render continuous impetus for the metropolitan area.
Exactly in such a continuous and dynamic process under the dual interaction power of concentration
and dispersion in the urban region as the core of social life, the function of hub and incubator
mutually promotes each other and develops unceasingly, thus forming the metropolitan interlocking
region.
The Identification of Developmental Pattern of Urban Agglomerations in China based on GIS
665

2.2. Data sources
The research is bounded by mainland China territory (Hong Kong, Taiwan and Macao temporarily
excluded owning to the acquisition of data) and the research subjects includes 283 prefecture-level
cities and 2003 county-level administrative units (municipal district excluded). The statistical scope
for cities (administrative level above prefecture) is municipal district. Meanwhile, the main data
sources derives from China County Statistical Yearbook, China City Statistical Yearbook, China
Statistical Yearbook for Regional Economy and the Sixth National Population Census. To be more
discreetly academic, the statistic of urban population is subject to statistic caliber of
Sixth National Population Census.
2.3. Standards and procedures
As the basic component unit of urban agglomeration, metropolitan area is the foundation when
identifying the growth boundary of urban agglomeration. Furthermore, the essence of identifying
metropolitan area is that metropolitan area consists of central cities and peripheral counties. Drawing
lessons from related researches, this paper brings forward standards to define central cities and
peripheral counties which are suitable for China: (1) Central city. Based on the general recognition of
metropolitan area and in consideration of densely populated conditions, this paper also learns from
metropolitan statistical area in America, which divides metropolitan area into micro metropolitan and
macro metropolitan on account of central city’s population scale. With above preparations, this paper
ultimately determines the threshold population of central city at 200000. More specifically, to be
central city, the population of municipal district of prefecture-level city should be above 200000 or
the urban population of county-level city should be more than 300000. Among them, the municipal
district of prefecture-level city which lives more than 500000 people is identified as big central city.
Similarly, the municipal district of prefecture-level city which lives between 200000 and 500000
people or the county-level city which lives more than 300000 urban people is identified as small
central city. (2)Peripheral county. The county or county-level city is identified as compliant county
unit if meeting the needs of the following indexes. The urbanization rate, per capita GDP(reference to
the division standard of middle stage of industrialization by United Nations and Hollis B. Chenery),
the proportion of non-agriculture in GDP, the proportion of non-agriculture in employment, the
density of population must be more than 40%, ¥15000, 80%, 60% and 200 people/km
2
respectively.
Broken down further, compliant county directly or indirectly adjacent to the central city is identified
as adjacent compliant county. In case one county (or county-level city) can be divided into two
metropolitan areas simultaneously, the principle of administrative divisions should be applied to
determine which metropolitan area it should belong to.
Two or more metropolitan areas adjacent to each other spatially constitute a joint metropolitan
area. When developing to a relatively mature and large scale stage, joint metropolitan area evolves
into the phase of metropolitan interlocking region. Statistically, on the basis of definition for joint
metropolitan area and relevant standards, this paper selects metropolitan interlocking regions from
joint metropolitan areas by indexes like population, population density, economic density,
urbanization rate and so on. To be specific, the standards of definition are as follows: at least two
joint metropolitan areas with one extra-large city holding over 2 million people, at least 500
people/km² in population density, at least 15 million in total population and ¥25 million/km² in
economic density. Accordingly, this paper further divides satisfactory areas into two types. For those
whose population is over 2 million and economic density is more than ¥60 million/km², this paper
identifies them as metropolitan interlocking regions. For the rest, this paper identifies them as quasi
metropolitan interlocking regions which are in between.
IWEMSE 2018 - International Workshop on Environmental Management, Science and Engineering
666
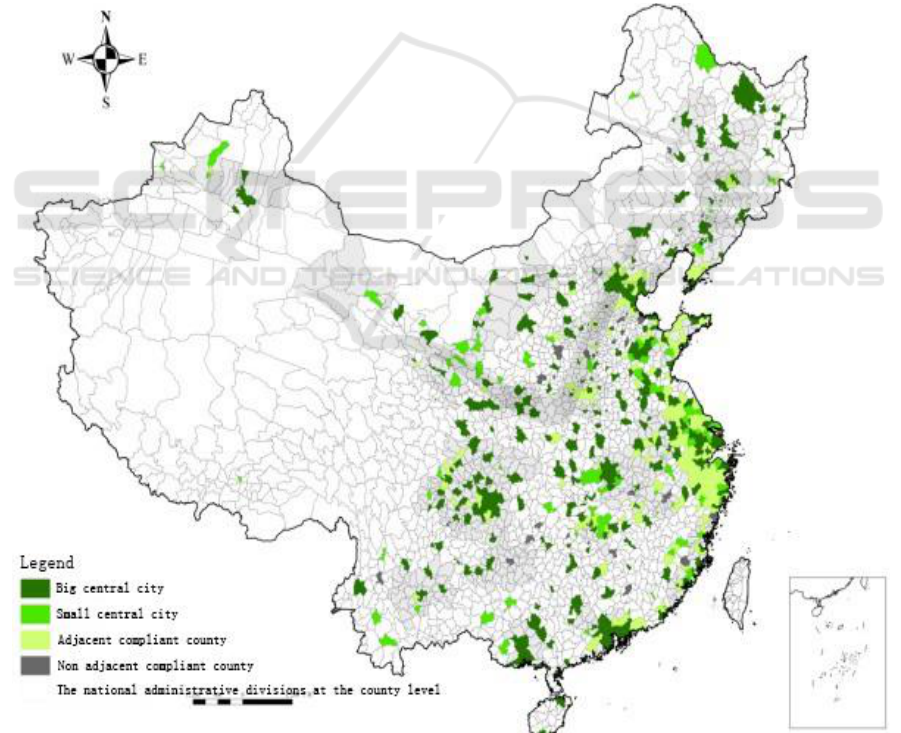
3. Results
In line with technique standards and procedures, this paper obtained the overall developmental
pattern of metropolitan areas in 2010 (Figure 1). As the result showed, there were 325 central cities
(totally 657 cities) including 239 big central cities and 86 small central cities, 228 compliant counties
(or county-level cities) including 196 peripheral counties (or adjacent compliant counties) and 32 non
adjacent compliant counties. Based on the division of metropolitan areas, this paper recognized 156
metropolitan areas (including 135 metropolitan areas without peripheral counties and 21 relatively
mature metropolitan areas with peripheral counties), 25 joint metropolitan areas (or metropolis), 3
quasi metropolitan interlocking regions and 3 metropolitan interlocking regions, collectively forming
an overall developmental pattern of urban agglomerations during the rapid urbanization process.
There were 31 urban agglomerations in all if considering the geographical units ranking above joint
metropolitan area as urban agglomerations, totally occupying 0.5977 million km², 0.495 billion
people, 0.342 billion urbanites and ¥25.82 trillion of GDP. In terms of percentage, they accounted for
36.93% of the total population, 51.46% of the urban population and achieved 64.87% of the national
GDP with only 6.23% of the national territorial area. The average economic density was ¥43.2
million/km², which was 10.41 times as many as the national average level.
Figure 1. The distribution of metropolitan areas in 2010.
The Identification of Developmental Pattern of Urban Agglomerations in China based on GIS
667

(1) The urban agglomerations centralized in eastern region while distributing dispersedly in
central and western region, expressing obvious regional distribution difference. Three metropolitan
interlocking regions were all located in the eastern coastal area and three quasi metropolitan
interlocking regions spread over eastern, central and western China. As for joint metropolitan areas,
there were 12 in eastern China, which accounted for 46.06%, 47.42% and 51.08% of entirely 25 joint
metropolitan areas in terms of total area, urban population and GDP. As for the central China, there
were 7 joint metropolitan areas, which accounted for 25.65%, 27.98% and 29.96% of entirely 25
joint metropolitan areas in terms of total area, urban population and GDP. Speaking of the western
China, there were 6 joint metropolitan areas, which accounted for 28.29%, 24.60% and 18.96% of
entirely 25 joint metropolitan areas in terms of total area, urban population and GDP (Figure 2). The
metropolitan areas in eastern China shared the attributes of high development degree, contiguous
areas and close social and economic connection with peripheral counties, which also bred joint
metropolitan areas across provincial borders such as Xuzhou and Nanjing. While in central China,
the spatial development of joint metropolitan areas can’t compete with those in eastern China, which
mostly evolved around provincial capitals, important prefecture-level cities and county-level cities
with relatively pleasing development conditions. In comparison, without enough metropolitan areas
and undeveloped peripheral counties, the spatial development of joint metropolitan areas in western
China (mainly derived from provincial capitals with exception of Sichuan and Chongqing) were the
weakest.
(2) According to the evolution logic of metropolitan area, as the basic unit, its quantity and
quanlity increased step by step along with the economic and social development. Correspondingly,
metropolitan interlocking areas grew gradually, whereas as the transitional form, the number of joint
metropolitan area saw a phased characteristic of increasing first and decreasing later. The reason lies
in that metropolitan areas had a tendency towards integration at the initial growth stage resulting in
the increasing number of joint metropolitan areas, while the joint metropolitan areas tended to
integrate into metropolitan interlocking regions constantly leading to the decreasing number of joint
metropolitan areas at the late growth stage. In 2010, the population density of Jiuquan-Jiayu Pass,
Yichun-Hegang and Sanming-Nanping joint metropolitan areas was less than 200 people/km², which
was partially responsible for entering into the critical stage not compliant with the population
definition standard. The rest 23 joint metropolitan areas grow relatively well with an average
economic density of ¥24.33 million/ km², which were 5.87 times as many as the national average
level.
(3) The urban agglomerations were chiefly distributed along the national transportation economic
development zone. As it showed, three quasi metropolitan interlocking areas and three metropolitan
interlocking areas were all located in the “T-shaped” economic development zone with four in
eastern coastal development zone and three in the Yangtze River development zone, rendering the
intersection point of the Yangtze River development zone and coastal development zone as the
biggest metropolitan interlocking area in China and even in the world (Figure 2). In 2010, these six
urban agglomerations carried 23.12% of the national population, 33.23% of the urban population,
46.62% of the national GDP and achieved an economic density of ¥ 80 million/ km² (19.12 times as
many as the national average level) with an growth area of only 0.3326 million km² (accounted for
3.46% of the total national territorial area). The rest 23 joint metropolitan areas were all distributed
along the “π-shaped” development zone with 12 in coastal area, 6 along Yangtze River and 6 along
the Gansu-Lianyun Port-Lanzhou-Xinjiang railway line.
IWEMSE 2018 - International Workshop on Environmental Management, Science and Engineering
668
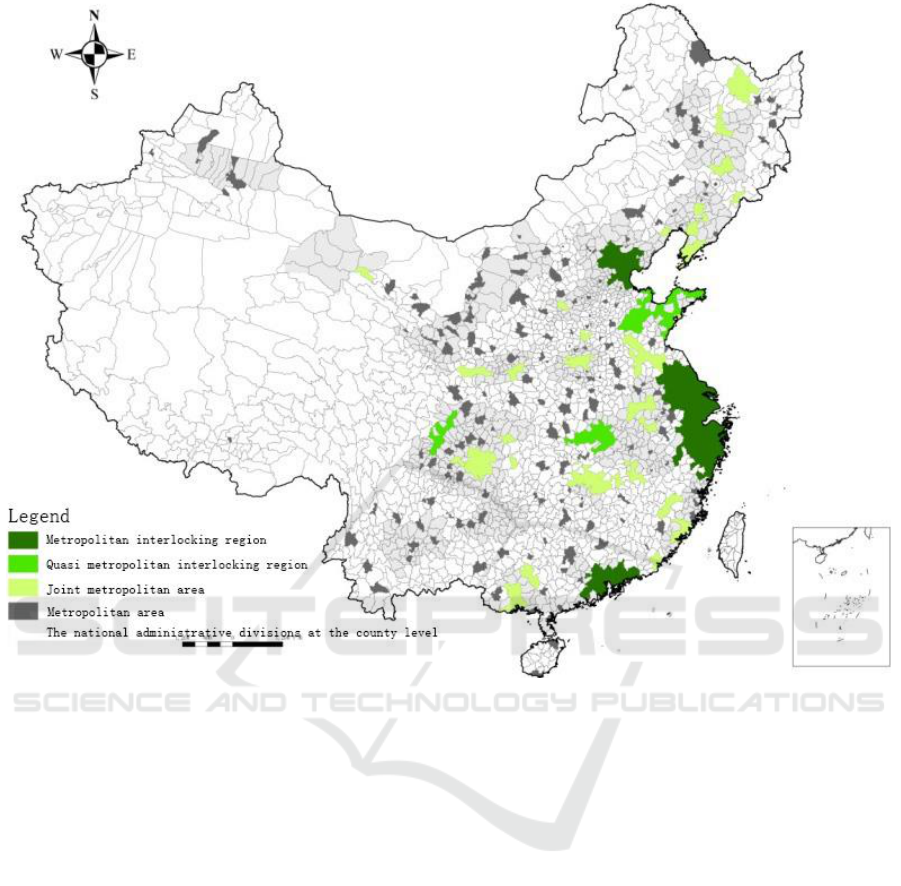
Figure 2. The developmental pattern of urban agglomerations in 2010.
4. Prospects
The strategic spatial pattern of economic development in China experienced the evolution trend form
T-shaped structure, π-shaped structure and finally to three-vertical axes and two-horizontal axes
structure, which in turn played a guiding role in the evolution of urban agglomerations’
developmental pattern. The evolution track of metropolitan area in 2000-2010 has verified that the
development axes are the important battle field and the most concentrated area for growth and
development. Accordingly, on the basis of spatial strategic structure confirmed by Major
Function-Oriented Zone Planning, this paper establishes a pattern for growth and evolution of urban
agglomerations taking transportation corridor of Europe-Asia and Yangtze River as two horizontal
axes and Coastal railway, Beijing-Harbin, Beijing-Guangzhou and Baotou-Kunming railway as three
vertical axes. On the T-shaped development axis constituted by coastal line and Yangtze River, one
giant metropolitan interlocking region, two large-scale metropolitan interlocking regions, three
metropolitan interlocking regions and one quasi metropolitan interlocking region are to evolve and
grow step by step. More specifically, they are major Yangtze River Delta giant metropolitan
interlocking region, southeast coastal large-scale metropolitan interlocking region,
Beijing-Tianjin-Hebei large-scale metropolitan interlocking region, middle reaches of Yangtze River
metropolitan interlocking region, central and southern Liaoning metropolitan interlocking region,
Chengdu-Chongqing metropolitan interlocking region and Beibu Gulf quasi metropolitan
interlocking region.
The Identification of Developmental Pattern of Urban Agglomerations in China based on GIS
669

On the economic development axis of Gansu-Lianyun Port-Lanzhou-Xinjiang Land Bridge, one
metropolitan interlocking region and two quasi metropolitan interlocking regions are to evolve and
grow step by step. On the development axis of Baotou-Kunming, two quasi metropolitan interlocking
regions are to evolve and grow. They are Hohhot-Baotou-Erdos quasi metropolitan interlocking
region and central Yunnan quasi metropolitan interlocking region. In Northeast region,
Changchun-Jilin-Tumenjiang belt-shaped quasi metropolitan interlocking region and
Harbin-daqing-Suifenhe belt-shaped quasi metropolitan interlocking region are to evolve and grow
around the Changchun-Jilin-Tumenjiang transportation corridor and Harbin-Daqing transportation
corridor. Consequently, the developmental pattern for growth and evolution of urban agglomeration
will be formed by 15 key urban agglomerations in the future, i.e. one giant metropolitan interlocking
region, two large-scale metropolitan interlocking regions, five metropolitan interlocking regions and
seven quasi metropolitan interlocking region.
Hefei and Xuzhou metropolis will integrate into Yangtze River Delta metropolitan interlocking
region together, hopefully turning into the biggest giant metropolitan interlocking region in China
and even in the world. It’s speculated that Changsha-Zhuzhou-Xiangtan joint metropolitan area and
Wanjiang metropolis will grow continuously before integrating into the Wuhan quasi metropolitan
interlocking region, which will be expected to be the biggest middle reaches of Yangtze River
metropolitan interlocking region in the central region. It’s expected that Pearl River Delta will grow
continuously with Xiamen-Zhangzhou-Quanzhou joint metropolitan area and Fuzhou metropolis in
West-Straits Economic Area along the coastal channel, gradually turning into the large-scale
metropolitan interlocking region in southeast coastal region. Stretching and growing along the Bohai
Gulf comprehensive transportation channel both southwards and northwards and
Beijing-Shijiazhuang transportation corridor southwards, Beijing-Tianjin-Hebei will mainly center its
focus on Beijing, Tianjin, Tangshan, Langfang and Baoding, forming Beijing-Tianjin-Hebei
metropolitan interlocking region. Dalian and Shenyang metropolis will grow continuously to become
central and south Liaoning metropolitan interlocking region.
Chengdu-Deyang-Mianyang-Guangyuan metropolis will come into being and interconnect and
communicate with Chongqing quasi metropolitan interlocking region so as to become the biggest
metropolitan interlocking region in the west region. As for joint metropolitan areas like
Tianshui-Baoji, Central Plains and Zhengzhou-Kaifeng-Luoyang, they are likely to connect with
each other through the Eurasian Continental Bridge, thus becoming the belt-shaped metropolitan
interlocking region in the middle reaches of Yellow River.
5. Conclusions and discussion
To sum up, setting county-level administrative division as basic analysis unit and metropolitan area
as basic component unit to identify the growth boundary of urban agglomeration brings about
advantages like more accurate results, better comparability and dynamics. However, any method has
its own limitations. The identification method based on growth boundary of urban agglomeration is
vulnerable to interference of administrative division adjustment and misleading of statistical caliber,
which may lead to the erroneous judgements like rapid growth momentum in some areas with
frequent and intensive transition from county to district or city. In addition, the specific standards in
classifying urban agglomerations are committed to certain degree of subjectivity because they are
mainly determined by expert advice and related research parameters, causing lack of compatibility in
relevant researches with different standards. Aiming at the existing drawbacks, the follow-up study is
intended to focus on two key points. For one thing, it’s better to seek the critical point of key
indicators through the empirical analysis as the specific standards in classifying urban
agglomerations. For another, from the perspective of transportation accessibility, cities’ connection
degree and construction degree, multi-dimension integration method and depiction of regional
distribution degree and connection degree will be adopted to identify the growth boundary of urban
IWEMSE 2018 - International Workshop on Environmental Management, Science and Engineering
670

agglomeration based on data mining in nighttime light data, land use, traffic network and urban
commuting data.
Acknowledgement
My paper is supported by the National Natural Science Foundation of China, grant No.41690145.
References
[1] Marull J, Galletto V, Domene E and Trullén J 2013 Emerging megaregions: A new spatial
scale to explore urban sustainability Land Use Policy 34(9): 353-366
[2] Liu C L 2009 Wuhan Metropolitan Area—Spatial Development Mechanism and Adjustment
Strategy Beijing: Science Press
[3] Allen J S 2001 Global City-regions: Trends, Theory, Policy Oxford University Press 78-87
[4] Fang C L, Yao S M and Liu S H 2010 The development report of China urban agglomeration
in 2010 Beijing: Science Press
[5] Gottmann J 1957 Megalopolis or the urbanization of the northeastern seaboard Economic
Geography 33(7): 189-200
[6] Howard E, Jin J Y trans 2000 Garden Cities of Tomorrow Beijing: The Commercial Press
[7] Geddes P 1915 Cities in Evolution: An Introduction to the Town-planning Movement and the
Study of Cities London: Williams and Norgate
[8] Scott J A 2002 Global City-Regions: Trends, Theory, Policy New York: Oxford University
Press
[9] McGee T G 1991 The emergence of Desakota region in Asia: Expanding a hypothesis In: N.
Ginsburg, B Koppel T G, McGee The extended metropolis: Settlement transition in Asia
Honolulu : University of Hawaii press
[10] Hu X W 1998 On the spatial agglomeration and dispersion in coastal regions City Planning
Review
[11] Zhou Y X 1995 Urban Geography Beijing: The Commercial Press
[12] Zhang J X, Zou J and Wu Q Y 2001 On the spatial organization of the metropolitan area City
Planning Review, 25(5): 19-22
[13] Hall P and Pain K 2006 The Polycentric Metropolis: Learning from Mega-city Regions in
Europe London: Earthscan
[14] Wang X P 2002 Metropolitan Areas Development: New urbanization stage in China Urban
Planning Forum (4): 56-59
[15] Zhou Y X 1991 The Metropolitan Interlocking Region in China a preliminary Hypothesis in
The Extended Metropolis Settlement Transition in Asia Edited by N.Ginsburgeral Honolulu
University of Hawaii press 112-126
The Identification of Developmental Pattern of Urban Agglomerations in China based on GIS
671
