
Retinal Blood Vessels Modeling based on Fuzzy Sobel Edge Detection
and Morphological Segmentation
Jan Kubicek
1
, Juraj Timkovic
2
, Marek Penhaker
1
, David Oczka
1
, Alice Krestanova
1
,
Martin Augustynek
1
and Martin Cerny
1
1
VSB–Technical University of Ostrava, FEECS, K450, 17 listopadu 15, 708 33, Ostrava–Poruba, Czech Republic
2
Clinic of Ophthalmology, University Hospital Ostrava, Czech Republic
Keywords: Retinal Blood Vessels, RetCam 3, Sobel Operator, Fuzzy, Image Edge.
Abstract: In the clinical ophthalmology, the retinal blood vessels processing represent a significant issue regarding the
clinical diagnosis. A level of the blood vessels curvature may serve as a reliable indicator of the
pathological process. For curvature estimation, a precise model of the retinal blood vessels is necessary. In
this paper, we propose a method based on the sensitive edge detector utilizing the fuzzy rules and
morphological techniques. The fuzzy edge detector is able to even detect edges while suppressing the high
frequency image noise in the non-contrast environment where the image spatial characteristics are weak.
Consequent morphological operations serve for adjustment of the segmentation procedure to obtain the
smooth model which effectively separates the retinal blood vessels from the retinal background. In the final
step, we obtain the binary mathematical model of the retinal blood vessels. We have verified the proposed
method against the gold standard images. We have applied the proposed solution on the low-contrast retinal
data from the RetCam 3 which is standard for Retinopathy of prematurity. Mostly, when using the RetCam
3, the retinal data has lower contrast therefore, the segmentation procedure is supposed to be robust, even in
the noisy environment.
1 RETINAL IMAGE
PROCESSING
Retinal image processing is one of the crucial tasks
for the ophthalmologic practice. In the retinal area
we can recognize several structures being clinically
evaluated. The optical disc (optical nerve) is
clinically perceived as a central point of the retinal
structure. It is also a starting point where the
beginning of the retinal blood vessels is observable.
Optical disc is utilized as a reference point when the
retinal lesions are present to track their dynamical
progress over the time because the optical disc
geometrical features should be stable over the time.
Regarding a lot of clinical reasons, the retinal
blood vessels are perceived as the most important
clinical structure for the retinal diagnosis. On the
base of the blood vessels curvature (clinically called
tortuosity) we can at least estimate whether the
retina exhibits signs of the pathological process.
Generally it supposed that no retinal blood vessel is
narrow, but it is curved in the whole length.
Nevertheless, we recognize an extreme curving
which can be observed as oscillating waves is some
parts of the blood vessels (Fig. 1).
Judging by a current state of the
ophthalmological practice, the software tools
allowing for automatic modeling and quantification
of the retinal blood vessels would significantly
contribute to the precise diagnosis. Currently, there
is a lack of such software instruments which would
generate the retinal mathematical models. It may be
caused by several reasons. There are more clinical
imaging alternatives for the retinal visualization,
especially fundus cameras and retinal probes. These
devices give images in different resolution, and
other spatial features. Regarding segmentation
procedure effectivity, it is supposed the worse image
features images have, the worse segmentation
accuracy we achieve. We primarily process the data
from the retinal probes (RetCam 3) which have a
worse image features, therefore the segmentation
procedure should have higher sensitivity against the
image noise, and simultaneously should be robust
even in the low-contrast environment. When
Kubicek, J., Timkovic, J., Penhaker, M., Oczka, D., Krestanova, A., Augustynek, M. and Cerny, M.
Retinal Blood Vessels Modeling based on Fuzzy Sobel Edge Detection and Morphological Segmentation.
DOI: 10.5220/0007237501210126
In Proceedings of the 12th International Joint Conference on Biomedical Engineering Systems and Technologies (BIOSTEC 2019), pages 121-126
ISBN: 978-989-758-353-7
Copyright
c
2019 by SCITEPRESS – Science and Technology Publications, Lda. All rights reserved
121
comparing with the Fundus camera data processing,
for the RetCam 3 data the segmentation procedure is
supposed to be robust even in the noisy
environment. (Tan 2016; Meng 2015; Wankhede
2015)
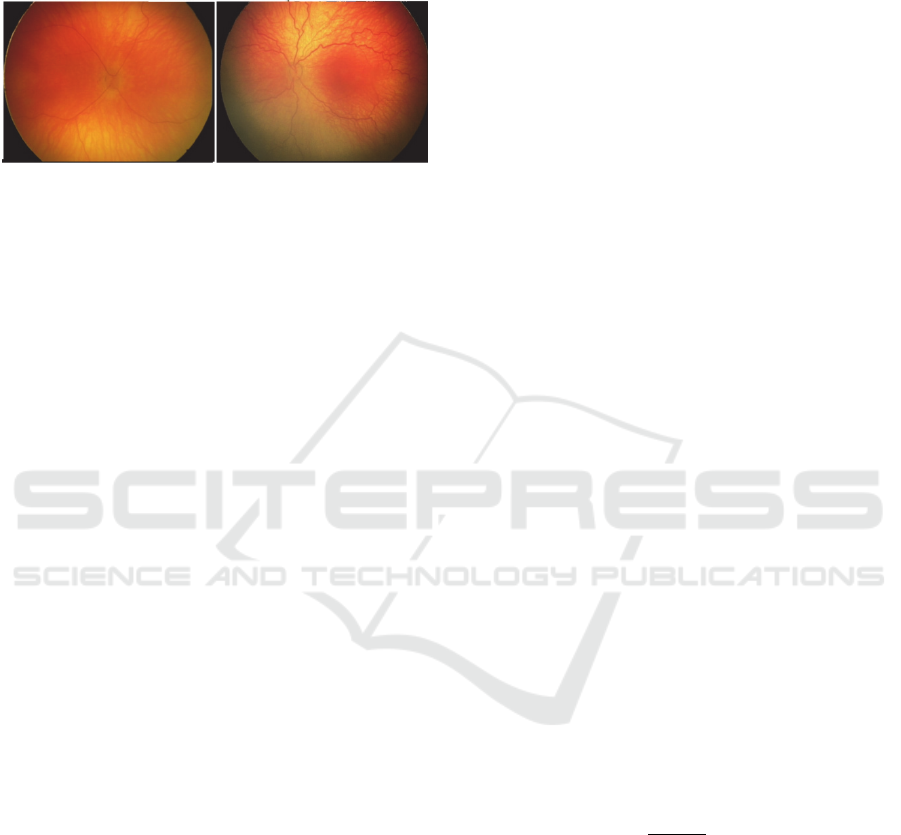
Figure 1: Comparison of a retina with the physiological
blood vessels (left) – vessels are direct, and blood vessels
having the pathological tortuosity signs in a form of the
oscillations (right).
2 RELATED WORK
Generally, there are many segmentation techniques
available in the recent literature. It is important to
mention that mostly of them are intended to the
fundus images processing having a great resolution
and other spatial characteristics. We are focused on
different type of data (RetCam 3) having
significantly different image features even though
imaging same retinal area. Therefore, research in
this area is important.
Mostly, the segmentation techniques involve
stages as the image preprocessing which is focused
to improving the contrast between the blood vessels
and retinal image background, and own
segmentation procedure which detects the blood
vessels system. The techniques can be categorized
on: (a) Kernel-based techniques (Omasundaram
2017) , (b) retinal vessel tracking (Omasundaram
2017; Mapavi 2015), (c) multiscale techniques (Ben
2018; Wang 2017; Kaur 2016; Huang 2017), (d)
model-based (Annunziata 2016; Lazar 2015), (e)
adaptive local thresholding (Palomera-Pérez 2010;
Yan 2018; Zou 2018) and (f) machine learning
(Khan 2018; Mapavi 2015).
Performance of each segmentation approach is
evaluated by many metrics. The most common
parameters are: True positive rate (TPR), average
false positive rate (FPR), average sensitivity (TPR),
average specificity (FPR), average accuracy and
precision. From the view of the clinical practice,
sensitivity and specificity represent the most
frequently metrics in the medical research. The
higher specificity and sensitivity we achieve, the
better results we obtain. (Hatanaka 2018)
The recent literature does not contain a lot of
information about the processing the low-contrast
retinal images. Since the most of the presented
algorithms have been primarily tested on the fundus
images having a great resolution we have no
information about robustness and sensitivity of the
segmentation methods for the low-contrast images.
Our paper just brings a significant contribution in
this area. (Omasundaram 2017), (Melo, 2018)
3 DESIGN OF SEGMENTATION
METHOD
In this section, we introduce a segmentation
algorithm for modeling of the retinal blood vessels.
In our approach, we want to avoid using the image
preprocessing as one of the conventional steps of
many approaches. The image preprocessing intended
for an improvement of the spatial image
characteristic with the goal of contrast boosting
between blood vessels and adjacent retinal
structures. Unfortunately, each preprocessing
algorithm at least partially modifies the pixel’s
intensity characteristics. Thus, the original clinical
information is modified. In our approach, we
consciously exclude these procedures. The proposed
algorithm is composed from two essential parts
including the edge detection and morphological
segmentation procedure.
3.1 Sobel Operator Driven by Fuzzy
Logic Rules
The Sobel operator belongs to a group of the
gradient edge detectors. This method computes
partial derivation of the image signal in the
horizontal (
) and vertical direction (
).
Image gradient representing the edges in both
directions is given:
|
|
(1)
Generally, the main disadvantage of the gradient
edge operator is an inclination to the image noise
having significantly different intensity spectrum than
the image background. This phenomenon is given by
the hard thresholding of the horizontal and vertical
gradient. Such hard thresholding is not capable
classifying the image edge and noise.
We have optimized the Sobel operator by using
the fuzzy rules. In the fuzzy model, each gradient
direction is characterized by the Gaussian
BIODEVICES 2019 - 12th International Conference on Biomedical Electronics and Devices
122
membership function (Fig. 2). The final
classification of the edge pixels is driven by the
triangular membership function (Fig. 3).
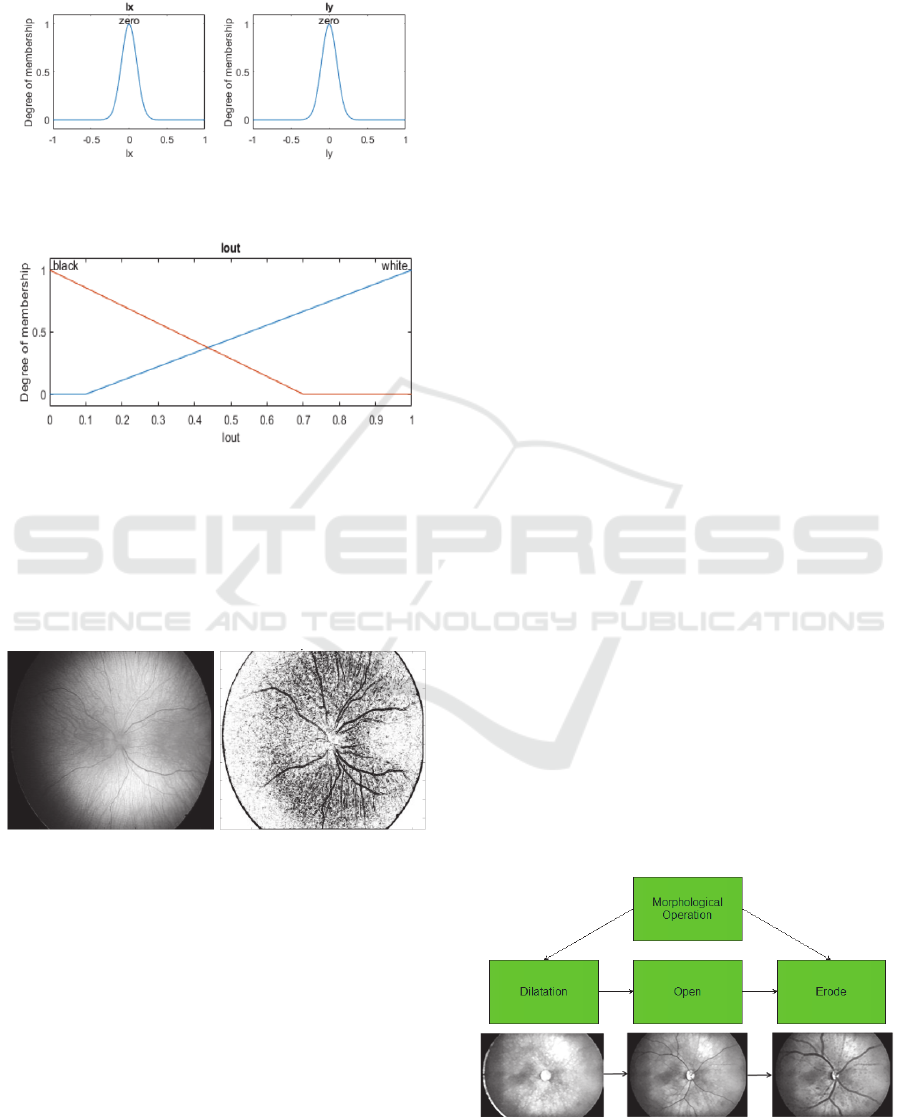
Figure 2: Gaussians membership functions for horizontal
gradient (
) and vertical gradient (
).
Figure 3: Triangular membership functions representing
the edge classification.
On the Fig. 4, we report the fuzzy edge detection
on the non-contrast retinal image. Important aspect
of the detector is an elimination of the optical disc,
and simultaneous boosting of the retinal blood
vessels.
Figure 4: Native retinal image from the RetCam 3 with
resolution 640x480 px (left) and result of the Sobel
detector driven by the fuzzy rules (right).
3.2 Morphological Image Segmentation
Morphological operations are commonly intended
for adjustment of the binary images. In our
approach, we are using a sequence of the
morphological operations for adjustment of the
spatial characteristic of the retinal blood vessels.
Firstly, we apply the morphological dilatation.
Dilatation sums of two sets with using of the
Minkowski sum. By applying this procedure, we
achieve the object expansion in the binary image,
and mainly filling the holes. Such procedure
compensates a sensitivity of the edge detection when
non-homogenous intensity distribution. The
dilatation is defined by the following way:
⨁ ∈
,,∈,∈
(2)
Where X stands for the binary image and B is the
structural element, characterizing a shape of the
dilatation. Here, we are using the square matrix 3x3.
In the next step, we are using the morphological
closing as the dilatation with erosion with the same
structural element. By this procedure, we achieve
smoothing curves better representing the real blood
vessels connecting of tiny holes and also removing
of small holes. Closing is similar in some ways to
dilation in that it tends to enlarge the boundaries of
foreground (bright) regions in an image (and shrink
background color holes in such regions), but it is
less destructive of the original boundary shape. The
morphological operation closing is defined by the
following expression:
∘ ⨁⊝
(3)
In the last part of the segmentation model, the
binary skeleton is applied. We need to represent the
blood vessels by one pixel line thickness in order to
mathematically describe curvature of the individual
blood vessel’s pixels. Output is a typological
skeleton precisely describing shape of retinal blood
vessel system. This process is given by the following
definition:
⨁⨂
(4)
This iteration process is terminated when two
gradual steps achieve same results.
⨁
⨁
⨁
…⨁
(5)
Individual steps of the morphological operations are
depicted on the Fig. 5.
Figure 5: Process of the morphological operations:
dilatation, morphological opening and erosion.
Retinal Blood Vessels Modeling based on Fuzzy Sobel Edge Detection and Morphological Segmentation
123

4 TESTING AND QUANTITATIVE
COMPARISON
We cooperate with the Ophthalmological clinic of
the University hospital of Ostrava on the task of the
retinal blood vessels processing. We were given a
dataset containing 120 patients. These images have
been used for the testing of the segmentation
algorithm. This database is structuralized into
physiological and pathological blood vessels. All the
data have been acquired by the retinal probe RetCam
3 having the image resolution 640x480 px.
The input data are stored in the RGB format
being represented by three dimensional matrixes.
Each such matrix represents one channel of the RGB
model. We have experimentally found out that G
channel reliably reflects area of the blood vessels
while other channels nearly do not bring information
about the retinal blood vessels. Therefore, we have
done the RGB model decomposition with
consequent extraction of the G (green) channel (Fig.
6).
Figure 6: Extraction of green channel (left) and its
monochromatic conversion (right).
For the testing, we have divided the retinal
records into two groups, depending on their spatial
characteristics: contrast and non-contrast data. Since
it cannot be ensured that data will be always
acquired in a good contrast, we are primarily
focused on the non-contrast data to demonstrate
segmentation function in a worse environment (Fig.
7). The segmentation results are provided in the
binary mathematical model classifying the blood
vessels (white) from the image background (black).
Figure 7: Testing extract of the segmentation procedure
for four non-contrast native images.
In the last part of the model building, retinal
blood vessel have been skeletonized and fused.
Image fusion is an important procedure performing
the overlaying of the binary model with the native
records (Fig. 8).
Figure 8: Native retinal data (left column), binary skeleton
(middle column) and image fusion (right column).
In the last part of the analysis, we have performed a
quantitative comparison to objectification of the
segmentation process. We have analyzed the
segmentation performance against the ground truth
data representing the gold standard. This gold
standard has been done by the manual segmentation
performed by the clinical ophthalmologic expert. In
order to proper testing of the segmentation
robustness, we have done a comparison against
native image data and same records corrupted by the
salt and pepper noise and Gaussian noise.
The segmentation performance has been
evaluated based on the four metrics. Rand index (RI)
measures a level of the similarity between the binary
model against the gold standard. Structural similarity
(SSIM) measures a mutual structure. 2D correlation
(2D corr) measures a level of the linear dependence.
These parameters are normalized in a range [0; 1]
where 0 indicates no similarity, contrarily 1 stands
for completely identical results. A last parameter is
the Mean Squared Error (MSE) which measures an
average quadratic difference between the
segmentation result and the gold standard. Average
values of the parameters are reported in the Table 1.
Table 1: Quantitative comparison of the segmentation
model against the gold standard.
Native
data
Gaussian
noise
(0.1, 0.05)
Gaussian
noise
(0.1, 0.1)
Salt and
Pepper
(0.05)
Salt and
Pepper
(0.1)
Salt and
Pepper
(0.3)
RI
0.91 0.84 0.77 0.83 0.78 0.71
SSIM
0.84 0.65 0.55 0.89 0.66 0.61
2
D cor
r
0.98 0.91 0.88 0.87 0.74 0.65
MSE
33.12 36.22 41.21 35.88 51.12 55.67
Based on the quantitative comparison it is apparent
that artificial noise slightly influences the
BIODEVICES 2019 - 12th International Conference on Biomedical Electronics and Devices
124

segmentations results. The worst results are reported
when adding the Salt and Pepper noise. This noise is
strongly manifested as the binary signal which
significantly visually impairs the native retinal data.
5 CONCLUSIONS
The retinal image analysis has a significant impact
to practice of the clinical ophthalmology. In
comparison with the subjective analysis performed
by the clinical experts, the automatic segmentation
and modeling has unexceptionable benefits. Mainly,
it’s a relevant reproducibility of the clinical results
and features extraction allowing for classification of
the pathological blood vessels.
In our work, we have proposed the segmentation
model based on a combined approach of the Sobel
edge detector driven by the fuzzy rules and the
morphological operations. Conventional gradient
edge detectors lack of robustness in the noisy
environment, and insufficient contrast. It is also case
of the processing the retinal records from the retinal
probes which typically have lower resolution and
worse spatial features. Soft gradient thresholding of
the edge detector ensures robustness against image
noise. Judging by the experimental results, the fuzzy
edge detector is capable of efficiently detect contour
of the low-contrast blood vessels contours.
The morphological operations serve for
optimization of the edge detector with a target of
suppressing image noise and inhomogeneity. Final
model of the blood vessels is given by the blood
vessels skeleton and image fusion. We have
analyzed the blood vessels modeling against the gold
standard images. We have analyzed native image
records and noisy images (Gaussian and Salt and
Pepper noise). Judging by the results, the
segmentation model is able to reliably work even in
the noisy environment. It is a good prediction for
using in the clinical conditions where we cannot
ensure stable conditions of measurement.
ACKNOWLEDGMENTS
The work and the contributions were supported by
the project SV4508811/2101Biomedical
Engineering Systems XIV’. This study was also
supported by the research project The Czech Science
Foundation (GACR) 2017 No. 17-03037S
Investment evaluation of medical device
development run at the Faculty of Informatics and
Management, University of Hradec Kralove, Czech
Republic. This study was supported by the research
project The Czech Science Foundation (TACR)
ETA No. TL01000302 Medical Devices
development as an effective investment for public
and private entities.
REFERENCES
Tan, J.H., Acharya, U.R., Chua, K.C., Cheng, C., Laude,
A., 2016. Automated extraction of retinal vasculature
in Medical Physics, 43 (5), pp. 2311-2322, 2016.
Meng, X., Yin, Y., Yang, G., Han, Z., Yan, X., 2015. A
framework for retinal vasculature segmentation based
on matched filters in BioMedical Engineering Online,
14 (1), art. no. 94, 2015.
Wankhede, P.R., Khanchandani, K.B., 2015. Retinal blood
vessel segmentation using graph cut analysis” in
International Conference on Industrial
Instrumentation and Control, ICIC , art. no. 7150973,
pp. 1429-1432, 2015.
Ben Abdallah, M., Azar, A.T., Guedri, H., Malek, J.,
Belmabrouk, H., 2018. Noise-estimation-based
anisotropic diffusion approach for retinal blood vessel
segmentation in Neural Computing and Applications,
29 (8), pp. 159-180, 2018.
Wang, R., Zheng, L., Xiong, C., Qiu, C., Li, H., Hou, X.,
Sheng, B., Li, P., Wu, Q. Retinal optic disc
localization using convergence tracking of blood
vessels in Multimedia Tools and Applications, 76 (22),
pp. 23309-23331, 2017.
Kaur, J., Kaur, N., Acharyya, M., Kapoor, N., Chatterjee,
S., Gupta, S.2016. An effective algorithm for
automatic measurement of vessel calibre in retinal
fundus images in 5th International Conference on
Wireless Networks and Embedded Systems, WECON,
art. no. 7993466, 2016.
Huang, W.-B., Wang, K., Yan, Y., 2017 Automatic
detection method of blood vessel for color retina
fundus images Guangxue Jingmi Gongcheng/Optics
and Precision Engineering, 25 (5), pp. 1378-1386,
2017.
Annunziata, R., Garzelli, A., Ballerini, L., Mecocci, A.,
Trucco, E., 2016. Leveraging Multiscale Hessian-
Based Enhancement with a Novel Exudate Inpainting
Technique for Retinal Vessel Segmentation” in IEEE
Journal of Biomedical and Health Informatics, 20 (4),
art. no. 7115900, pp. 1129-1138, 2016.
Lázár, I., Hajdu, A., 2015 Segmentation of retinal vessels
by means of directional response vector similarity and
region growing in Computers in Biology and
Medicine, 66, pp. 209-221, 2015.
Palomera-Pérez, M.A., Martinez-Perez, M.E., Benítez-
Pérez, H., Ortega-Arjona, J.L., 2010. Parallel
multiscale feature extraction and region growing:
Application in retinal blood vessel detection IEEE
Transactions on Information Technology in
Retinal Blood Vessels Modeling based on Fuzzy Sobel Edge Detection and Morphological Segmentation
125

Biomedicine, 14 (2), art. no. 5352330, pp. 500-506,
2010.
Yan, Z., Yang, X., Cheng, K.-T,. 2018. A Skeletal
Similarity Metric for Quality Evaluation of Retinal
Vessel Segmentation in IEEE Transactions on
Medical Imaging, 37 (4), pp. 1045-1057, 2018.
Zou, B., Chen, C., Zhu, C., Duan, X., Chen, Z., 2018.
Classified optic disc localization algorithm based on
verification model in COMPUTERS AND GRAPHICS
(Pergamon), 70, pp. 281-287, 2018.
Khan, K.B., Khaliq, A.A., Jalil, A., Shahid, M., 2018. A
robust technique based on VLM and Frangi filter for
retinal vessel extraction and denoising in PLoS ONE,
13 (2), art. no. e0192203, 2018.
Mapayi, T., Viriri, S., Tapamo, J.-R., 2015. Adaptive
thresholding technique for retinal vessel segmentation
based on glcm-energy information in Computational
and Mathematical Methods in Medicine, 2015, art. no.
597475, 2015.
Machine learning identification of diabetic retinopathy
from fundus images in 2014 IEEE Signal Processing
in Medicine and Biology Symposium, IEEE SPM 2014
- Proceedings, art. no. 7002949 urudath, N., Celenk,
M., Riley, H.B, 2015.
Hatanaka, Y., Samo, K., Ogohara, K., W., 2018.
Sunayama, Muramatsu, C., Okumura, S., Fujita, H.
Automated blood vessel extraction based on high-
order local autocorrelation features on retinal images
in Lecture Notes in Computational Vision and
Biomechanics, 27, pp. 803-810, 2018.
Omasundaram, S.K., Alli, P., 2017. A Machine Learning
Ensemble Classifier for Early Prediction of Diabetic
Retinopathy in Journal of Medical Systems, 41 (12),
art. no. 201, 2017.
Melo, D., Costa, J., Soares, F., Vieira, P. Optical design of
a compact image acquisition device for mobile
diabetic retinopathy screening (2018) BIODEVICES
2018 - 11th International Conference on Biomedical
Electronics and Devices, Proceedings; Part of 11th
International Joint Conference on Biomedical
Engineering Systems and Technologies, BIOSTEC
2018, 1, pp. 63-70.
BIODEVICES 2019 - 12th International Conference on Biomedical Electronics and Devices
126
