
Generation of Approximate 2D and 3D Floor Plans from 3D Point Clouds
Vladeta Stojanovic, Matthias Trapp, Rico Richter and J
¨
urgen D
¨
ollner
Computer Graphics Systems Group, Hasso Plattner Institute, University of Potsdam, Germany
Keywords:
Floor Plan, 3D Point Clouds, BIM, Boundary Detection, Vector Graphics.
Abstract:
We present an approach for generating approximate 2D and 3D floor plans derived from 3D point clouds. The
plans are approximate boundary representations of built indoor structures. The algorithm slices the 3D point
cloud, combines concave primary boundary shape detection and regularization algorithms, as well as k-means
clustering for detection of secondary boundaries. The algorithm can also generate 3D floor plan meshes based
on extruding 2D floor plan vector paths. The experimental results demonstrate that approximate 2D vector-
based and 3D mesh-based floor plans can be efficiently created within a given accuracy for typical indoor
3D point clouds. In particular, the approach allows for generating on-the-fly floor plan representations. It is
implemented as a client-side web application, thus making it adaptable as a lightweight solution or component
for service-oriented use. Approximate floor plans can be used as base data for manifold applications in various
Architecture, Engineering and Construction domains.
1 INTRODUCTION
Architecture, Engineering and Construction (AEC)
practitioners frequently capture the as-is built envi-
ronment by means of 3D point clouds, which can rep-
resent, for example, both the exterior and interior of
buildings. A 2D floor plan commonly provides an
overview used to assess the dimensions of a room and
other structural features. Floor plans can also sup-
port tasks for navigation and routing within a build-
ing, such as emergency route planning or heavy ma-
chinery management. 3D floor plans can further in-
crease stakeholder engagement by enhancing 3D vi-
sualizations or for initial assessment of the state of
the building (e.g., energy usage and capacity simu-
lation and visualization). They can be generated by
various remote-sensing and scanning approaches; 3D
reconstruction based on image and video data appears
to be a cost-efficient way to quickly generate an up-
to-date scan of the interior of a building. By approx-
imate floor plans, we refer to floor plans having lim-
ited precision, correctness, and completeness; they do
not raise the claim to be architectural plans, but serve
the needs of a growing number of applications that
require principal information about an indoor space.
(Alzantot and Youssef, 2012) generates floor plans us-
ing motion traces recorded on mobile devices, which
are in turn used alongside point cloud segmentation
and clustering methods to generate layouts of rooms
in a building. The approach of (Okorn et al., 2010)
(a) (b) (c)
Figure 1: (a) Examples of floor plans for a 3D point cloud
of a building’s interior. (b) A 2D vector contour around
the horizontal point cloud slice, and (c) an extruded 3D
mesh representation of the primary 2D floor plan bound-
aries based on the generated vector contours.
uses voxelization of point clusters obtained from tak-
ing vertical slices of the point cloud scan to generate
histograms used to detect outlines of walls, floor and
ceilings for floor plan generation. Point clouds can
also represent multistory indoor environments, and
can be segmented and used as floor plan representa-
tions (Li et al., 2018).
Problem Statement and Approach. Our approach
addresses the problem of efficiently generating ap-
proximate 2D and 3D boundary representations of
building interiors from unstructured 3D point clouds.
We focus on detection and evaluation of primary
(PB) and secondary (SB) boundary elements; Fig. 1
illustrates examples of an approximate floor plan.
The main challenges include selection of appropri-
ated point cloud vertical segmentation layers, evalu-
ation and regularization of PBs and SBs, and genera-
Stojanovic, V., Trapp, M., Richter, R. and Döllner, J.
Generation of Approximate 2D and 3D Floor Plans from 3D Point Clouds.
DOI: 10.5220/0007247601770184
In Proceedings of the 14th International Joint Conference on Computer Vision, Imaging and Computer Graphics Theory and Applications (VISIGRAPP 2019), pages 177-184
ISBN: 978-989-758-354-4
Copyright
c
2019 by SCITEPRESS – Science and Technology Publications, Lda. All rights reserved
177

tion of vector image data for use as 2D image or 3D
mesh-based representations. The expected result of
the approach is a 2D vector image containing regular-
ized PB and SB evaluations of significant floor plan
elements (e.g., walls, room partitions, structural ele-
ments, floors and ceilings). Additionally, a 3D mesh
representation generated via extrusion of vector im-
age paths and subsequent Boolean operations on the
mesh geometry are also required. Our research ad-
dresses these challenges with the following contribu-
tions: 1) We present and discuss our method for gen-
erating concave contours of the PBs using extracted
floor plan slices—by default our approach also sup-
ports generation and evaluation of convex contours.
2) We discuss the use of k-means clustering to detect
SBs within the 2D point cloud slice where additional
holes or solid features may be found (e.g., a support
beam column within an open plan office). 3) We
present our results for both 2D vector representations
of floor plans and generated 3D floor plan meshes.
The approach has been implemented as a prototypical
web-based application that we used to generate ex-
perimental results. It is designed to be a lightweight
solution for floor plan approximation, so it can be de-
ployed as a web-based application or integrated as a
component in a larger service-oriented architecture.
2 RELATED WORK
Boundary Rasterization. Extracting 2D and 3D
boundary shapes from 3D point clouds is a challeng-
ing process—the segmentation method is key; an ex-
tensive overview of segmentation methods is given by
(Nguyen and Le, 2013). The interactive indoor navi-
gation system by (Liu et al., 2017) is based on a 3D
game engine, using existing CAD floor plans and GIS
maps, but does not generate floor plans for the as-
is built environment state. However, their use of 2D
CAD and GIS map data for generation of extruded
3D volumes is influential. Research by (Ambrus
et al., 2017) has investigated using energy minimiza-
tion, along with the flood-filling algorithm (Heckbert,
1990), to generate 2D floor plan projections from seg-
mented 3D point cloud data. (Valero et al., 2012)
describes a method where using maximum and min-
imum spatial dimensions of 3D points in the verti-
cal plane, the ceiling and the floor planes can be ex-
tracted, and their outline can be used to further trace
the contours of walls for floor plan generation. We
use a similar vertical segmentation approach to select
and extract horizontal point cloud slices for 2D floor
plan generation, though our approach is more suited
towards real-time 2D and 3D visualization, as we fo-
cus on generation of 2D vector contours and triangu-
lar 3D floor plan meshes rather than Boundary Repre-
sentation Models (B-Rep) from point clouds. (Turner
and Zakhor, 2014) generate simplified 2D floor plan
representations, in addition to using point cloud data
as basis for generating a triangulated 3D mesh that is
simplified and extruded. We make use of the same 3D
mesh extrusion approach, but we regularize the vector
paths before extrusion to generate non-noisy 3D wall
shapes (Sec. 3.4). (Previtali et al., 2014) automati-
cally reconstructs cluttered building rooms from 3D
point cloud data, where they also use cell complex la-
beling to construct horizontal outlines of wall shapes
obtained using a binary occupancy raster map.
Point Cloud Boundary Evaluations. The Hough
Transform method is a popular method for detect-
ing vertical line segments (Ballard, 1981). While this
method works well for a small number of line seg-
ments based on a number of points in a 2D image, it
becomes impractical for detecting lines that include
missing segments, as well as curved shapes. More
flexible methods rely on the use of concave outline
generation algorithms. One popular variant of this is
α-shapes detection (Akkiraju et al., 1995), which is
able to detect all boundary regions within a given set
(including SBs), up to a certain degree of accuracy.
Usage of α-shapes is basis for the α-shape algorithm,
which has been described previously by (Wei, 2008)
for boundary extraction of concave and convex poly-
gons from point cloud data. We evaluate the use of the
α-shape algorithm against the Gift Opening algorithm
(Rosen et al., 2014) for PB evaluation (Sec. 3 and
Sec. 4). A notable approach by (Pohl and Feldmann,
2016) is able to generate squared outlines of 2D point
clouds for PB detection, in addition to detection of
SBs by evaluation of distances between neighboring
points. Their approach influenced our SB detection
method, but instead we mostly focus on non-dense,
vertically segmented 3D point clouds and finer curved
boundary approximation. Research by (Ikehata et al.,
2015) presents an approach for indoor modeling using
a structured graph representation, where room seg-
mentation from 3D point clouds is achieved using
k-means clustering combined with evaluation of 2D
binary and free-space coverage maps. Their use of
k-means clustering algorithm for room segmentation
and labeling inspired us to implement its use for eval-
uation of SBs.
Floor Plan Visualization Methods. An example of
context visualization of 3D indoor models using level
of detail adaptation is described by (Hagedorn et al.,
2009). In 2D representations of floor plan spaces,
GRAPP 2019 - 14th International Conference on Computer Graphics Theory and Applications
178

solid areas can be represented as lines with varying
width, while in 3D visualization these contours can be
extruded by using the path and widths of 2D vector
lines (Feiner et al., 1990). Visualization of 2D out-
lines for floor plans can be realized with the use of
vector graphics. The Scalable Vector Graphics (SVG)
file format allows for the representation of 2D shapes
in a lossless and XML-based descriptive file format,
and is supported in conjunction with other web visu-
alization standards (Duce et al., 2002). Furthermore,
(Gai and Wang, 2015) discuss the development and
evaluation of a web-based 3D visualization system
for building floor plans, where solid 3D volumes of
building floors are extruded and labeled using floor
plan data stored as 2D SVG image components. We
use this extrusion approach for generating the approx-
imated 3D floor plan meshes of PBs.
Figure 2: Selection of an appropriate vertical segmentation
layer for floor plan generation using an AABB (left), sam-
pled from the height-based segmentation of an office room
3D point cloud (right).
3 GENERATION OF FLOOR
PLAN BOUNDARIES
Extraction of 2D Floor Plan Slices. We assume
that the 3D point cloud scan of the building contains
planar walls, which are used to partition the interior
space. While the walls can be of any material or type,
they must be able to be captured and represented in a
3D point cloud. We then generate the 2D horizontal
point cloud layers by segmenting the 3D point cloud
into three vertical levels—based on the minimum, av-
erage, and maximum height of the points in the 3D
reference coordinate system. We currently select the
vertical level used to generate a floor plan by comput-
ing an axis-aligned bounding box (AABB) for each
of the three vertical levels, and use the level with the
highest number of points in the AABB for floor plan
generation (Fig. 2). We assume that the point cloud
represents a standard office interior, and that it does
not have any significant missing segments. For that
reason, three vertical layers are sufficient for the ver-
tical segmentation.
In most cases, however, segmented layers with
higher or lower point density can be used. Outlier
points are removed as they are typically points that
are a certain threshold distance away from the main
point cluster and are not part of dense point clusters
(with respect to the overall distribution of point clus-
ters). The maximum height of the 3D point cloud is
typically based on the maximum wall height of the
points in a given room scan. We can use any of the
segmented layers to generate the floor plan, but usu-
ally the mid or top layers are used as they do not nec-
essarily feature any gaps in the wall segments such as
door frames (such elements can be added manually
using CSG operations). Next we extract the X and
Z Cartesian coordinates of the points from the seg-
mented horizontal layer and export these as a Comma
Separated Value (CSV) data file. The orientation of
the 3D point cloud is set prior to extraction of the X
and Z coordinates using the software tool CloudCom-
pare (Girardeau-Montaut, 2011). CloudCompare can
also be used to segmented out features such as office
furniture, which are not required for the floor plan
boundary approximation. Instead, we deal only with
vertically segmented layers for a faster approximation
of floor plan contours. A more complex approach
has been implemented by (Oesau et al., 2014), which
extracts horizontal slices from raw point clouds that
feature the highest number of cluttered point distribu-
tions, whose computed normals are within the parallel
threshold to the direction of the vertical segmentation
(thus assumed to represent walls).
Concave Hull Generation and Regularization.
The generation of the concave hull is accomplished
using the Gift Opening algorithm described by (Rosen
et al., 2014). The algorithm works by iterative calcu-
lation of the convex hull using the standard Divide
and Conquer algorithm before converting the best
point candidate set into a concave hull (by means of
convex hull edge collapsing). We also evaluated the
use of the α-shape algorithm, but found it to be too
sensitive when attempting to detect narrow spaces in
the 2D horizontal point cloud slices. Regularization
of the concave hull requires the use of line regular-
ization algorithms, each of which have their strengths
and weaknesses when attempting regularize various
elements of the concave hull. The regularization of
the generated concave hull lines is accomplished by a
combination of the Douglas-Peucker algorithm (Dou-
glas and Peucker, 1973), the Visvalingam algorithm
(Visvalingam and Whyatt, 1993), and radial distance
simplification (Koning, 2011). Through experimenta-
tion, we found that all three methods need to be com-
bined to achieve a desirable line regularization result
Generation of Approximate 2D and 3D Floor Plans from 3D Point Clouds
179

that both preserves the visual fidelity of the concave
shape and simplifies noisy edges (making it suitable
for floor plan contour approximation). Selection of
the line simplification algorithms was established af-
ter reviewing existing implementations (Shi and Che-
ung, 2006), and testing the selected algorithms on 2D
point cloud slices. Additionally, we evaluated each of
the three regularization algorithms separately. The ra-
dial distance simplification method does not smooth
out very noisy lines, while the Douglas-Peucker al-
gorithm can over-evaluate straight line elements that
have breaks in them, thus introducing dents in the line
regularization. The Visvalingam algorithms preserves
the overall shape of the the concave hull, but intro-
duces smoother corner evaluations.
Line Path Generation. The vector line paths that
form the geometric boundary representation are gen-
erated from the point set of the regularized lines. We
make use of the HTML5 Canvas API to draw line
strokes with varying widths, forming a line contour
along each of the points. These contours are then used
as the basis for the boundary representation, and can
also be used as paths for extruding 3D shapes used
for generating the 3D floor plan mesh. These vec-
tor contours are then exported as SVG vector paths.
One disadvantage of using the SVG file format is that
any geo-references contained in the original 3D point
cloud must be included separately (usually as JSON
data), and the corresponding SVG image must be re-
projected (if specific geo-referencing is required).
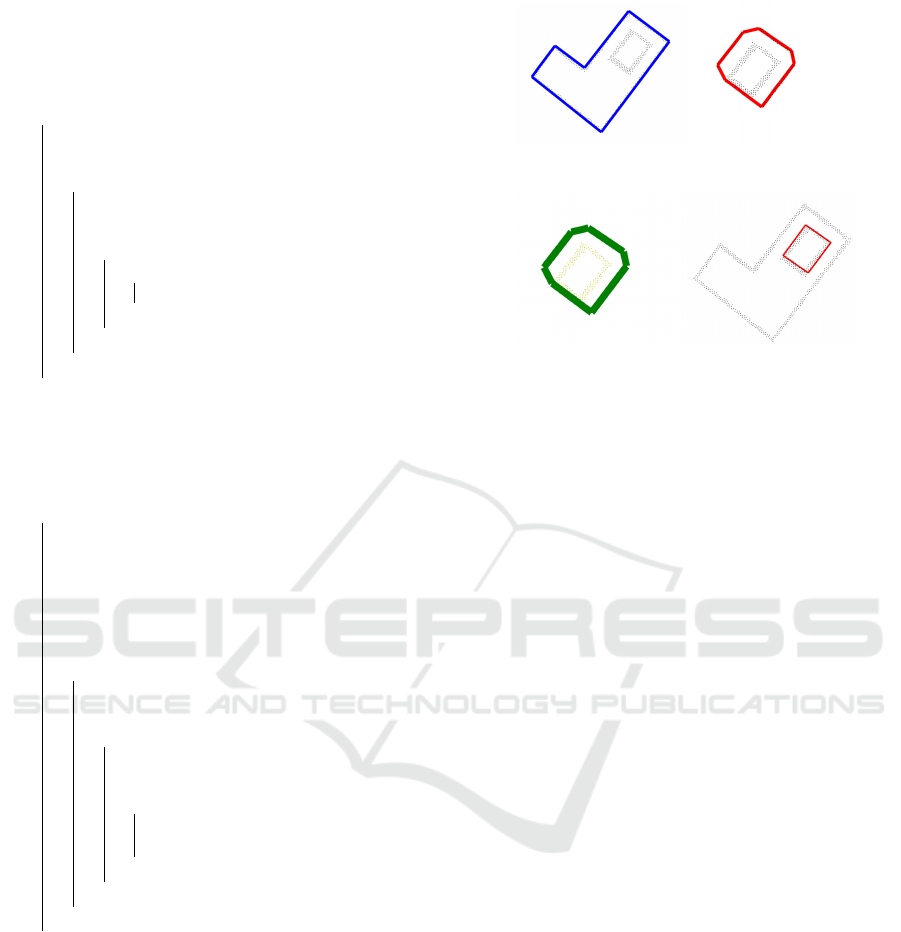
3.1 Detecting SBs
One particular challenge of generating 2D vector floor
plans is detecting smaller closed boundaries inside
the PB of a given floor plan partition. For example,
the 2D horizontal point cloud slice may contain the
walls of a smaller room or region within a larger room
that is not connected to the PB walls (e.g., an ele-
vator or office cubicle), thus the resulting floor plan
slice may contain what can be described as SBs. A
challenge arises on how to detect these SBs to gen-
erate their regularized concave contours (Fig. 3(d)).
The Gift Opening algorithm applied for concave gen-
eration only works on closed point sets that form a
PB, and the α-shape algorithm cannot detect SBs cor-
rectly unless there is a clear distance to the PB, so we
need to use a new approach. We decided to imple-
ment k-means clustering as a method to detect point
regions in a 2D horizontal slice that have a higher
concentration of points, and to cluster them as po-
tential regions for SB generation (Fig. 3(a)). We do
not generally sample the floor and ceiling parts of a
floor plan partition for k-means clustering that contain
homogeneous and continuous distributions of points,
as there would be no distinguishable concentration of
point clusters. The k-means cluster that contains the
highest number of points is assumed to be the cluster
that contains points representing the SB. The num-
ber of k-means clusters is set as the number of sec-
ondary boundaries plus one (SBs are determined vi-
sually prior to approximation, though other methods
exist to heuristically determine a number of required
clusters (Birodkar and Edla, 2014)). This is described
in Alg. 1 as the GenerateSecondaryBounds function,
which passes in the point set from the current k-means
cluster of a floor plan partition where the SB is lo-
cated, along with the PB line segments.
SB Evaluation Implementation. Alg. 1 first com-
putes the average distance between all the points
in the cluster with the AvgDist function call. This
function randomly samples a given percentage of the
points in the given cluster (taken as 75%, though this
is can be adjusted if required), and returns the av-
erage distance between them. We then obtain the
2D coordinates of the current k-means center point
from a given cluster with the CenterPoint function
call. This distance value Dist is tested to see if it is
smaller than the average point distance, so that out-
lier points from the cluster are not used for the SB
computation. This test is performed in addition to
test if the given point is within the previous bound-
ary polygon. In the first instance of the GenerateSec-
ondaryBounds function call, this previous boundary
polygon is the PB polygon, but with subsequent calls
to GenerateSecondaryBounds the previous boundary
becomes the last SB to be computed. This is used to
refine the SB to a satisfactory boundary shape as de-
termined by the user. The function PointIsInPolygon
is used for checking if the point is inside or outside
of a polygon. This function casts a ray that is pro-
jected horizontally from a given point, and the num-
ber of intersections with the edges of the boundary
polygon are detected as a switchable Boolean state-
ment. To generate the SB contour, we make use of
the isPointInStroke HTML5 Canvas API function to
select only the innermost points of the SB (Fig. 3(b)
and Fig. 3(c)). We use a stroke thickness of ten pixels
for each of the polygon lines that the points are tested
against (Alg. 2). This pixel size captures most points
in a line segment (minimum three pixels width).
3.2 Floor Plan Boundary Visualization
We export our generated floor plan images from
HTML5 Canvas image frames to SVG images prior
GRAPP 2019 - 14th International Conference on Computer Graphics Theory and Applications
180
Algorithm 1: GenerateSecondaryBounds function defini-
tion.
GenerateSecondaryBounds(Points,
Polygon) Result: Returns SB polygon
begin
Points
average
← AvgDist(Points)
Point
center
← CenterPoint(Points)
for i ← 0 to length(Points) do
Dist ← SqrDist(Points
i
, Point
center
)
if PointIsInPolygon(Points
i
, Polygon)
then
if Dist < Points
average
then
GenBoundary(Points
i
)
end
end
end
end
Algorithm 2: GenBoundary function definition.
GenBoundary(Points) Result: Returns SB
points
begin
conBoundary ←
GenerateConcaveBoundary(Points)
conBoundary ←
RegularizeBoundary(conBoundary)
lineWidth ← 10
secondaryBoundaryShape
for i ← 0 to length(conBoundary) do
lineTest ←
Line(conBoundary
i
, conBoundary
i+1
)
for j ← 0 to length(Points) do
if
isPointInStroke(Points
j
, lineTest) =
FALSE then
secondaryBoundaryShape ←
Points
j
end
end
end
end
to generation of 3D meshes from the encoded vector
paths. We focus on using the SVG file format since
it is supported by Three.js for 3D vector path extru-
sion, but other popular vector-based image formats
that could also be used include Shapefiles and JSON-
encoded vector data. The Three.js framework is used
for web-based 3D visualization (Cabello et al., 2010)
and, in particular, to extrude 3D geometry from SVG
paths. This way, we extrude the PB as 3D mesh based
on the height of the walls from the original 3D point
cloud. Three.js also supports Constructive Solid Ge-
ometry (CSG) operations on geometry, thus we can
(a) (b)
(c) (d)
Figure 3: SB detection and generation: (a) The SB region
defined by a cluster of points, contained within the PB re-
gion (blue outline). (b) Using k-means clustering the SB
region is separated as a unique cluster. (c) Generated, reg-
ularized concave boundary, including points from the PB
that need to be removed. (d) Boundary generated after all
innermost points of the SB are detected using the same Gift
Opening concave evaluation as for the PBs.
carve out the 3D volume with any SB volumes us-
ing Boolean geometry operations. Three.js can per-
form CSG operations with an extension called Three-
CSG.js, based on Binary Space Partitioning (BSP),
where each triangular mesh used as a primitive is first
converted to a BSP node (Prall, 2012). The BSP tree
is then traversed and the new polygon faces are ap-
proximated using polygon splitting—where each ver-
tex belonging to each edge of of polygon is tested to
see if it is inside, outside, or co-planar to the next
polygon in the hierarchy. The Boolean operations of
subtraction, addition, and union of elements are rep-
resented as a series of function calls, which clip and
invert each polygon in the BSP hierarchy to approxi-
mate the final CSG result. This allows us to generate
3D floor plans with variable wall thicknesses and in-
terior SB areas that are not connected to the primary
wall boundary geometry. While the CSG computation
method is non-optimal, it was evaluated as a proof
of concept for generating 3D meshes with secondary
boundaries.
4 EXPERIMENTAL RESULTS
We have tested our approach with four different floor
plan data sets. The criteria for a desirable result based
on our floor plan generation can be defined as: 1) The
generated PBs and SBs preserve the visual fidelity of
Generation of Approximate 2D and 3D Floor Plans from 3D Point Clouds
181

the regularized concave contours. 2) Any expected
SBs are detected and included either as a primitive
that will be added, subtracted or merged (union) with
the PB during CSG evaluation when generating the
3D mesh, or they are treated as independent bound-
aries in the 3D mesh representation. 3) The gener-
ated 3D mesh extrusion follows the extrusion paths of
the vector paths contained in the generated 2D floor
plan. The first two data sets, Hallway 1 and Hall-
way 2 (containing 1 799 and 1 630 points each), are
used to test the PB detection and feature both regular
and curved wall segments. The other four data sets,
Room 1a, Room 1b, Room 2 and Room 3, are used to
test the SB detection (each containing 628, 605, 492,
and 238 points).
The floor plans and room segments were obtained
from an actual 3D point cloud from a typical office
building scanned using portable LiDAR scanner. The
complete 3D point cloud of segmented building in-
teriors are down-sampled between 20 000 to 50 000
points per approximately 50 square meters using uni-
form sampling. For tests, such as those for the SB
detection and curved surfaces, the point cloud clus-
ters were artificially added. We have also evaluated
our PB and SB detection method against the gener-
ated boundary detection using the α-shape algorithm.
The criteria for the α value was the smallest value
with which the SB is visually completely detected and
separated from the primary bounds. The presented
results in Fig. 4-5 show two different versions of a
floor plan, one with straight walls and another with
an artificially added curved wall section. The results
were computed using a floor plan slice selected from
the mid-level height of the 3D point cloud scan. The
PB was computed using a three pass filtering com-
bination of radial distance simplification, Douglas-
Peucker and Visvalingam algorithms. The epsilon
value used for the radial distance simplification and
Douglas-Peucker regularization parameter was 2.4,
while the epsilon value for the Visvalingam regular-
ization parameter was 0.2.
(a) (b) (c)
Figure 4: Results of the PB generation for Hallway 1 floor
plan, featuring a curved wall segment. (a) The input hori-
zontal point cloud slice. (b) Generated non-regularized con-
cave shape. (c) Regularization of the concave outlines.
(a) (b) (c)
Figure 5: Results of the PB generation for Hallway 2 floor
plan, featuring a straight wall segments. (a) The input hori-
zontal point cloud slice. (b) Generated non-regularized con-
cave shape. (c) Regularized concave outlines.
The results for the SB detection presented in Fig. 6
were compared against results generated using the α-
shape algorithm. The epsilon values for the combined
passes of the Douglas-Peucker and the radial distance
simplification algorithms were between 5.0 − 10.0,
while the epsilon value for the α-shape algorithm was
set to 150.0. An additional comparison including reg-
ularization of the α-shape with a default epsilon value
of 10.0 is also included. We also present initial re-
sults for the generation of non-optimized 3D meshes
via CSG and vector path extrusion operations. The
3D meshes are generated and visualized using the
Three.js 3D web development framework. We first
present 3D mesh visualization results featuring reg-
ularized primary boundaries of a floor plan (Fig. 7).
We also include results featuring extruded 3D geom-
etry with subtracted geometry elements representing
the regularized SB of a floor plan partition (Fig. 8).
The geometric complexities of the generated and non-
optimized 3D meshes are: Hallway 1: 137 106 ver-
tices, 45 702 faces; Hallway 2: 93 204 vertices, 31
068 faces; Room 1a: 34 386 vertices, 11 462 faces;
and Room 2: 45 102 vertices, 15 034 faces. In terms
of performance, we have measured preliminary com-
putation performance of our PB and SB generation
approaches. Generation of an SB takes an average
of 169 milliseconds, and the generation of PBs takes
and average of 10.25 milliseconds. For the PB gener-
ation (using the Hallway 1 and Hallway 2 data sets),
we did not partition the horizontal floor plan slice.
For the SB generation tests we used two k-clusters for
the slice partitioning, and detection of regions where
the SB points are located. The development PC used
features an Intel Core i5-6500 CPU at 3.2GHz, 8GB
RAM and an NVIDIA GeForce GT 630 GPU (2GB
of dedicated video memory), running Firefox 62.0.2.
GRAPP 2019 - 14th International Conference on Computer Graphics Theory and Applications
182
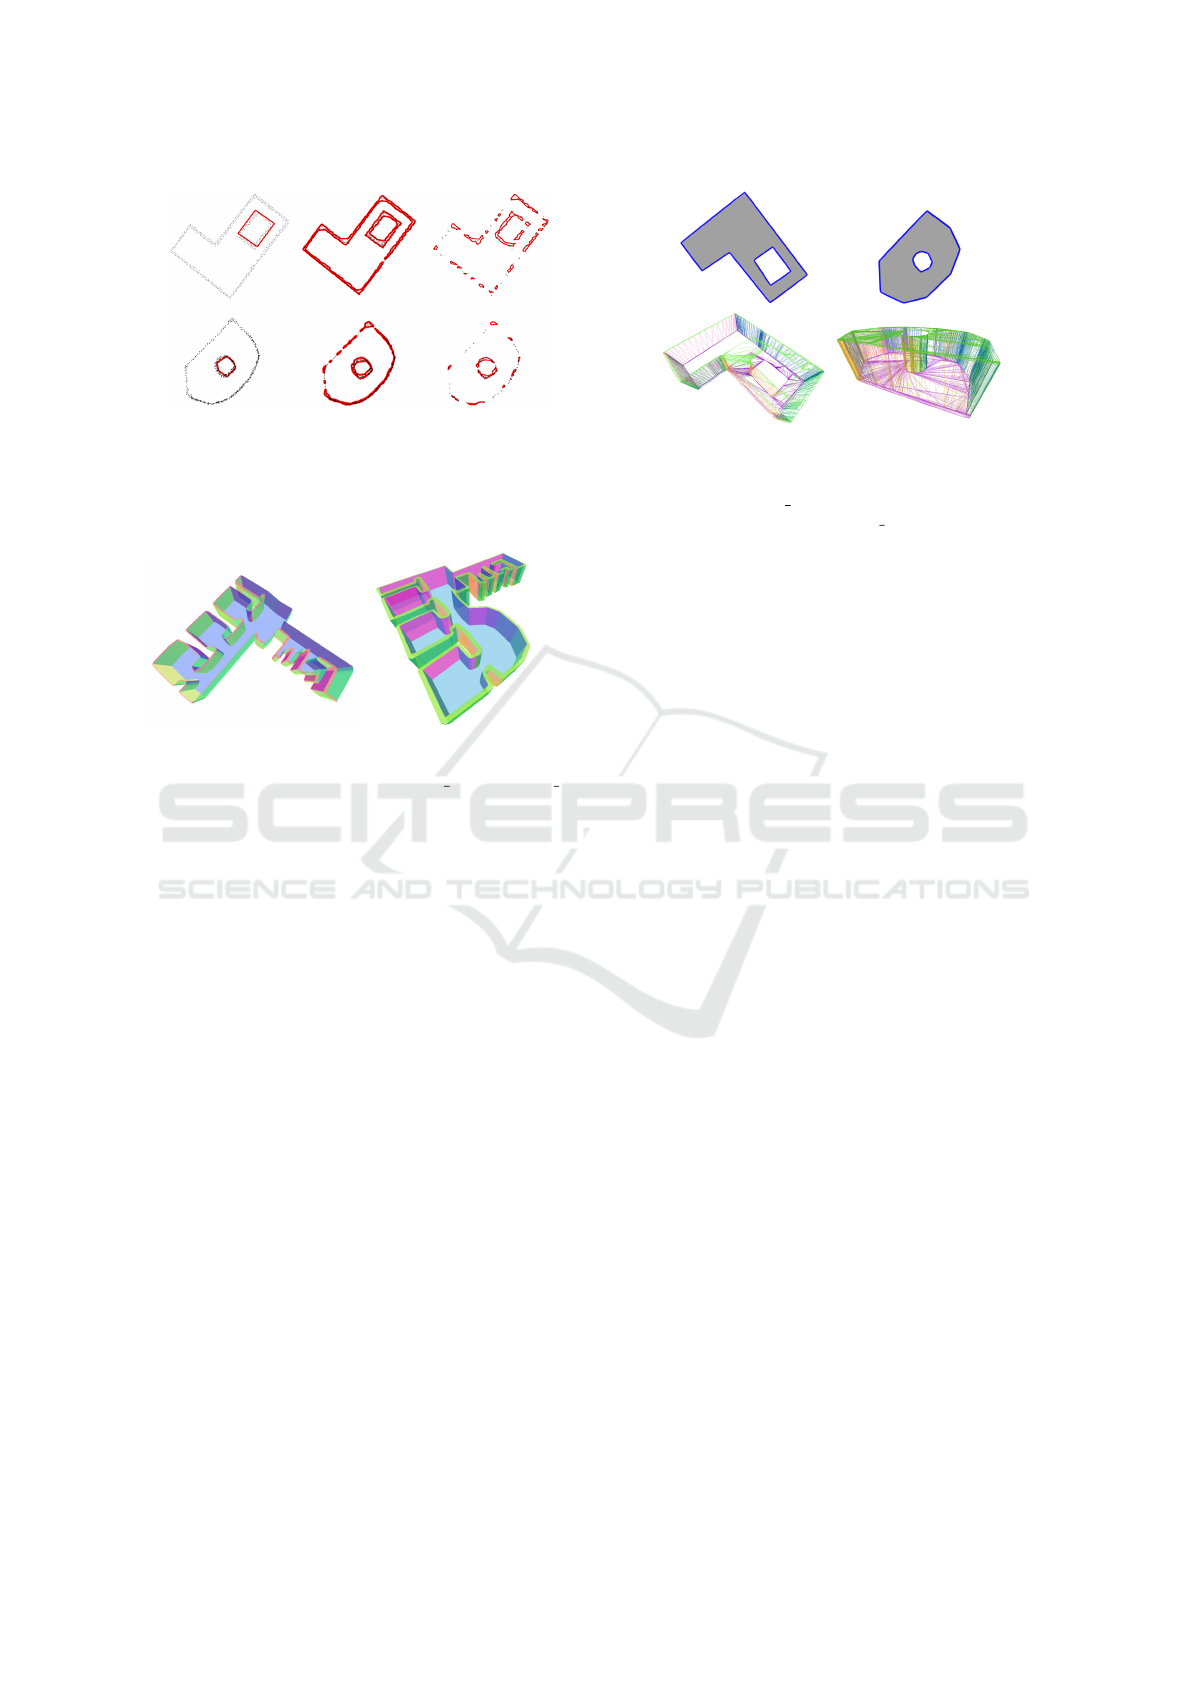
Figure 6: SB detection using our approach (left), compared
to SB detection using the α-shape algorithm (center), and
the α-shapes with regularization (right). Our method ep-
silon value: 10.0, α-shape epsilon value: 150.0, α-shape
with regularization epsilon value of 10.
(a) (b)
Figure 7: 3D meshes of data sets Hallway 1 and Hallway 2,
generated from regularized primary boundaries. (a) A gen-
erated 3D mesh featuring square elements. (b) A generated
3D mesh featuring a curved wall.
5 DISCUSSION AND
CONCLUSIONS
The results show that our approach is suited for gener-
ating approximate 2D and 3D floor plans of particular
indoor building areas (result criteria outlined in Sec.
4), making it suitable to quickly approximate spatial
dimensions, and create basis visualization data for en-
hancing communication and decision for AEC opera-
tions. We have compared our PB and SB evaluation
method for generating 2D floor plan representations
against the outputs of the α-shape algorithm. While
the α-shape algorithm is able to detect SB regions
with better accuracy, it suffers from over-evaluation
of less dense regions. Regularization of the α-shape
result also does not provide more accurate evaluation
of SBs, in terms of visual quality. The Gift Opening
algorithm for concave boundary detection works best
for closed regions formed by points with similar dis-
tances between them. This becomes a problem when
dealing with incomplete wall segments obtained from
3D point clouds as the algorithm will treat the missing
walls segments as a concave opening.
(a) (b)
Figure 8: Generated 3D meshes from regularized secondary
boundaries. (a) Room 1a: 3D mesh featuring SB in the
form of a hollow square. (b) Room 2: 3D mesh featuring
an curved PB with a curved and hollow SB.
The evaluated line regularization algorithms pro-
vide best results if they are combined, though sharp
corners are not preserved unless a low regularization
epsilon value is used. The regularization parame-
ters are adjusted according to the density of the point
cloud, i.e., evaluated as the average distance between
points. There is difficulty using our approach for de-
tecting very narrow spaces as PBs for a horizontal
floor plan slice; however, they can be approximated
as SBs. Notably, the α-shapes algorithm is better
suited for detecting narrow spaces as PBs. SBs can
be added or subtracted to the PB mesh using CSG
Boolean operations, though the generated 3D meshes
increase in geometric complexity and may need to be
optimized. We predict approaches based on machine-
learning to be applicable for floor plan generation and
evaluation scenarios, thus this is also currently be-
ing investigated. The outcomes presented here con-
tribute to the ongoing research concerning automated
semantic enrichment of point clouds using a service-
oriented approach (Stojanovic et al., 2018), (Discher
et al., 2018).
ACKNOWLEDGMENTS
This work was partially funded by the Research
School on Service-Oriented Systems Engineering of
the Hasso Plattner Institute.
REFERENCES
Akkiraju, N., Edelsbrunner, H., Facello, M., Fu, P., Mucke,
E., and Varela, C. (1995). Alpha shapes: defini-
tion and software. In Proceedings of the 1st Interna-
tional Computational Geometry Software Workshop,
volume 63, pages 66–70.
Generation of Approximate 2D and 3D Floor Plans from 3D Point Clouds
183

Alzantot, M. and Youssef, M. (2012). Crowdinside: auto-
matic construction of indoor floorplans. In Proceed-
ings of the 20th International Conference on Advances
in Geographic Information Systems, pages 99–108.
ACM.
Ambrus, R., Claici, S., and Wendt, A. (2017). Automatic
room segmentation from unstructured 3-d data of in-
door environments. IEEE Robotics and Automation
Letters, 2(2):749–756.
Ballard, D. H. (1981). Generalizing the hough trans-
form to detect arbitrary shapes. Pattern recognition,
13(2):111–122.
Birodkar, V. and Edla, D. R. (2014). Enhanced k-means
clustering algorithm using a heuristic approach. Jour-
nal of Information and Computing Science, 9(4):277–
284.
Cabello, R. et al. (2010). Three. js. URL: https://github.
com/mrdoob/three. js.
Discher, S., Richter, R., and D
¨
ollner, J. (2018). A scal-
able webgl-based approach for visualizing massive
3d point clouds using semantics-dependent rendering
techniques. In Proceedings of the 23rd International
ACM Conference on 3D Web Technology, page 19.
ACM.
Douglas, D. H. and Peucker, T. K. (1973). Algorithms for
the reduction of the number of points required to rep-
resent a digitized line or its caricature. Cartograph-
ica: The International Journal for Geographic Infor-
mation and Geovisualization, 10(2):112–122.
Duce, D., Hopgood, B., and Lightfoot, D. (2002). Svg
and x3d: Technology for a foundation course. In Eu-
rographics/ACM SIGGRAPH Workshop on Computer
Graphics Education, Support for Computer Graphics
Educators, Bristol University, UK.
Feiner, S., Foley, J., van Dam, A., and Hughes, J. (1990).
Computer graphics: Principles and practice. Adison
Wesley.
Gai, M. and Wang, G. (2015). Indoor3d: a webgl based
open source framework for 3d indoor maps visualiza-
tion. In Proceedings of the 20th International Confer-
ence on 3D Web Technology, pages 181–187. ACM.
Girardeau-Montaut, D. (2011). Cloudcompare-open source
project. OpenSource Project.
Hagedorn, B., Trapp, M., Glander, T., and Dollner, J.
(2009). Towards an indoor level-of-detail model for
route visualization. In Proceedings of the 2009 Tenth
International Conference on Mobile Data Manage-
ment: Systems, Services and Middleware, MDM ’09,
pages 692–697. IEEE Computer Society.
Heckbert, P. S. (1990). A seed fill algorithm. In GLASS-
NER, A. S., editor, Graphics Gems, pages 275 – 277.
Morgan Kaufmann, San Diego.
Ikehata, S., Yang, H., and Furukawa, Y. (2015). Structured
indoor modeling. In Proceedings of the IEEE Interna-
tional Conference on Computer Vision, pages 1323–
1331.
Koning, E. d. (2011). Polyline simplification. URL:
https://www.codeproject.com/Articles/114797/Polyline-
Simplification.
Li, L., Su, F., Yang, F., Zhu, H., Li, D., Zuo, X., Li, F.,
Liu, Y., and Ying, S. (2018). Reconstruction of three-
dimensional (3d) indoor interiors with multiple sto-
ries via comprehensive segmentation. Remote Sens-
ing, 10(8):1281–1311.
Liu, K., Motta, G., Tunc¸er, B., and Abuhashish, I. (2017). A
2d and 3d indoor mapping approach for virtual navi-
gation services. In Service-Oriented System Engineer-
ing (SOSE), 2017 IEEE Symposium on, pages 102–
107. IEEE.
Nguyen, A. and Le, B. (2013). 3d point cloud segmenta-
tion: A survey. In Robotics, Automation and Mecha-
tronics (RAM), 2013 6th IEEE Conference on, pages
225–230. IEEE.
Oesau, S., Lafarge, F., and Alliez, P. (2014). Indoor scene
reconstruction using feature sensitive primitive extrac-
tion and graph-cut. ISPRS Journal of Photogrammetry
and Remote Sensing, 90:68–82.
Okorn, B., Xiong, X., Akinci, B., and Huber, D. (2010).
Toward automated modeling of floor plans. In Pro-
ceedings of the symposium on 3D data processing, vi-
sualization and transmission, volume 2.
Pohl, M. and Feldmann, D. (2016). Generating straight
outlines of 2d point sets and holes using dominant di-
rections or orthogonal projections. In Proceedings of
the 11th Joint Conference on Computer Vision, Imag-
ing and Computer Graphics Theory and Applications:
Volume 1: GRAPP, pages 59–71.
Prall, C. (2012). Threecsg.js. URL:
https://github.com/chandlerprall/ThreeCSG.
Previtali, M., Barazzetti, L., Brumana, R., and Scaioni, M.
(2014). Towards automatic indoor reconstruction of
cluttered building rooms from point clouds. ISPRS
Annals of Photogrammetry, Remote Sensing & Spatial
Information Sciences, 2(5):281–288.
Rosen, E., Jansson, E., and Brundin, M. (2014). Implemen-
tation of a fast and efficient concave hull algorithm.
Uppsala Univ.
Shi, W. and Cheung, C. (2006). Performance evaluation
of line simplification algorithms for vector generaliza-
tion. The Cartographic Journal, 43(1):27–44.
Stojanovic, V., Trapp, M., Richter, R., and D
¨
ollner, J.
(2018). A service-oriented approach for classifying
3d points clouds by example of office furniture clas-
sification. In Proceedings of the 23rd International
ACM Conference on 3D Web Technology, Web3D ’18,
pages 2:1–2:9. ACM.
Turner, E. and Zakhor, A. (2014). Floor plan generation
and room labeling of indoor environments from laser
range data. In 2014 International Conference on Com-
puter Graphics Theory and Applications (GRAPP),
pages 1–12. IEEE.
Valero, E., Ad
´
an, A., and Cerrada, C. (2012). Automatic
method for building indoor boundary models from
dense point clouds collected by laser scanners. Sen-
sors, 12(12):16099–16115.
Visvalingam, M. and Whyatt, J. D. (1993). Line general-
isation by repeated elimination of points. The carto-
graphic journal, 30(1):46–51.
Wei, S. (2008). Building boundary extraction based on lidar
point clouds data. Proceedings of the International
Archives of the Photogrammetry, Remote Sensing and
Spatial Information Sciences, 37:157–161.
GRAPP 2019 - 14th International Conference on Computer Graphics Theory and Applications
184
