
Design and Implementation of Monitor Tester for Validation of ECG
Signals
Vladimir Kasik, Marek Penhaker, Jan Kubicek, Martin Cerny, Martin Augustynek,
David Oczka and Alice Krestanova
VSB–Technical University of Ostrava, FEECS, K450, 17. listopadu 15, 708 33, Ostrava–Poruba, Czech Republic
Keywords: DAC, ECG, Charge Pump, Converter, Parallel Port, QRS, Heart.
Abstract: The paper deals with a design and consequent realization of a monitor tester for validation of the ECG
devices, and patient’s monitors for the ECG measurement. In the paper, we describe the electrical design of
the plug-in module, which is intended for a transmission of the digital data from the computer. Data are sent
by using the controlling SW connected to the parallel port in the plug-in module. An essential part of the
proposed module is the three-channel 12 bit D/A converter AD 7398. This converter is able to
simultaneously send data from all the three outputs. The converter output is unipolar in the volts units. For
this reason, the transmitted signals are adjusted by using the differential amplifiers in order to convert them
to the bipolar. The signal’s amplitudes are decreased to the millivolts level by using the voltage dividers. On
the base of this solution, the Einthoven ECG leads may be detected.
1 INTRODUCTION
The electrical heart action is represented as a
continuous signal. In order to process and register
such kind of signal, it must be converted to the
digital form. By this procedure, the entire process of
the ECG processing is being automated. (Acharya,
2017), (Nguyen, 2018)
In this procedure, certain rules should be met.
Since the frequency scale of the ECG signal belongs
to the range: 0.05-100 Hz, it is necessary to perform
sampling with a frequency higher than 200 Hz by
the Shannon theorem. (Cerny, 2017), (De La Rosa,
2016), (Grepl, 2014), (Halcox, 2017)
In the practice we use various sampling
frequencies, but the most frequently 250 and 500
Hz. Next requirement is the quantization. There are
quantization steps, commonly in the range 2.5-20
µV. Choice of the particular discretization depends
on the requirements for next processing it means
how accurately and quickly the ECG signal should
be processed and interpreted. Decreasing the
sampling frequency on the 250 Hz, and increase of
the quantization step on 20-25 µV may cause the
ECG distortion by the errors which are still
marginally acceptable. (Jeppesen, 2017), (Kromer,
2016), (Pazart, 2017)
For the automatic ECG processing, there is a
prime requirement processing in the real time,
therefore the accuracy requirements are lower. A
common sampling frequency is 200 Hz and word
length 8 bits. (Kubicek, 2017), Lai (2016), Lek-
Uthai (2017)
2 ECG SIMULATORS
The ECG simulator is a device having a task to
simulate various heart function by that way to be
possible assess of the quality and settings of the
cardio monitors and ECG devices. During the ECG
activity detection from the human’s body such signal
is just little influenced by the noise signals as it is
disturbing induced frequency of the power grid. In
order to achieve independence on the disturbing
induced voltage, it is necessary to supply the
stimulator form the battery supply. (Machacek,
2013), (Martinek, 2016), (Mlynczak, 2017)
The outputs of the ECG simulator reaches the
millivolts to as most as possible imitate the real heart
activity. In order to test variable alarms of the cardio
monitors, the ECG simulator allows for modeling of
the heart’s failures. The device output should be
equipped by the standard clamps having
recommended color marking. The controlling panel
also contains elements for triggering the common
Kasik, V., Penhaker, M., Kubicek, J., Cerny, M., Augustynek, M., Oczka, D. and Krestanova, A.
Design and Implementation of Monitor Tester for Validation of ECG Signals.
DOI: 10.5220/0007248001270133
In Proceedings of the 12th International Joint Conference on Biomedical Engineering Systems and Technologies (BIOSTEC 2019), pages 127-133
ISBN: 978-989-758-353-7
Copyright
c
2019 by SCITEPRESS – Science and Technology Publications, Lda. All rights reserved
127
calibration curves having the time and amplitude of
the output signal. (Powierza, 2017), (Ronzhina,
2017), (Shahriari, 2017), (Solbiati, 2017)
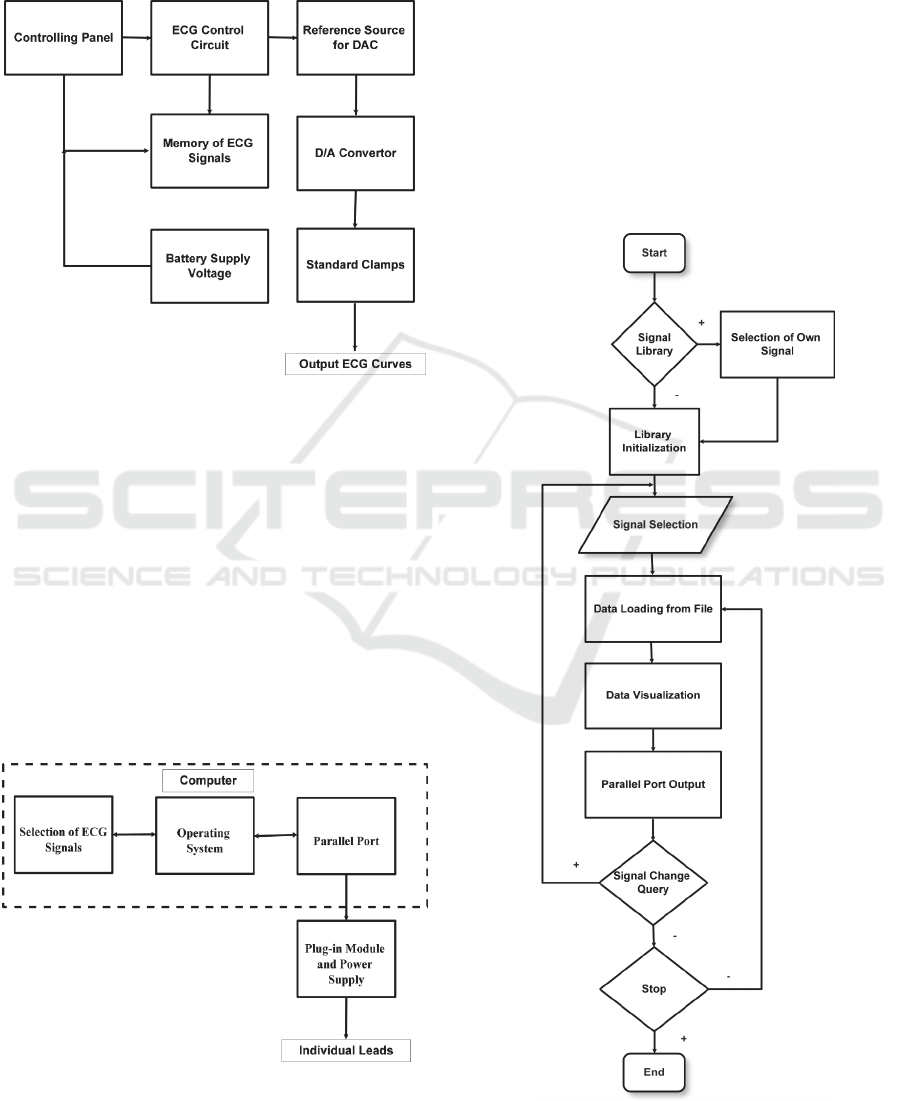
The general block diagram of the ECG simulator
is reported on the Figure 1.
Figure 1: Block diagram of the ECG simulator.
3 PROPOSAL OF ECG
SIMULATOR
The proposed ECG tester (Figure 2) is composed
from the four essential blocks:
Controlling SW of the plug-in module for
generating the output signals.
Operating system under which the SW
works.
Parallel port.
Plug-in module containing the 12 bit D/A
converter with power supply.
Figure 2: Block diagram of the proposed ECG simulator.
The controlling SW is proposed in the Delphi 5
Enterprise. In this environment we are using the
library PORT.DLL which was designed for
communication with the PC ports in the Delphi.
The Figure 3 represents a flow-chart of the SW.
After starting the SW user is asked if the input signal
shall be inserted. In the case not, the needed
variables and libraries modules are being initialized.
In the case of inserting the input signal, the files
containing data are selected. After this step the
initialization procedure follows. After selecting the
signal from the offered list, and pressing the Start,
the data are loading from the file they are adjusted,
and shown on the screen. Consequently, a procedure
for the data sending on the parallel port is started.
Figure 3: Block diagram of the proposed ECG algorithm.
BIODEVICES 2019 - 12th International Conference on Biomedical Electronics and Devices
128
The SW sends the data on the PC port so long until a
type of the signal is not being changed, or the SW is
not terminated, eventually stopped.
The data corresponding to signals are stored in the
text files having the ASCII coding. Each selected
signal is composed from three leads which are saved
in the files. It means that each lead is loaded
separately. Each file contains 250 samples
distributed into maximally 4096 levels.
4 SOFTWARE DESCRIPTION
The controlling panel is composed from two basic
components, and seven controlling procedures. The
basic procedures include DAC output and type of
the signal. The DAC procedure allows for data
sending on the PC parallel port. The data are
adjusted by that way to achieve combination
corresponds to the time signals reported on the
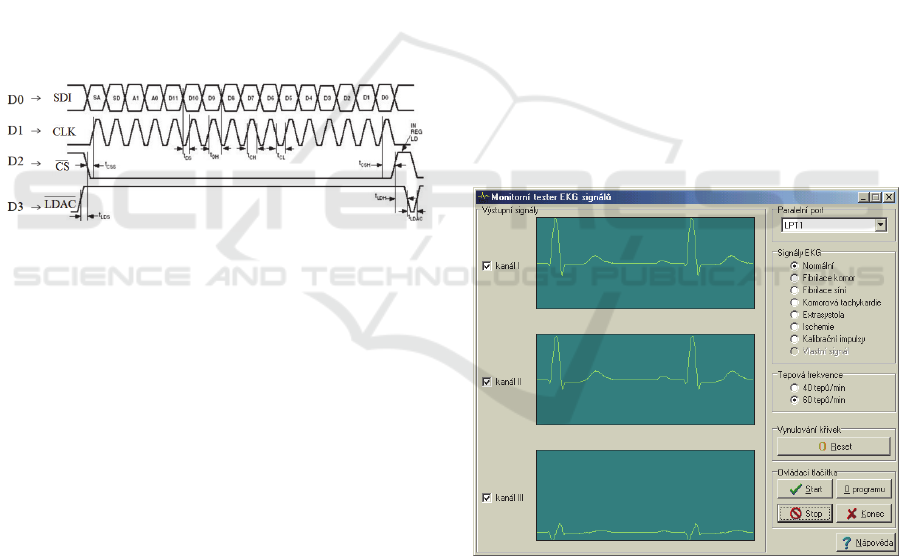
Figure 4.
Figure 4: Signals in the time domain for the converter.
SDI represents the data bits, CLK is the time
signal, and LDAC is a signal for simultaneous data
sending from the registers on the converter output.
D0-D3 represent individual bits of the parallel
output of the eight-bit word which can be sent from
the parallel port. Levels D0-D3 are changed by the
DAC procedure output, and four parallel channels
are created sending the binary data in parallel.
By the procedure Signal type, the respective
signal is selected. In this procedure, the data of three
channels are simultaneously loaded. The data are
adjusted by that way so that the maximal value
would be 4095 it corresponds with the maximal
value of the converter, and minimal zero.
The controlling procedures allow for address
settings of the parallel port, select the output
channel, clear the window content, call the help, or
window containing a brief help about the SW,
sending data on the port, and terminate data sending
to the port. These functions can be controlled nearly
permanently by using the system timer
(Timer1Timer).
5 APPLICATION WINDOW
The software environment is composed from three
windows representing selected signals. The software
environment is equipped by the tick buttons
allowing for switching off some of the channels. By
default all the channels are set as active. In the case
of switching off some of the channels, in the
converter output there is not a signal in the graphical
window, only the isoelectric line is being drawn.
The user can select an address of the parallel
port. The printer port LPT 1 is preset. In the signals
ECG, user can select kind of the ECG signal. There
are seven kinds of the ECG signals, and one more
signal can be added whilst application running. In
the case when the user does not want to insert own
signal, the last controlling field in inactive and
shown as grey. In the field pulse, user can change
the sending data frequency on the PC parallel port. It
appears as lengthen of the signals period. The value
60 beats per minute is preset.
Reset serves for erasing the window’s content,
Start serves for sending data to the port, Stop serves
for stop data sending. The application also contains a
brief help. The application window is reported in the
Figure 5.
Figure 5: SW environment of ECG monitor tester.
6 PLUG-IN MODULE
An elementary part of the plug-in module is the
digital/analog converter AD7398. This module also
contains operational amplifier serving for adjustment
of the output signal’s levels, charging pump, several
passive components with power connectors. The
block scheme of the plug-in module is reported in
Design and Implementation of Monitor Tester for Validation of ECG Signals
129
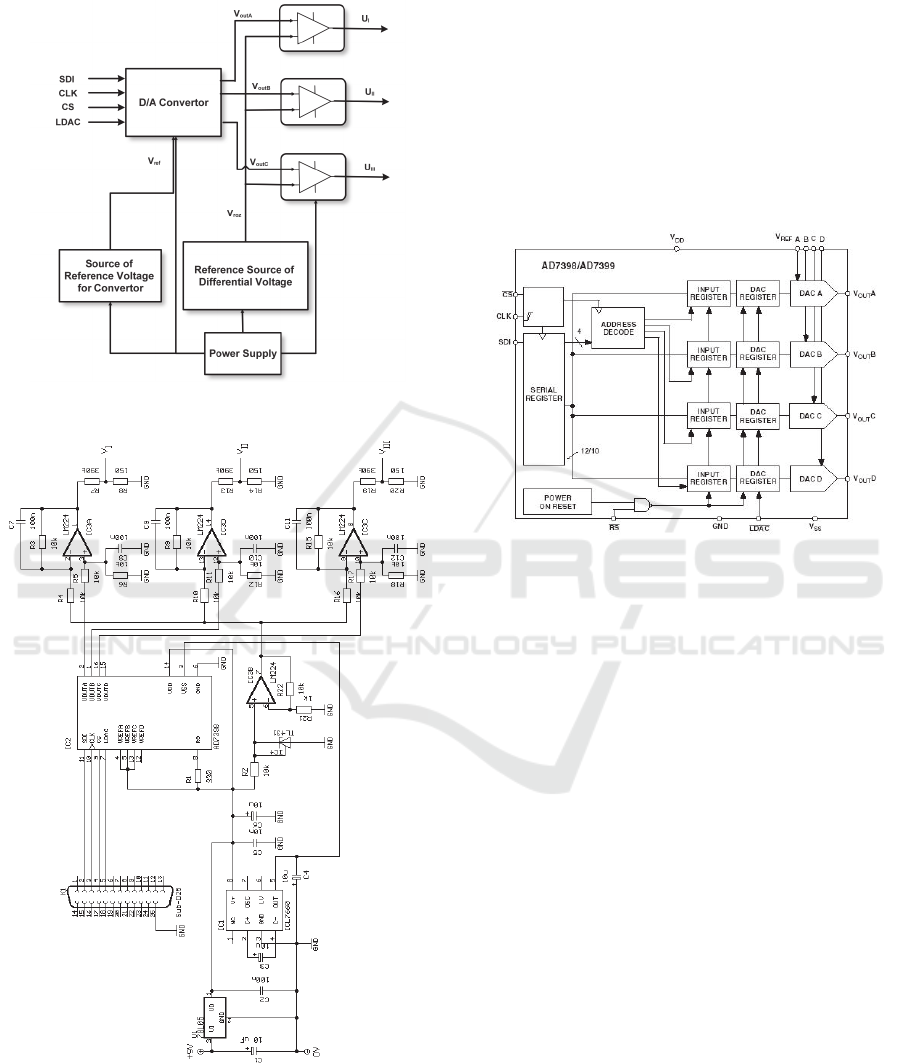
the Figure 6, and electronic circuit of the module is
shown on the Figure 7.
Figure 6: Block scheme of plug-in module.
Figure 7: Electronic scheme of the plug-in module
(Analog Devices, 2006).
The four-channel 12-bit converter AD7398
communicates by the own serial interface. It can be
supplied by the symmetrical voltage 3-5 V, or the
unsymmetrical voltage ±5 V, and the output voltage
is in the range 0-V
ref
where V
ref
is set in the interval
of the supply voltage. It is also possible to switch off
inactive channel, send the data from registers in
parallel, zeroing either individual or all the registers.
The converter is formed by the input serial register,
circuits for decoding, input registers of the
individual converters, DAC registers, D/A
converters and the circuit breaker. A block scheme
containing those components is reported on the
Figure 8.
Figure 8: Internal block diagram of the converter AD7398
(Analog Devices, 2006).
The converter is equipped, for controlling and
communication, by 5 inputs. CLK (hours), and for
controlling individual converters and registers there
are other two: LDAC (parallel sending the data on
the input) and RS (registers zeroing). The output
voltage is given by the eq. 1.
V
OUT
= (V
REF
. D)/4096 (1)
D represents a decadic equivalent of the data word.
The number 4096 represents the converter’s scale.
The ECG monitor tester is supplied from the 9V
battery. Firstly, the voltage is adjusted on the +5 V
by the stabilizer 7805. The capacities C1 and C2 do
not have to be connected when the module is
supplied from the battery. The C1 serves for the
filtration of the supply voltage, and C2 prevents an
oscillation of the voltage stabilizer. The charging
pump ICL7660 generates a negative voltage for the
converter and the operating amplifiers. The supply
source electrical diagram is shown on the Figure 9.
BIODEVICES 2019 - 12th International Conference on Biomedical Electronics and Devices
130
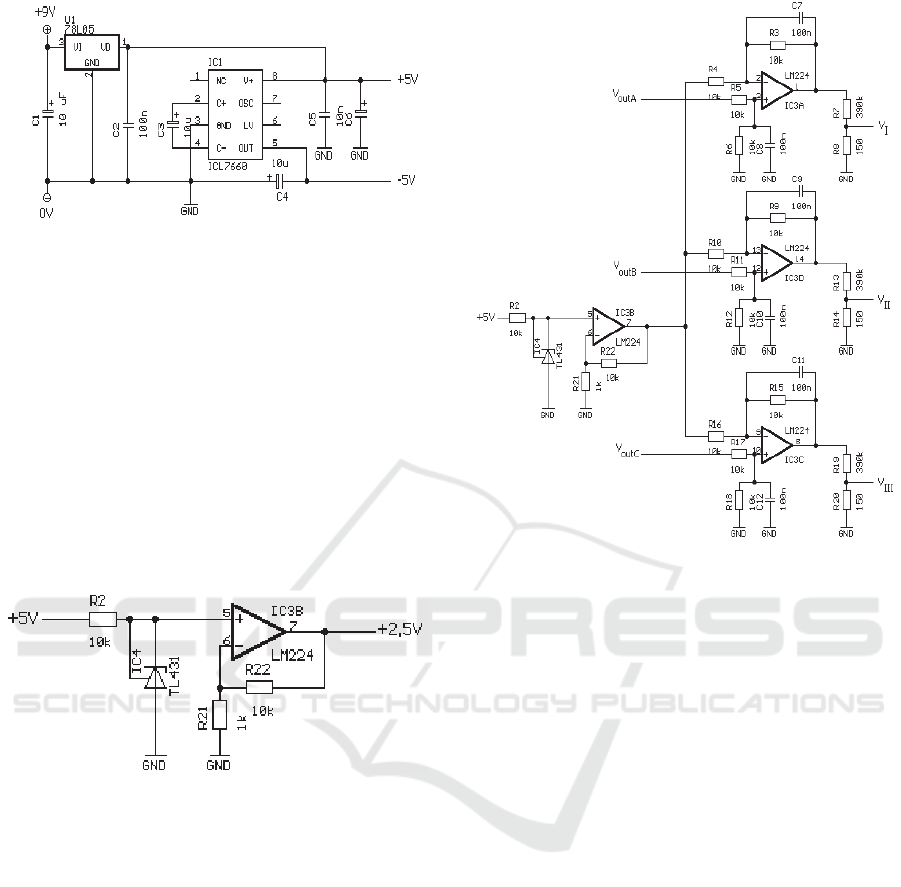
Figure 9: Electrical diagram of the charging pump
ICL7660 (Renesas, 2010).
Signals from the converter are only unipolar, and
they have the maximal amplitude +5 V. ECG signal
has the maximal value approximately 3 mV, and it is
bipolar. Therefore, the signals from the converter are
come to one of the differential amplifiers input
having set the boost 1 by the resistance site. On the
second input, a voltage is come which is subtracted
from the converter’s signal. It is set to the signal
after the differential amplifier has the isoelectric line
with the zero voltage. A voltage which is subtracted
is come from the reference voltage source TL431
(Figure. 10).
Figure 10: Reference source of the differential voltage
(Texas Instruments, 2004).
In order to prevent influence of the reference
differential voltage on the differential amplifiers by
a signal from the converter, this voltage is connected
through the non-inverse amplifier having the boost
1.1. The electrical connection of the entire input
circuit is present on the Fig. 11. Capacitors with the
capacity 100 nF restrict a maximal transferred
frequency on the 160 Hz, also restrict the amplifier’s
noise. In the output of the differential amplifiers, the
voltage divider is connected reducing amplitude to
the mV level. We have selected the operational
amplifier LM224 containing four operational
amplifiers. It is a low-power device, and can be
supplied by the asymmetrical voltage till 3 V and
symmetrical voltage from ± 1.5 V.
Figure 11: Electrical diagram of the output circuits.
Consumption of the whole plug-in module is 10 mA.
It would be possible to reduce it by increasing the
resistance values of the differential amplifiers. The
voltage dividers, placed in the differential
amplifier’s output, would be more appropriate to
connect close the tested device because unwanted
disturbing voltage can be induced to the leads.
7 CONCLUSION
We have designed the ECG monitor tester
generating three ECG leads which would be possible
to connect to the PC by the standard ports.
The ECG monitor tester works on the principle
data loading from the PC memory. The data
sequence is being processed by the SW which sends
the data on the PC parallel port. Here, the plug-in
module is connected. This module is composed from
the three-channel 12-bit D/A converter, voltage
stabilizer, charging pump, operating amplifiers, and
several passive elements. The converter generates
unipolar analog signals which are consequently
adjusted by the differential amplifiers on the bipolar.
The voltage dividers reduce the amplitude on the
mV levels. This process is being cyclically repeated
until is not terminated by the user. This device
allows for detection of the Einthoven leads.
Design and Implementation of Monitor Tester for Validation of ECG Signals
131

The ECG monitor tester has been tested on the
oscilloscope HP54601A, and also on the cardio
monitor Nihon Kohden in the clinical environment
of the University hospital of Ostrava.
ACKNOWLEDGEMENTS
The work and the contributions were supported by
the project SV4508811/2101Biomedical
Engineering Systems XIV’. This study was also
supported by the research project The Czech Science
Foundation (GACR) 2017 No. 17-03037S
Investment evaluation of medical device
development run at the Faculty of Informatics and
Management, University of Hradec Kralove, Czech
Republic. This study was supported by the research
project The Czech Science Foundation (TACR)
ETA No. TL01000302 Medical Devices
development as an effective investment for public
and private entities.
REFERENCES
U.R. Acharya, S.L Oh, Y. Hagiwara, J.H. Tan, M. Adam,
A. Gertych R.S. Tan, 2017. A deep convolutional
neural network model to classify heartbeats. In
Computers in Biology and Medicine.
Analog Devices, “Quad, Serial-Input 12-Bit/10-Bit
DACs,” AD7398/AD7399 datasheet, 2006
H. Cu, T. Nguyen, T. Nguyen, T. Le., T. Vo Van. 2018.
Validation of wireless wearable electrocardiogram
system for real-time ambulatory cardiac monitoring.
2018. In IFMBE Proceedings.
M. Cerny, T. Klinkovsky, J. Petrik, L. Peter, M. Penhaker,
V. Kasik, 2017. Defibrillator educational devices,
2017. In SAMI 2017 - IEEE 15th International
Symposium on Applied Machine Intelligence and
Informatics.
E. De La Rosa, P.Paglini-Oliva, E.A. Fernández, 2016.
High frequency QRS components: A comparative
analysis to assess myocardial damage in chronic
chagasic patients, 2016. In IEEE Biennial Congress of
Argentina, ARGENCON 2016.
J. Grepl, , M. Penhaker, J. Kubicek, J. Prokop, L. Peter,
2014. Pressure distribution measurement of close
fitting clothes on human body. In IFMBE
Proceedings.
J.P.J. Halcox, K. Wareham, A. Cardew, M. Gilmore, J.P.
Barry, , C. Phillips, M.B. Gravenor, 2017. Assesment
of Remote Heart Rhythm Sampling Using the
AliveCor Heart Monitor to Screen for Atrial
Fibrillation: The REHEARSE-AF Study. In
Circulation.
J. Jeppesen, S. Beniczky, A. Fuglsang Frederiksen, P.
Sidenius, , P. Johansen, 2017. Modified automatic R-
peak detection algorithm for patients with epilepsy
using a portable electrocardiogram recorder, In
Proceedings of the Annual International Conference
of the IEEE Engineering in Medicine and Biology
Society, EMBS.
P. Kromer, J. Konecny, M.Prauzek, 2016. Point-based
scan matching by differential evolution, 2016. In
Proceedings - 2016 International Conference on
Intelligent Networking and Collaborative Systems.
J. Kubicek, M. Augustynek, M. Penhaker, M. Cerny, I.
Bryjova, 2017. Analysis and dynamical simulation of
heart rate influence upon physical load, 2017. In
Lecture Notes in Computer Science (including
subseries Lecture Notes in Artificial Intelligence and
Lecture Notes in Bioinformatics).
S.-C. Lai, T.-H. Hung, W.-C. Li, Y.-S. Jhang, K.-Y.
Chang, W.-H. Juang, C.-H. Luo, 2016. Low-cost
prototype design of a portable ECG signal recorder,
2017. In 2016 IEEE Asia Pacific Conference on
Circuits and Systems, APCCAS 2016.
A. Lek-Uthai, P. Somboon, A. Teeramongkonrasmee,
2017. Development of a cost-effective ECG monitor
for cardiac arrhythmia detection using heart rate
variability, 2017. In BMEiCON 2016 - 9th Biomedical
Engineering International Conference.
Z. Machacek, R. Slaby, J. Vanus, R. Hercik, , J. Koziorek,
2013. Non-contact measurement system analysis for
metallurgical slabs proportion parameters, 2013. In
Elektronika ir Elektrotechnika.
R. Martinek, A. Sincl, J. Vanus, M. Kelnar, P. Bilik, Z.
Machacek, J. Zidek, 2016. Modelling of fetal hypoxic
conditions based on virtual instrumentation, 2016. In
Advances in Intelligent Systems and Computing.
C.S. Powierza, M.D. Clark, J.M. Hughes, K.A. Carneiro,
J.P. Mihalik, 2017. Validation of a Self-Monitoring
Tool for Use in Exercise Therapy. In PM and R.
Renesas, “CMOS Voltage Converters”, ICL7660,
ICL7660A datasheet, 2010
M. Ronzhina, V. Olejnickova, T. Stracina, M. Novakova,
O. Janousek, J. Hejc, J. Kolarova, M. Hlavacova, H.
Paulova, 2017. Effect of increased left ventricle mass
on ischemia assessment in electrocardiographic
signals: Rabbit isolated heart study. In BMC
Cardiovascular Disorders.
Y. Shahriari, R. Fidler, M., Pelter, Y. Bai, A. Villaroman,
X. Hu, 2017. Electrocardiogram Signal Quality
Assessment Based on Structural Image Similarity
Metric. In IEEE Transactions on Biomedical
Engineering.
M. Solbiati, G. Casazza, F. Dipaola, F. Barbic, M.
Caldato, , N. Montano, R. Furlan, R.S. Sheldon, G.
Costantino, 2017. The diagnostic yield of implantable
loop recorders in unexplained syncope: A systematic
review and meta-analysis. In International Journal of
Cardiology.
Texas Instruments, “Precision Programmable Reference”,
TL431/TL432 datasheet, 2004, [Revised Nov. 2018].
Mlynczak, M., Zylinski, M., Niewiadomski, W., Cybulski,
G. Ambulatory Devices Measuring Cardiorespiratory
Activity with Motion (2017) BIODEVICES 2017 -
BIODEVICES 2019 - 12th International Conference on Biomedical Electronics and Devices
132

10th International Conference on Biomedical
Electronics and Devices, Proceedings; Part of 10th
International Joint Conference on Biomedical
Engineering Systems and Technologies, BIOSTEC
2017, 2017-January, pp. 91-97.
Pazart, L., Sall, F.S., De Luca, A., Vivot-Pugin, A., Pili-
Floury, S., Capellier, G., Khoury, A. Consideration of
the human factor in the design and development of a
new medical device: Example of a device to assist
manual ventilation (2017) BIODEVICES 2017 - 10th
International Conference on Biomedical Electronics
and Devices, Proceedings; Part of 10th International
Joint Conference on Biomedical Engineering Systems
and Technologies, BIOSTEC 2017, 2017-January, pp.
215-223.
Design and Implementation of Monitor Tester for Validation of ECG Signals
133
