
Measuring Upper-Extremity Use with One IMU
Hang Wang
1,2
, Mohamed Irfan Mohamed Refai
2
and Bert-Jan F. van Beijnum
2
1
University of Science and Technology of China, P. R. China
2
Biomedical Signals and Systems, University of Twente, Enschede, The Netherlands
Keywords:
Arm Use, IMUs, Upper Limb Movement, Movement Quality.
Abstract:
Discharge home from hospital can be a critical stage in the rehabilitation of patients with central neurological
disorders such as stroke. The new skills and early recovery achieved in the hospital may be difficult to transfer
to the home environment. This work addresses the monitoring of arm usage and proposed a new metric called
Weighted Activity Counts (WAC) based on a sensing system that consists of only one inertial measurement unit
(IMU). The proposed metric combines activity counts and the smoothness of the movement. This work defines
Normalized Gross Energy Expenditure (NGEC) as the reference metric. WAC shows good performance under
the validation protocol we designed (correlation coefficient r > 0.90). The optimal placement for the single
sensor which can sufficiently and reliably describe arm usage is also explored in this work.
1 INTRODUCTION
The main goal during stroke and central neurologi-
cal disorder rehabilitation is to achieve optimal motor
performance enabling patients to live independently.
Researchers use standardized clinical tests and func-
tional motion tasks to assess the capacity of stroke pa-
tients, for example, Fugl-Meyer Assessment (Sanford
et al., 1993) and the Action Research arm test (ARAT)
(Lyle, 1980). In the home environment, it’s hard for
the physicians to access necessary information about
the intensity and quality of a patient’s daily-life activ-
ities (Klaassen et al., 2016). Therefore, it is of interest
to build an unobtrusive and modular system for objec-
tively monitoring the patient’s upper or lower extrem-
ity motor function in daily-life activities. Since the
upper extremity function is a key Activities of Daily
Living factor and seen as a high research priority in
rehabilitation (Klaassen et al., 2016), the main focus
of this study is on upper extremity movement.
The use of an IMU is a potential method for the
minimal assessment of body movements in a daily
life setting (Van Meulen et al., 2015), (Xu et al.,
2016), (van Meulen et al., 2017). IMUs combine
accelerometers, gyroscopes, magnetometers and also
do not require an external physical reference system
to estimate movement which makes the use of IMUs
suitable for measurements in a daily life setting (van
Meulen et al., 2017).
Several IMUs based metrics have been used to de-
scribe upper extremity movements. In the arm us-
age coach (AUC) system (Klaassen, 2015), (Klaassen
et al., 2016), researchers put forward the difference
acceleration vector (DAV) which calculates the 3D
norm value of the vector difference between the
movement acceleration and the gravity vector in a
predefined resting position. Another commonly used
metric is the integral of the absolute value of accel-
eration (IAA/IMA). This method takes the integral of
the absolute values of the acceleration measured by
the accelerometer (Bouten et al., 1994). Another most
widely used method has been put forward by Hale et
al., who use the mean acceleration (in m/s
2
) for each
of the three axes across set 1-second or 1-minute in-
tervals called as activity counts (AC) to measure the
amount of the arm usage (Hale et al., 2008). How-
ever, Leuenberger et al. (Leuenberger et al., 2017)
suggested that AC provides quantitative rather than
qualitative information. This holds for the other met-
rics as well.
Smoothness is a characteristic of coordinated hu-
man movements. According to Rohrer et al., patients’
movements seem to become smoother with recov-
ery (Rohrer et al., 2002). During rehabilitation, mo-
tion quality especially the smoothness can be different
which consequently requires the changes of treatment
programs. Thus, smoothness is an important indicator
of the quality of the movement. This work proposes
a new metric called Weighted Activity Counts (WAC)
that fuses the smoothness of upper extremity move-
Wang, H., Refai, M. and van Beijnum, B.
Measuring Upper-Extremity Use with One IMU.
DOI: 10.5220/0007253400930100
In Proceedings of the 12th International Joint Conference on Biomedical Engineering Systems and Technologies (BIOSTEC 2019), pages 93-100
ISBN: 978-989-758-353-7
Copyright
c
2019 by SCITEPRESS – Science and Technology Publications, Lda. All rights reserved
93
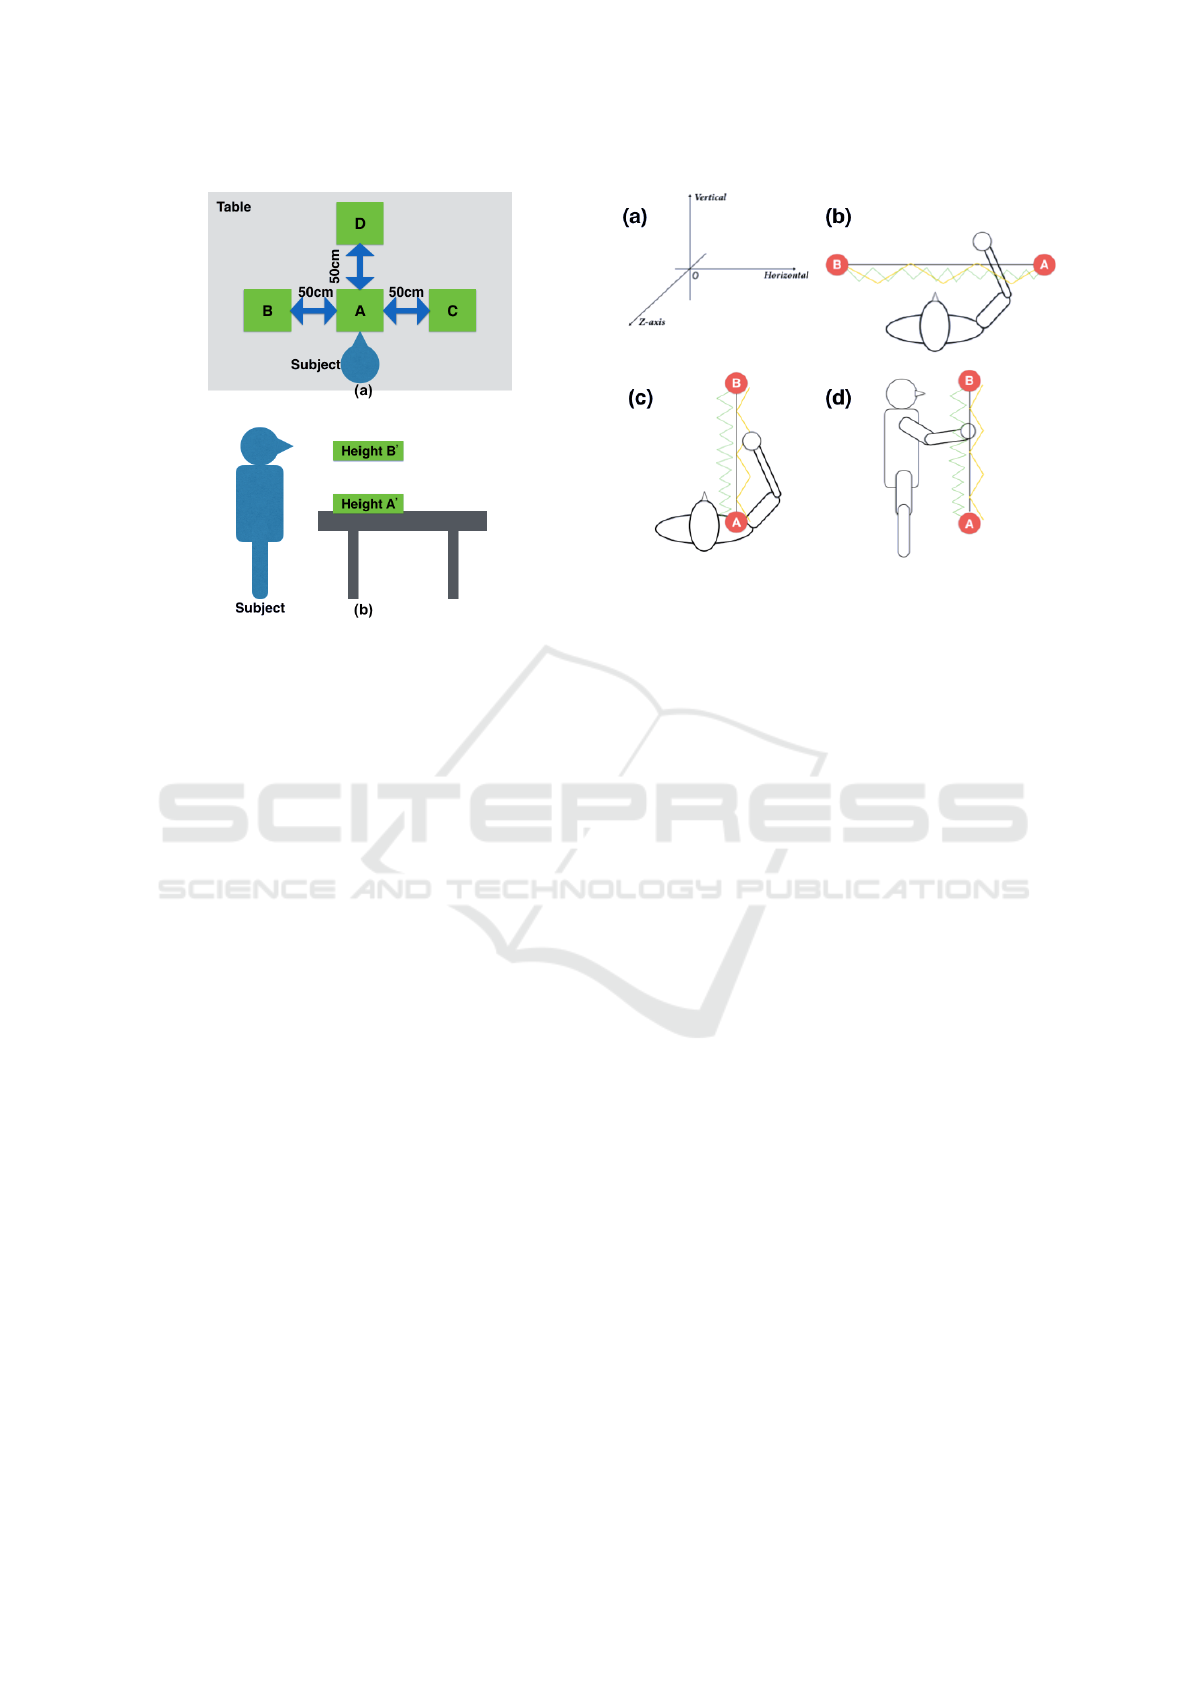
Figure 1: Protocol Phase One. (a) is the top-down view of
the different position on the table with a participant seated
on a stool. (b) is the overview of the different heights above
the table with the subject standing in front of the table.
ments with the conventional AC. To investigate the
new metric, an experiment with healthy subjects has
been conducted.
This work defines a reference metric Normalized
Gross Energy Consumption(NGEC) based on the law
of conservation of mechanical energy: the mechanical
energy is defined by the sum of the potential and ki-
netic energy. NGEC is also based on one sensor, and
able to evaluate the gross arm usage. In this study,
we validate the proposed metric as a measure of arm
usage and compare it with other four state-of-the-art
metrics.
The remainder of the paper is organized as fol-
lows: Section 2 describes the experiment protocol
that was used to evaluate the metrics, the rationale
of the WAC metric and the reference metric we pro-
posed, and Section 3 provides the results of compar-
ison among different metrics, Section 4 presents the
discussion based on the experiments, and finally, con-
clusions are given in Section 5.
2 MATERIALS AND METHODS
This section comprises of the measurement configu-
ration, two-phase experimental protocol and the pro-
cessing procedure (including pre-processing, the cal-
culation of the metrics and thereference metric).
Figure 2: Protocol Phase Two. (a) is the coordinate frame
of all the experiments, (b) is the top view of horizontal task,
the subject was in stable sitting position, and (c) is the top
view of front & back task(z-axis), the subject was in stable
sitting position. The black, yellow, green line in the figures
represent the normal, light tremble and heavy tremble mo-
tion traces separately. Finally, (d) is the side view of verti-
cal task, the subject was in stable standing position to avoid
bending their upper body.
2.1 Measurement Configurations
The device we used in our experiment is the Xsens
MVN suit (Roetenberg et al., 2009). IMUs are placed
over the entire body on different body segments. First,
the body length, shoulder width, arm span and foot
size of the subject are measured. Sensors are placed
on the hands, wrists, upper arms, forearms, shoulders,
sternum, chest, pelvis and head. Each sensor consists
of a 3D accelerometer, gyroscope and magnetome-
ter. Those data are collected and bundled with the
use of MVN Studio at a frequency of 60 Hz. The
Xsens Awinda protocol ensures real-time sending and
receiving of data and handles data packet loss.
2.2 Experimental Protocol
A total of 12 healthy subjects (24 ± 4 years old) vol-
unteered to participate in the study. The data was col-
lected in two phases as part of two separate studies.
The first seven subjects were given the protocol Phase
One and the other five were asked to perform Phase
Two. The proposed protocol in our research has been
approved by the ethical committee in University of
Twente. All subjects filled in an informed consent
before doing the experiments. The participants are
asked to perform the following movements as seen in
figure 1 (a):
BIOSIGNALS 2019 - 12th International Conference on Bio-inspired Systems and Signal Processing
94

Figure 3: Complex task. Subjects were asked to move the
object from A to B, C, D separately with three different mo-
tion types (normal, light tremble, heavy tremble).
• A−B−A−C−A−D−A;
• B−C−D−B−D−C−B;
• pick up the object from ground and place it at A
and then pick up object from A and move it to ear,
finally put it back to A.
Then based on figure 1 (b), the motion sequences can
be grouped into the following three sections:
• Lift the object to height B’ and lower it back to
height A’– Move object from height A’ to height
B’ (place it at height B’) – Move object from
height B’ to height A’;
• at height A’, move object A−B−A−C−A;
• Move object from A to D at height B’− Move ob-
ject back to A− Use the dust cloth to clean the
table by going forth and back once.
The second phase of our protocol is as shown in
figure 2. This part consists of a horizontal task, ver-
tical task, front& back task and complex task. In
the first three tasks, subjects were asked to move a
small ball from point A to point B along different
routes (black, orange, green line in figure 2) in order
to mimic different smoothness degree of movements
(motion types). In the fourth task, subjects were asked
to move the ball along the diagonal of all three planes,
as seen in figure 3 and also with three motion types
(normal, light tremble and heavy tremble). The routes
in the fourth task were selected by the subjects. All
tasks were done three times. Before each task, there
was a short break before starting.
2.3 Weighted Activity Counts
Decomposition of the complicated motion makes it
possible to use euler angles to estimate the position
during the arm movement. Based on IMUs system,
acceleration and angular rate from sensors were used
to estimate the forearm orientation relative to the earth
referential frame. For this purpose, the gradient de-
scent orientation filter proposed by Madgwick et al.
(Madgwick et al., 2011) was selected. The algorithm
fuses sensor measurements of angular rate and grav-
ity into an optimal orientation estimate. It also as-
sures convergence from initial conditions and com-
pensates for drift in a vertical plane. In this algo-
rithm, the weighting of the accelerometer measure-
ments in the error correction β according to the def-
inition in (Madgwick et al., 2011). We set β to 0.03
as proposed by Madgwick (Madgwick et al., 2011).
After that, the algorithm calculates the orientation
value by numerically integrating orientation change
rate. Then, the estimated orientation change rate is
computed as the rate of change of orientation mea-
sured by the gyroscope, and the magnitude of the gy-
roscope measurement error β, which is removed in
the direction based on accelerometer and magnetome-
ter measurement (Madgwick et al., 2011). The fil-
ter outputs orientation in a quaternion representation
q = [q
0
,q
1
,q
2
,q
3
]. The euler angles φ, θ , and ψ can
then be computed from these quarternions. Variance
reflects the average distance from each point to the
average value in the whole motion procedure. In that
case, we use all the three angles’ variances to describe
the smoothness of the movement. Here,
N = f
s
· E poch (1)
where f
s
is sampling frequency in Hz; Epoch is
duration of each movement in second, and the prepa-
ration time of the movement should not be counted in
Epoch. Then, we define the Smoothness Degree (SD)
of the data points in the observation period as:
SD =
variance(φ) + variance(θ) + variance(ψ)
3
(2)
According to equation 2, when the movement
shows large variance in φ, θ , and ψ then, the SD
value will also be large, which shows that the move-
ment contains certain degrees of tremble on one or
more directions. The estimated SD is combined with
the weight of conventional Activity Counts (AC). AC
for epochs are calculated by equation 3 adapted from
(Janz, 1994):
AC =
1
N
N
∑
n=1
q
a
2
x,n
+ a
2
y,n
+ a
2
z,n
(3)
Here a
i,n
is the acceleration at time ‘n’ for the i-th
axis, and ‘N’ is the total number of samples. Using
the above, the Weighted Activity Counts(WAC) is de-
fined as:
WAC = SD · AC (4)
Measuring Upper-Extremity Use with One IMU
95

In this equation, WAC combines the movement’s
quality SD and the intensity AC together to capture
the smoothness degree of the movement.
2.4 Difference Acceleration Vector
Difference Acceleration Vector (DAV) is used to de-
tect movement of the arm by using 3D accelerome-
ters. The length of the DAV is calculated by subtract-
ing a reference gravitational acceleration vector g(n)
from the current acceleration vector a(n) and taking
the norm of the resulting vector. DAV is defined as:
1
N
N
∑
n=1
q
(a
x,n
− g
x
)
2
+ (a
y,n
− g
y
)
2
+ (a
z,n
− g
z
)
2
(5)
DAV takes the difference of the acceleration vec-
tor compared to a reference position which already
reduces the influences of gravitational acceleration
and possibly noise. In that case, no filter is applied
to the acceleration data when calculating the DAV
(Klaassen et al., 2016).
2.5 Integral of Absolute Value of
Acceleration
The Integral of Absolute value of Acceleration (IAA)
was firstly described by Bouten et al (Bouten et al.,
1994). Another known abbreviation of this method is
IMA, the integral of the modulus of the acceleration.
This method takes the integral of the absolute values
of the acceleration measured by accelerometer, as the
formula:
IAA =
Z
t
n
t
0
|
a
x
|
dt +
Z
t
n
t
0
|
a
y
|
dt +
Z
t
n
t
0
|
a
z
|
dt (6)
The IAA metric is estimated by filtering the ac-
celeration with a fourth order Butterworth zero phase
low-pass filter with a cut-off frequency of 20Hz to
attenuate the effect of frequencies that don’t arise
from voluntary movement as proposed by Bouten et
al (Bouten et al., 1994).
2.6 Root Mean Square
Schasfoort et al., describes the usage of the upper-
limb activity monitor (ULAM) (Schasfoort et al.,
2002), combined with the calculation of the root mean
square (RMS) (Bussmann et al., 2001). The RMS of
the signal was calculated after the band-pass filter-
ing (FIR, 0.3−16 Hz). Bussmann et al. (Bussmann
et al., 2001), proposed this metric to measure upper-
limb use from accelerometer data of the upper limb
and intensity.
2.7 Reference Metric (NGEC)
Estimate of energy of the movement using IMUs was
proposed by Aleshinsky et al. (Aleshinsky, 1986) and
Zaman et al. (Zaman et al., 2014). In order to sim-
plify the system and make it possible to be used in
obtrusive monitoring, we proposed Normalized Gross
Energy Consumption (NGEC) as the reference met-
ric. NGEC is based on the work done by Aleshinsky
et al. (Aleshinsky, 1986) which calculates the kinetic
energy consumption by using:
E
kin
=
1
2
· m ·
N
∑
n=1
v
2
2n
− v
2
1n
(7)
Where the absolute value means the energy con-
sumption should always be positive during the move-
ment and v
2n
and v
1n
represent the final and start ve-
locity respectively. In order to evaluate the gross en-
ergy consumption, we derive E
tot
as E
kin
+ E
pot
, giv-
ing
E
tot
=
N
∑
n=1
(
1
2
· m ·
v
2
2n
− v
2
1n
+m · g · (h
2n
− h
1n
))
(8)
where h
2n
and h
1n
represents the final and start
sensor position in global frame at adjacent points dur-
ing the movement.
In the calculation of both of these energies, the
mass is needed. This mass includes the mass of the
participant’s arm and the object that is being moved.
Since this mass is unknown and differs per subject,
it is also possible to calculate the specific energy in
J/kg, giving NGEC = E
tot
/m.
Before estimating the NGEC, the acceleration
data from the sensors was high-pass-filtered at 0.3Hz
in order to reduce the influence of gravity. Please
noted that the rotational kinetic energy during the
movements is not counted. In the following section,
we compare the WAC with the other four metrics
(IAA, RMS, AC, DAV).
In this section, data was processed and analyzed
using MATLAB (MathWorks Inc., Natick, MA).
3 RESULTS
3.1 Metrics Comparison
Using equation 3 and 4, combined with the accel-
eration data, we can get the value of AC and ulti-
mately, WAC. Figure 4 presents the different WAC
values among different motion types in each task.
BIOSIGNALS 2019 - 12th International Conference on Bio-inspired Systems and Signal Processing
96
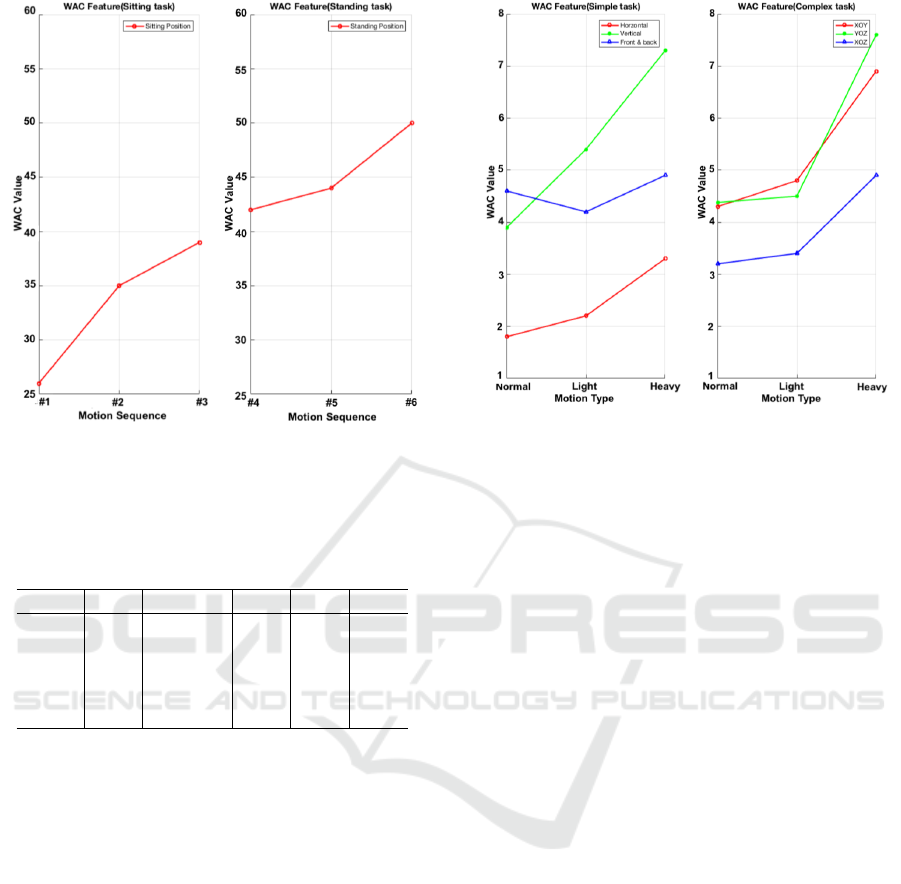
Figure 4: WAC value from hand worn sensor for different
motions: left panel showing sitting and right panel showing
the standing task.
Table 1: Comparing correlations among different metrics,
based on NGEC for the hand worn sensor in Phase One,
r > 0.7 is boldened.
Seq1 #1 #2 & #3 #4 #5 #6
WAC 0.82 0.90 0.90 0.90 0.95
AC 0.44 0.39 0.46 0.51 0.47
DAV 0.10 0.57 0.56 0.19 0.21
IAA 0.93 0.73 0.83 0.93 0.92
RMS 0.15 0.07 0.13 0.06 0.04
Two phases of the protocol are validated separately.
In Phase One, we compare the proposed metric WAC
with the other four state-of-art metrics, including AC,
DAV, IAA, RMS, as shown in Table 1. Based on the
difficulty of the motions, six sequences are made. Sit-
ting position: (#1) short distance, simple; (#2) a lit-
tle bit difficult, long distance and (#3) up and down,
more difficult; Standing position: (#4) up and down;
(#5) horizontal motion, short distance and (#6) forth
and back motion, short distance.
For the Phase Two of the protocol, the correlation
value when doing different tasks are compared in Ta-
ble 2 with high correlation coefficient value (r > 0.7)
marked in bold. The performance of the other four
conventional metrics is presented in Table 2. Finally,
we compare the correlation value (WAC and NGEC)
among different motion types (normal, light tremble,
heavy tremble) in Table 3. And Table 4 shows the SD
value of the three measurements. The trend between
WAC and motion type is seen in Figure 5.
Figure 5: WAC value from hand worn sensor for different
motions: left panel showing simple and right panel showing
the complex tasks.
3.2 Optimal Sensor Placement
To explore the optimal position of the sensor, the same
processing procedure was done by using the data from
forearm and upper arm respectively. The results are
provided in Table 5.
4 DISCUSSIONS
4.1 Summary of Assessment Results
This paper focuses on the assessment of arm usage in
remote rehabilitation system by using wearable sen-
sors. Since the multi-sensor systems maybe unsuit-
able for daily life (Burke et al., 2009), WAC is devel-
oped based on a single sensor. This metric combines
the activity count metric for upper extremities with a
smoothness metric. Based on the results of our exper-
imental protocol, the following three main discussion
points are focused in this paper:
• The performance of the proposed metric WAC un-
der different tasks.
• The comparison among state-of-the-art metrics.
• The optimal placement for the sensors to assess
the movements.
A two-phase protocol are designed to investigate
the assessment capability of WAC. In the first phase
of the protocol, subjects were asked to move an object
along the fixed path to mimic the simple movements
of patients. While in the second phase of the protocol,
Measuring Upper-Extremity Use with One IMU
97

Table 2: Comparing correlations among different metrics, using NGEC as reference for the hand worn sensor, for Phase Two.
r > 0.7 is boldened.
– Horizontal Vertical Front & Back XOY YOZ XOZ
WAC 0.72 0.87 0.82 0.99 0.96 0.93
AC 0.01 0.25 0.38 0.05 0.10 0.14
DAV 0.53 0.68 0.13 0.26 0.16 0.18
IAA 0.84 0.87 0.98 0.94 0.94 0.92
RMS 0.01 0.50 0.02 0.18 0.21 0.06
Table 3: Comparing correlation among tasks and motion
types. r > 0.9 is boldened.
– Normal Light Heavy Total
Horizontal 0.97 0.73 0.33 0.72
Vertical 0.88 0.45 0.53 0.87
Front & Back 0.98 0.86 0.61 0.82
XOY 0.96 0.92 0.76 0.99
YOZ 0.93 0.96 0.96 0.96
XOZ 0.95 0.87 0.94 0.93
Table 4: Variances of Euler angles for the horizontal test.
Motion Type φ θ φ Average SD
Normal 4.10 6.36 0.05 3.50
Light 1.23 28.32 0.26 9.93
Heavy 8.65 35.47 0.65 14.92
a 3D task was assigned to mimic the movements of
stroke patients in their daily life.
4.2 Task Assessment
In Table 1 and 2, we compared WAC with the other
existing arm usage metrics under the two phases sep-
arately. The results of the first experiment show that
WAC and IAA have the highest correlation with se-
lected reference NGEC for all movements (Table 1).
For the Phase Two, the comparison among different
metrics is shown in Table 2, in which the WAC is
compared with IAA, DAV and AC. Both the IAA and
WAC have better performance (correlation value is
higher). Moreover, when taking a close look at the
value, we can find IAA is better when assessing sim-
ple movements. For example, in Table 2, during the
XOY, YOZ or XOZ task, WAC shows higher correla-
tion than IAA, whereas during the Horizontal, Verti-
cal or Front & back tasks, IAA is better. Meantime,
the RMS metric show the lowest correlation for all
experiments. For DAV, the highest value (0.68) ap-
pears when doing Vertical tasks in phase two and the
poorest value appears when doing sequence 1 (#1)
tasks. Based on the principle of WAC, the smooth-
ness (or variance from it) of the motion adds weights
on AC and improves the influence of motion qual-
ity on the metric. Hence, from Table 2, conventional
AC and WAC show large differences in correlations
with NGEC. The average correlation value of AC is
0.16, which is almost six times less than WAC. Also,
in Table 1, when doing simple tasks, the difference
between the two is down 1.96 times. Overall, WAC
shows advantages when assessing arm usage in the
complicated tasks.
The same conclusion can be summarized from Ta-
ble 3. We divided the Phase Two tasks into differ-
ent groups (Horizontal, Vertical, Front & back, XOY,
YOZ, XOZ). The result shows that when doing more
complicated tasks (XOY, XOZ, YOZ), the correla-
tion value between the metric and NGEC is higher
than the other tasks. Especially, the highest value
(0.99) appears at XOY tasks and the least value 0.71
is seen for Horizontal tasks. Also, here we considered
three types of motion (Normal, Light, Heavy trem-
ble). When doing normal tremble movements, all the
tasks except Vertical tasks are able to get great results
(correlation value more than 0.98). The lowest value
of 0.33 appears when the subjects do the heavy trem-
ble during Horizontal tasks to mimic the patients, in
which only the starting and ending points of the whole
motion trace are fixed. While for the multi-type mo-
tion (the mixture of Normal, Light, Heavy tremble),
the result shows higher correlation (> 0.7).
Next, we focus on the metric WAC and our refer-
ence metric NGEC. Firstly, to see the relationship be-
tween WAC and motion types more clearly, we gen-
erate the line graph for both the two phases. In fig-
ure 4 (Phase One), we group the six sequences by
the degree of difficulty of the motions. As the mo-
tion becomes more complicated, the WAC value in-
creases. Also, in figure 5 (Phase Two), the motion
type changes from normal to heavy tremble, the WAC
value increases. In both simple tasks (Horizontal, Ver-
tical, Front & back) and complex tasks (XOY, XOZ,
YOZ) cases, WAC is available to show the difference
when the motion type is changing.
The difference between NGEC and WAC should
also be noted. WAC combines the typical feature of
AC and motion smoothness which addresses the ques-
tion of arm quality during the rehabilitation. The al-
BIOSIGNALS 2019 - 12th International Conference on Bio-inspired Systems and Signal Processing
98

Table 5: Comparing correlations between sensor placement and task, for all five subjects, and all kinds of motion types.
r > 0.9 is boldened.
Placement Horizontal Vertical Front & Back XOY YOZ XOZ
Hand 0.72 0.87 0.82 0.99 0.96 0.93
Fore Arm 0.90 0.96 0.99 0.98 0.86 0.91
Upper Arm 0.83 0.78 0.99 0.98 0.79 0.99
gorithms used on the WAC do not require a full body
biomechanical constraint, such as that needed for the
NGEC. The NGEC requires transformation of accel-
erations measured in the sensor frame to body frame,
and estimation of positions, which is complex and re-
quires more than one IMU. Therefore, NGEC, though
easy to interpret, is more computationally intensive
than WAC.
4.3 Optimal Sensor Placement
In Table 5 we compared the influence of sensor lo-
cation on the correlation with the reference metric.
Hand-worn sensor has better correlations when doing
the complex task, while the forearm-worn sensor is
better when doing the simple task (r > 0.9). This sug-
gests that the hand worn sensor is a preferable option
in daily life. However, from the perspective of user
friendliness, the forearm or wrist could be the pre-
ferred location.
4.4 Future Work
Following from the discussion above, recommenda-
tion for the future research can be done. No feasibility
study on stroke patients has been done in our work.
We collected the data from healthy subjects and as-
signed typical tasks to mimic the stroke patients. Fur-
ther validation with patients is required. Besides, both
the two phases experiments require the subject to do
the tasks without any ambulatory activities, either in
standing or sitting position. The hand-worn sensor
is sensitive to any kind of movements, e.g. the arm
swinging during the ambulatory. These movements
are inevitable for the patients during their daily life.
Further exploration on this topic should is also worth
to pay attention.
5 CONCLUSIONS
Daily-life monitoring for stroke patients is essential
for the rehabilitation therapy. Efficient and conve-
nient remote rehabilitation system is necessary for
the patients in the home environment. One of the
challenges in the analysis of patients’ daily-life per-
formance, compared to the assessment through stan-
dardized clinical tests in the hospital environment, is
the development of metrics for quantifying the move-
ments at home. In this work, we proposed a met-
ric that combines both the motion’s smoothness and
the quantity together to describe arm usage. In or-
der to validate the metric, we put forward normalized
gross energy consumption to evaluate the physical en-
ergy during the movement. WAC uses a single sensor
setup and is desirable as the convenience and usabil-
ity it provides to the stroke patients. The results of
both the simple 2D task and complex 3D task show
good performance (>0.9) when compared to NGEC.
WAC value also has relationship with motion types,
which provides possibility for detailed monitoring of
patients’ daily rehabilitation.
ACKNOWLEDGEMENTS
This work is part of the Perspectief programme Neu-
roCIMT with project number 14905 which is (partly)
financed by the Netherlands Organisation for Sci-
entific Research (NWO). The authors would like to
thank Dr. Hans Bussmann (Erasmus MC University
Medical Centre Rotterdam, Department of Rehabili-
tation Medicine) for his advice on this work and Lian
Beenhakker (University of Twente) who collected the
data that was used in Phase One.
REFERENCES
Aleshinsky, S. Y. (1986). An energy ’sources’ and ’frac-
tions’ approach to the mechanical energy expenditure
problem–i. basic concepts, description of the model,
analysis of a one-link system movement. Journal of
Biomechanics, 19(4):287–293.
Bouten, C. V., Westerterp, K. R., Verduin, M., and
Janssen, J. D. (1994). Assessment of energy ex-
penditure for physical activity using a triaxial ac-
celerometer. Medicine & Science in Sports & Exer-
cise, 26(12):1516–23.
Burke, J. W., Mcneill, M. D. J., Charles, D. K., Morrow,
P. J., Crosbie, J. H., and Mcdonough, S. M. (2009).
Optimising engagement for stroke rehabilitation using
Measuring Upper-Extremity Use with One IMU
99

serious games. Visual Computer International Journal
of Computer Graphics, 25(12):1085–1099.
Bussmann, J. B., Martens, W. L., Tulen, J. H., Schasfoort,
F. C., Hj, B. E., and Stam, H. J. (2001). Measuring
daily behavior using ambulatory accelerometry: The
activity monitor. Behavior Research Methods Instru-
ments & Computers, 33(3):349–356.
Hale, L. A., Pal, J., and Becker, I. (2008). Measuring
free-living physical activity in adults with and with-
out neurologic dysfunction with a triaxial accelerom-
eter. Archives of Physical Medicine & Rehabilitation,
89(9):1765–1771.
Janz, K. F. (1994). Validation of the csa accelerometer for
assessing children’s physical activity. Medicine & Sci-
ence in Sports & Exercise, 26(3):369–75.
Klaassen, B. (2015). A system for monitoring stroke pa-
tients in a home environment. In Biostec Healthinf,
pages 125–132.
Klaassen, B., Bartels, P. G. H., Beijnum, B. J. F. V., and
Hermens, H. (2016). The development and evaluation
of an arm usage coach for stroke survivors. In Inter-
national Conference on Sensing Technology.
Leuenberger, K., Gonzenbach, R., Wachter, S., Luft, A.,
and Gassert, R. (2017). A method to qualitatively as-
sess arm use in stroke survivors in the home environ-
ment. Medical & Biological Engineering & Comput-
ing, 55(1):141–150.
Lyle, R. C. (1980). A performance test for assessment of up-
per limb function in physical rehabilitation treatment
and research. International Journal of Rehabilitation
Research, 4(4):483–492.
Madgwick, S. O., Harrison, A. J., and Vaidyanathan, A.
(2011). Estimation of imu and marg orientation using
a gradient descent algorithm. In IEEE International
Conference on Rehabilitation Robotics, pages 1–7.
Roetenberg, D., Luinge, H., and Slycke, P. (2009). Xsens
mvn: Full 6dof human motion tracking using minia-
ture inertial sensors. Xsens Motion Technologies Bv.
Rohrer, B., Fasoli, S., Krebs, H. I., Hughes, R., Volpe,
B., Frontera, W. R., Stein, J., and Hogan, N. (2002).
Movement smoothness changes during stroke recov-
ery. Journal of Neuroscience, 22(18):8297–8304.
Sanford, J., Moreland, J., Swanson, L. R., Stratford, P. W.,
and Gowland, C. (1993). Reliability of the fugl-meyer
assessment for testing motor performance in patients
following stroke. Physical Therapy, 73(7):447–54.
Schasfoort, F. C., Bussmann, J. B. J., and Stam, H. J.
(2002). Ambulatory measurement of upper limb us-
age and mobility-related activities during normal daily
life with an upper limb-activity monitor: A feasibility
study. Medical & Biological Engineering & Comput-
ing, 40(2):173–182.
Uswatte, G., Foo, W. L., Olmstead, H., Lopez, K., Holand,
A., and Simms, L. B. (2005). Ambulatory monitoring
of arm movement using accelerometry: an objective
measure of upper-extremity rehabilitation in persons
with chronic stroke. Archives of Physical Medicine &
Rehabilitation, 86(7):1498–1501.
Uswatte, G., Miltner, W. H., Foo, B., Varma, M., Moran, S.,
and Taub, E. (2000). Objective measurement of func-
tional upper-extremity movement using accelerometer
recordings transformed with a threshold filter. Stroke,
31(3):662–667.
Van Meulen, F. B., Klassen, B., Held, J., Reenalda, J.,
Buurke, J. H., Van Beijnum, B.-J. F., Luft, A., and
Veltink, P. H. (2015). Objective evaluation of the qual-
ity of movement in daily life after stroke. Frontiers in
Bioengineering and Biotechnology, 3(210):1.
van Meulen, F. B., van Beijnum, B. F., Buurke, J. H., and
Veltink, P. H. (2017). Assessment of lower arm move-
ments using one inertial sensor. In International Con-
ference on Rehabilitation Robotics, pages 1407–1412.
Xu, J., Wang, Y., Barrett, M., Dobkin, B., Pottie, G. J., and
Kaiser, W. (2016). Personalized, multi-layer daily life
profiling through context enabled activity classifica-
tion and motion reconstruction: An integrated systems
approach. IEEE J Biomed Health Inform, 20(1):177–
188.
Zaman, K. I., White, A., Yli-Piipari, S. R., and Hnat, T. W.
(2014). K-sense: Towards a kinematic approach for
measuring human energy expenditure. In Wireless
Sensor Networks: 11th European Conference, volume
8354, pages 166–181.
BIOSIGNALS 2019 - 12th International Conference on Bio-inspired Systems and Signal Processing
100
