
Physical Activity Recognition by Utilising Smartphone Sensor Signals
Abdulrahman Alruban
1,2
, Hind Alobaidi
1,3
, Nathan Clarke
1,4
and Fudong Li
1,5
1
Centre for Security, Communications and Network Research,
Plymouth University, Plymouth, U.K.
2
Computer Sciences and Information Technology College, Majmaah University, Majmaah, Saudi Arabia
3
College of Education for Pure Science, University of Baghdad, Baghdad, Iraq
4
Security Research Institute, Edith Cowan University Perth Western Australia, Australia
5
School of Computing, University of Portsmouth, Portsmouth, U.K.
Keywords: Human Activity Recognition, Smartphone Sensors, Gait Activity, Gyroscope, Accelerometer.
Abstract: Human physical motion activity identification has many potential applications in various fields, such as
medical diagnosis, military sensing, sports analysis, and human-computer security interaction. With the recent
advances in smartphones and wearable technologies, it has become common for such devices to have
embedded motion sensors that are able to sense even small body movements. This study collected human
activity data from 60 participants across two different days for a total of six activities recorded by gyroscope
and accelerometer sensors in a modern smartphone. The paper investigates to what extent different activities
can be identified by utilising machine learning algorithms using approaches such as majority algorithmic
voting. More analyses are also provided that reveal which time and frequency domain-based features were
best able to identify individuals’ motion activity types. Overall, the proposed approach achieved a
classification accuracy of 98% in identifying four different activities: walking, walking upstairs, walking
downstairs, and sitting (on a chair) while the subject is calm and doing a typical desk-based activity.
1 INTRODUCTION
Human physical activity identification has gained
considerable amount of attention due to the prevalent
use of smartphone devices and motion sensing
technology advancement that facilitates the
monitoring of human activities by small portable
devices. The majority of modern smartphones have a
number of built-in sensors (e.g., GPS, accelerometers,
magnetometers, gyroscopes, barometers, temperature
and humidity sensors) that can be utilised to record a
variety of individuals’ activity signals. This has
enabled research in activity-based computing to
become a cornerstone of many real-life applications in
health care, the military, navigation, localisation,
biometrics, sport analytics and security (He and Li,
2013; Mitchell, Monaghan and O’Connor, 2013;
Bayat, Pomplun and Tran, 2014; Al-Naffakh et al.,
2016; Ronao and Cho, 2016). Researchers in the field
of human activity identification have utilised a
number of techniques to enhance the accuracy of
activity type recognition, mostly based on acceleration
and angular velocity signals using accelerometer and
gyroscope sensors embedded in mobile devices. The
sensors generate tri-axial linear signals which can be
processed and segmented into less noisy features that
provide a latent pattern that captures the context of the
motion activity type. Prior research has focused
mainly on the performance of the approaches
developed in solving a particular problem, such as
activity identification, which has meant that there has
been little focus on interpreting how the identification
decision was made in the case of machine learning
modelling (Lara and Labrador, 2013; Jiang and Yin,
2015; Ha and Choi, 2016). This includes investigating
which feature contributed the most to the
identification (prediction) process. The majority of
human activity recognition public datasets upon
which much of the literature has been built also have
a limited number of participants and samples (Altun,
Barshan and Tunçel, 2010; Anguita et al., 2012;
Reyes-Ortiz et al., 2014). This presents challenges to
understanding whether the captured activity signals of
an individual vary over time (e.g., across days), as,
typically, most of these datasets were collected on the
same day.
Therefore, this study investigates the effect of
using a feature ranking approach prior to the activity
342
Alruban, A., Alobaidi, H., Clarke, N. and Li, F.
Physical Activity Recognition by Utilising Smartphone Sensor Signals.
DOI: 10.5220/0007271903420351
In Proceedings of the 8th International Conference on Pattern Recognition Applications and Methods (ICPRAM 2019), pages 342-351
ISBN: 978-989-758-351-3
Copyright
c
2019 by SCITEPRESS – Science and Technology Publications, Lda. All rights reserved

identification process by utilising random forest
classification (Palczewska et al., 2014), as this
algorithm analyses which independent variable(s)
contributed most during the training phase of a
learning algorithm. This is undertaken by examining a
dataset of 60 participants, which was collected for this
study over two days. Finally, the proposed approach
is evaluated by building a predictable model that is
able to categorise a given individual’s activity signals
into predefined classes (i.e., normal walk, fast walk,
walk with bag, walk upstairs, walk downstairs, and
sitting). The modelling utilises three supervised
machine learning classification algorithms: eXtreme
Gradient Boosting (XGB), a feedforward neural
network (NN) and a support vector machine (SVM).
The rest of the paper is organised as follows:
Section 2 highlights related work in the area of human
activity identification using mainly smartphone
sensors. Section 3 explains the data collection and
experimental methodology. Section 4 presents the
experimental results of the different tests undertaken
to evaluate the proposed approach. Section 5 discusses
the findings and possible future work. The paper
concludes in Section 6.
2 BACKGROUND AND RELATED
WORK
Human activity recognition is a wide research field
and studies in this area vary in a number of aspects.
For instance, some studies can be categorised based
on the way the data was collected, such as those using
wearable sensors (e.g., smartwatch-mounted body
devices) or smartphone devices, while other studies
use video observation to record individuals’ activity
signals. With respect to devices such as smartphones,
a key advantage is that the sensors are embedded, and
no additional hardware is needed; only the software
needs to be developed to start collecting activity
motion signals. Therefore, much of the research has
employed smartphones to record various types of
individual activities in a user-friendly, unobtrusive,
and periodic manner (Kwon, Kang and Bae, 2014;
Capela et al., 2016; Shoaib et al., 2016). Most of the
studies that have utilised smartphone-embedded
sensors place the device either in a pouch or inside a
trouser pocket (Ganti, Srinivasan and Gacic, 2010;
Bieber et al., 2011; Hamm et al., 2013; Antos, Albert
and Kording, 2014; Bahle et al., 2014). In terms of
activity recognition performance, in San-Segundo,
Blunck, Moreno-Pimentel, Stisen, and Gil-Martín,
2018 study, the authors conducted a comprehensive
evaluation of smartphone- and smartwatch-based
human activity recognition, and found that
smartphones mostly outperformed smartwatches in
recognising activity type. This was due to the greater
noise in the recordings from smartwatch sensors.
Typically, both devices record activity signal data
using the tri-axis signals of accelerometer and
gyroscope sensors at a sampling rate ranging from 20
to 50 signals per second.
A number of approaches are used for data pre-
processing and feature extraction, including cycle-
based, segment-based and deep learning algorithms.
In a cycle-based approach, the captured activity data
are supposed to be a periodic signal in which each
cycle begins once a foot touches the ground and
finishes when the same foot touches the ground for the
second time (i.e., two steps for a human) (Derawi and
Bours, 2013). In a segment-based method, the signals
are divided into fixed time-length windows (e.g., 10
seconds). Some gait activities are periodic, as each
time segment is reasonably assumed to contain similar
signal features, while some activity streams, such as
standing and sitting, do not necessarily generate cycle-
like patterns. In addition, the segmenting of the signals
based on a time sequence requires fewer
computational operations than the cycle-based method
does.
In contrast with the cycle- and segment-based
approaches, some researchers have utilised deep
learning to meet the challenges of the feature
extraction process. With the recent advances in deep
learning algorithms, the use of convolutional neural
network (CNN) learning algorithms to extract a latent
pattern from raw data has become common practice
(Jiang and Yin, 2015; Ronao and Cho, 2016).
Typically, deep learning approaches require less effort
in feature extraction and engineering in comparison
with cycle- and segment-based approaches. However,
a challenging aspect in deep learning-based models is
that it is hard to explain and interpret how decisions
are made (Weld and Bansal, 2018). Knowing what
drives decisions in models (i.e., the features on which
the model relies) is an important element in some
activity recognition applications, such as health care-
related research.
In (Kwapisz, Weiss and Moore, 2010), the study
used a neural network to model human activity and
Physical Activity Recognition by Utilising Smartphone Sensor Signals
343
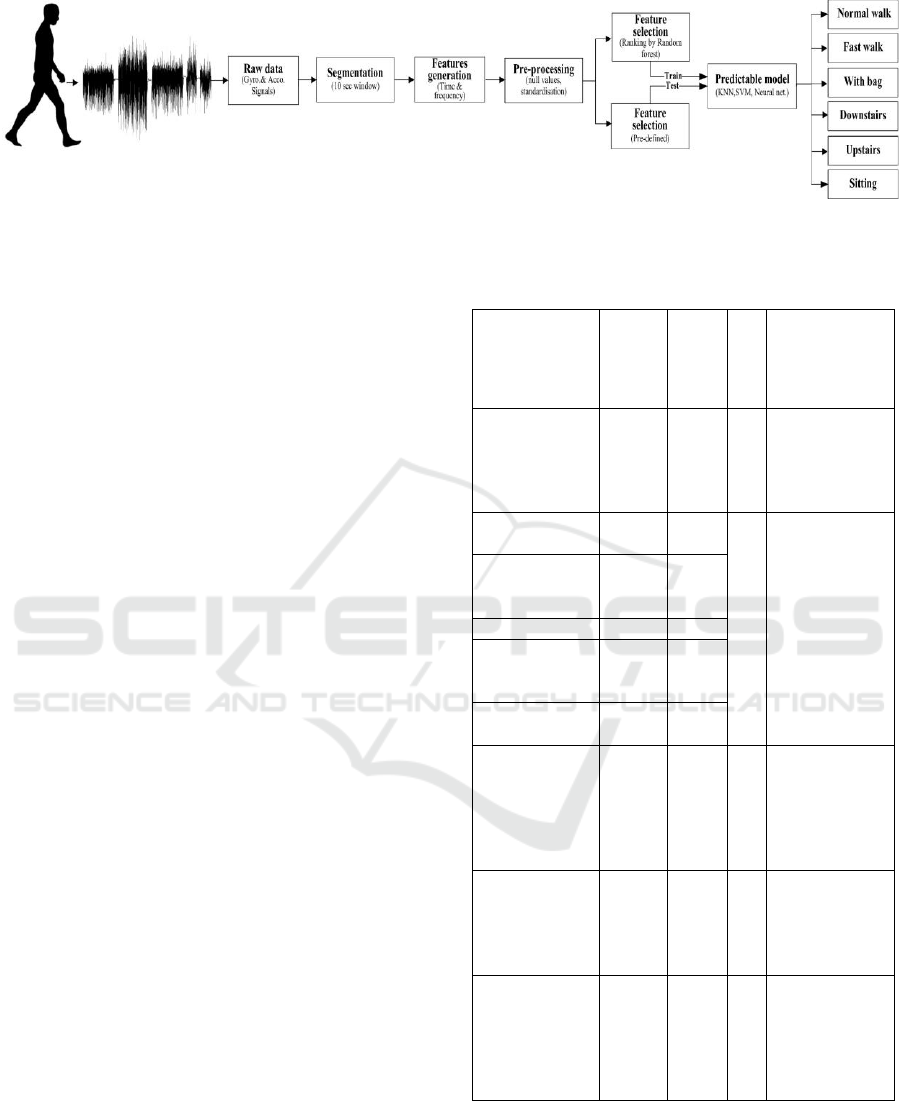
Figure 1: Data process pipeline.
achieved high accuracy in identifying the correct class
to which the activity signals belonged. However, the
limited number of population samples (i.e., 5-30)
opens the possibility that the learned algorithm is
overfitted and has memorised the training samples.
Other studies, as shown in Table 1 (Ganti,
Srinivasan and Gacic, 2010; Anguita et al., 2012;
Nakano, 2017; Bhanu Jyothi and Hima Bindu, 2018;
Ogbuabor and La, 2018), have used a sliding window
approach with an overlap of 50% in segmenting the
raw activity signals. This could, however, lead to an
overlap in the subsampling between the training and
testing sets, which means that unless the splitting of
the two sets occurs before the segmenting of the raw
data, the data are only partially seen by the learning
algorithm in both the training and testing sets. In terms
of the correct classification rate, it can be seen that
SVM, neural network and CNN achieve the highest
performance among the techniques shown.
In this study, a segment-based approach is used to
extract features from raw sensor signal data with a
sliding window of 10 seconds with no overlap. The
extracted features are used to compute various
statistical features, such as the mean, median,
maximum and minimum of a given sensor axis within
a specific segment window (as explained in detail in
section 3). By handcrafting these features, it is
possible to understand which of the features
contributed most effectively to discriminating
individuals’ activities (as presented in Section 4). In
comparison with existing studies in which the data
were gathered from smartphones, as presented in
Table 1, most of these studies have fewer participants,
(i.e., 30 or fewer) and the data were all captured during
the same day. In this study, the data were collected
between two days for everyone within the sample set
because the probability that users’ activity patterns
change is higher for data collected across days than it
is for data gathered on the same day.
Table 1: Comparison of prior studies in activity recognition
using smartphone sensors.
Study
Approach
Performance
(CCR%)
Population
Activity Type
(Kwapisz, Weiss
and Moore,
2010)
NN
100
5
Standing, sitting,
walking,
jogging,
downstairs,
upstairs
(Anguita et al.,
2012)
SVM
89
30
Standing,
sitting,
walking, lying
down,
downstairs,
upstairs
(Ganti,
Srinivasan and
Gacic, 2010)
SVM
96
(Nakano, 2017)
CNN
90
(Bhanu Jyothi
and Hima
Bindu, 2018)
RF
PCA
94
89
(Ogbuabor and
La, 2018)
MLP
95
(Jiang and Yin,
2015)
CNN
99
10
Standing, sitting,
walking,
jogging,
running, biking,
downstairs,
upstairs
(Heng, Wang
and Wang,
2016)
SVM
85
5
Standing,
walking,
running,
upstairs,
downstairs
(Saha et al.,
2018)
Ensembl
e
94
10
Sitting on a
chair, sitting on
the floor, lying
right, lying left,
slow walk, brisk
walk
Legend: CCR: correct classification rate; ML: machine learning;
PCA: principal component analysis; MLP: Multi-layer perceptron;
RF: random forest.
ICPRAM 2019 - 8th International Conference on Pattern Recognition Applications and Methods
344
3 METHODOLOGY
This study follows the data pipeline flow presented in
Figure 1. The overall process starts by capturing the
raw activity signals from smartphone sensors,
followed by segmenting the data with time windows
of 10 seconds. Once the data are segmented, they are
processed to extract statistical features. This is
followed by standardising feature space values and
ranking those features using random forest algorithms.
After that, the activity samples are fitted into the
learning algorithm to train the predictable model. The
process is explained in more detail in the following
subsections.
3.1 Data Collection Sensors and Device
The developed approach utilises embedded smartphone
motion sensors: the gyroscope and the accelerometer. A
gyroscope is used to maintain a reference direction in
the motion systems by sensing the degree of
orientation in the x, y, and z directions of the
smartphone. The axis signal is affected by the
direction of the device orientation. Also, the
accelerometer sensor measures the acceleration in
metres per second squared (m/s2) in the x, y, and z
directions of the smartphone. Figure 3 show the
orientation of the positive and negative x, y, and z-
axes for a typical smartphone device using the
gyroscope and accelerometer sensors respectively. An
Android application called AndroSensor was used to
record the sensor data as it supports most of the
sensors that an Android device can offer (F, no date).
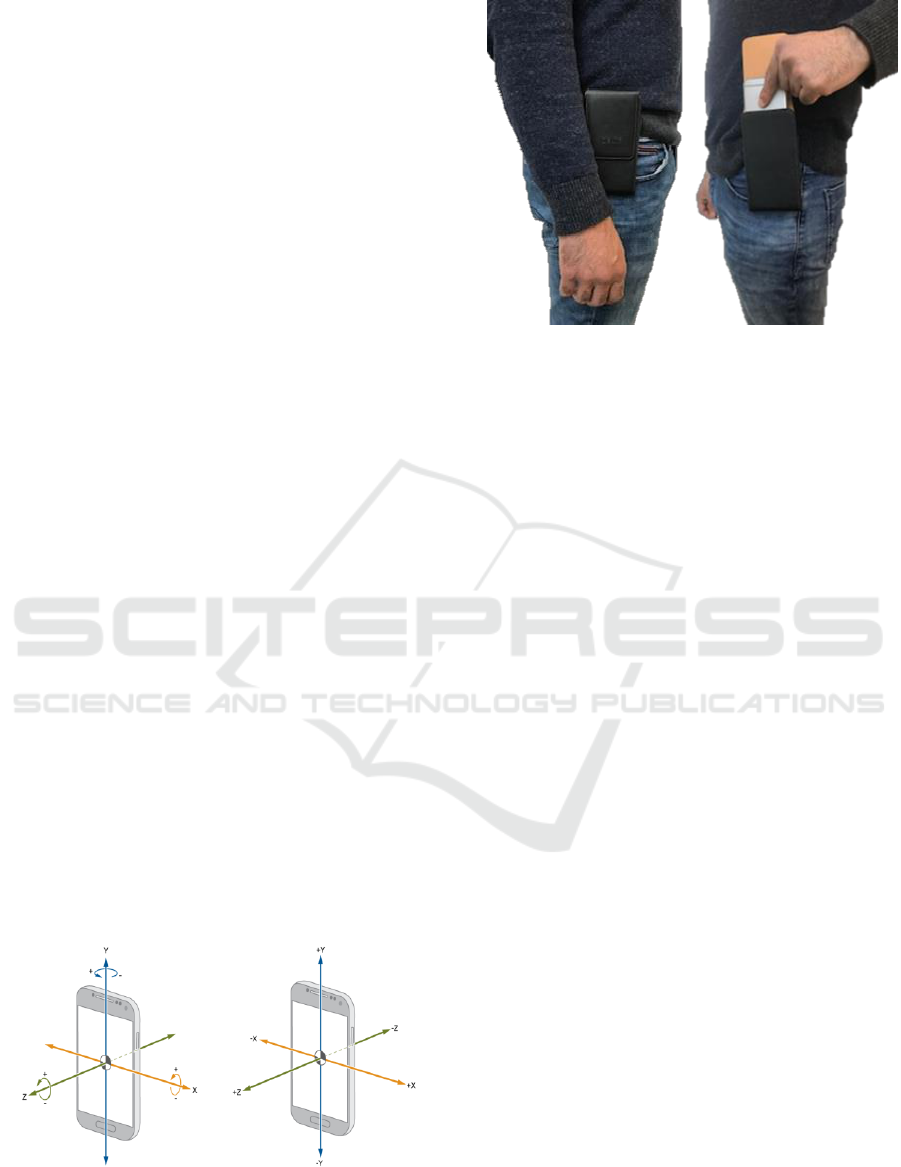
A Samsung Galaxy S6 smartphone was carried by
each individual to record the sensor data generated by
different human physical activities. Each user was
asked to place the smartphone in a belt pouch, as
presented in Figure 4 The generated data were
continuously collected at a rate of 30-32 Hz for the x,
y, and z-axes of both the accelerometer and gyroscope
sensors.
Figure 2: Orientation of the
axes relative to a typical
smartphone device using a
gyroscope sensor.
Figure 3: Orientation axes
relative to a typical
smartphone device using an
accelerometer sensor.
Figure 4: Smartphone device located inside a pouch.
3.2 Data Collection Scenarios
During the data collection process, each individual
was asked to walk normally, fast, and normally with a
bag on a predefined route (along a flat corridor) for a
period of 3 minutes for each activity. For more
realistic scenarios, the participant had to stop to open
a door and walk back and forth along the corridor a
number of times. This was followed by walking
downstairs for three levels and upstairs for the same
three levels, which resulted in a total number of 126
steps (63 for each direction). Between each activity,
the participant was asked to stop for 15 to 20 seconds
to rest as well as to allow the later manual separation
of the generated signals into their corresponding
activities. Ten sessions of user activities were
collected per user: five sessions were from one day,
and the other five sessions were collected one week
later from the same participant, in addition to a sitting
activity for 19 of the participants. The users were
permitted to wear different footwear and clothing for
the second day of data collection. In total, 60 users
participated in the data collection exercise; 35
participants were male and 25 were female, and they
were aged between 18 and 56 years old.
Upon completion of the data collection phase,
users’ activities were divided into six datasets aligned
to each activity (i.e. normal walk, fast walk, walk with
a bag, downstairs walking, upstairs walking, and
sitting). Then the tri-axial raw accelerometer and
gyroscope signals were segmented into 10-second
segments using a sliding window approach with no
overlapping to compute the feature set that is
explained in the next subsection.
Table 2 shows the collected dataset information.
Physical Activity Recognition by Utilising Smartphone Sensor Signals
345

Table 2: Dataset information.
Activity type
#User
#Raw signal
samples
per
user
(~32\sec)
Processed #samples
per
user
#Seconds
per
user
Total #samples
Normal
60
7,168
28
280
1,680
Fast
60
7,424
29
290
1,740
W/bag
60
6,912
27
270
1,620
Downstairs
60
1,792
7
70
436
Upstairs
60
1,536
6
60
410
Sitting
19
4,096
52
160
997
3.3 Feature Extraction
The raw signal data generated by the gyroscope and
accelerometer were processed by computing the time
and frequency domain features as this is a standard
approach to generating a feature vector. These
features were extracted from the users’ data segments.
The time domain features were calculated directly
from the raw data samples, while a Fourier transform
was applied to the raw signals across the three sensor
axes before computing the frequency domain-based
features set. This process generated 304 unique
features from the two domains, as listed in Table 3.
Table 3: Generated features.
Feature
domain
Feature type (count)
Time and
frequency
Mean (3), standard deviation (3), median (3),
variance (3), covariance (3), zero crossing
rate minimum, interquartile range, average
absolute, difference (3), root mean square (3),
skewness (3), kurtosis (3), percentile 25 (3),
percentile 50 (3), percentile 75 (3), maximum
(3), minimum (3), correlation coefficients (3),
average resultant acceleration (1)
Time only
Difference (3), maximum value (4), minimum
value (4), binned distribution (3), maximum
peaks (3), minimum peaks (3), peak
occurrence (3), time between peaks (3),
interquartile range (3)
Frequency
only
Entropy (3), energy (3)
3.4 Modelling
Data modelling aims to build a predictable model able
to classify a given individual’s activity signals into the
class to which it belongs, based on the features
extracted from the raw sensor data (in this case, normal
walk, fast walk, walk with bag, downstairs, upstairs,
and sitting). The following steps were undertaken
before fitting the samples into the selected machine
learning algorithms.
3.4.1 Data Pre-processing
Two approaches (i.e., normalisation and
standardisation) were examined for transforming data.
The dataset was normalised by scaling the input vectors
individually to the unit norm (vector length). The other
transformation approach was to standardise the features
by removing the mean and scaling to the unit variance.
The latter approach (standardisation) emerged as better
than the former (normalisation) in discriminating the
activity samples for the tested dataset.
3.4.2 Feature Selection
In order to reduce the feature vector dimensions, only
those ranked as being of higher importance in
contributing most effectively to discriminating
individuals’ activities by the random forest algorithm
were included in training the predictable model. The
variable importance measure of the random forest
calculates how significantly a given feature is biased
towards correlated predictor variables (Strobl et al.,
2008). Feature importance analysis using random forest
reduced the feature vector from 304 to 195 features in
the final model based on the training set data. Reducing
the feature space dimensionality not only improves
overall model performance, but also lowers the
probability of the algorithm being overfitted to the
training data.
3.4.3 Train and Test Split Ratio
The cross-validation (CV) approach was used to train
and validate the base model as non-stratified fashion.
Using CV tends to decrease the probability of
overfitting. The dataset was split into five consecutive
folds without shuffling. Each fold was then used once
as a validation while the remaining four folds formed
the training set.
3.4.4 Classification Algorithms
Three supervised machine learning classification
algorithms were examined using: NN, SVM and XGB.
ICPRAM 2019 - 8th International Conference on Pattern Recognition Applications and Methods
346
The XGN parameters are (n_estimators:500,
max_depth:3, min_samples_leaf=4, max_features:
0.2). The SVM parameters are (C=1.6, kernel:’rbf’).
The NN algorithm was tweaked by hyper-parameter
tuning, using a grid-search approach as shows in table 4.
Table 4: summary of neural network tuned parameters.
Parameter
Value
#of epoch
500
#of hidden layers
1
#of hidden nodes
130
Dropout rate
0.6
Hidden activation
function
Relu
Output activation
function
Softmax
Kernel initialiser
Uniform
Loss function
Categorical cross entropy
Optimiser
Stochastic gradient descent (SGD)
4 EXPERIMENTAL ANALYSIS
As the feature vector contains 304 features,
dimensionality reduction helped in improving the
overall model performance. Therefore, the random
forest algorithm was used to rank the feature sets
based on their contribution to the decision being made
in predicting the target variable (activity) using the
algorithm. The features space was fitted into the
algorithm and performed a conventional multi-class
classification task. Once the model was trained,
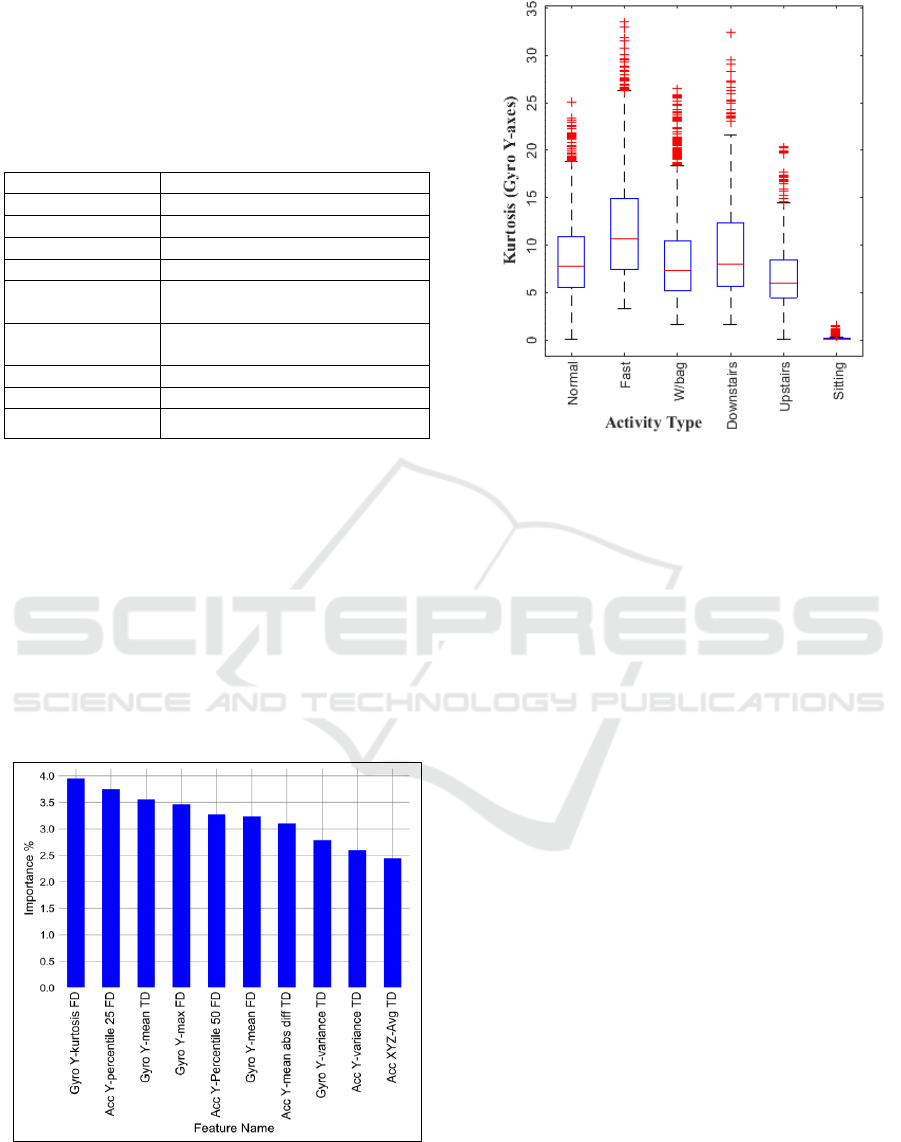
Figure 5: Top 10 features ranked using the random forest.
Figure 6: Kurtosis of the gyroscope y-axis.
querying the features importance variable resulted in
a list of all the independent variables and their ranks
to measure how significant the features are in
discriminating the target classes (human physical
activities in the context of this study). Figure 5
illustrates the top 10 ranked features of all those
examined using the random forest algorithm.
Figure 6 illustrates the top-ranked feature,
‘Kurtosis’, which is a measure of the shape for the
values in a particular segment. The plot depicts the
Kurtosis data of the six activities through their
quartiles. It is apparent from this descriptive statistic
that there is clear variability across the activities
examined for this feature. Although normal walk and
walk with bag are two different activities, they are, by
their nature, very similar in terms of pace and type of
body movement. This is clearly seen in Figure 6, as
the median and first and third quartiles are almost
equal for this feature as computed by the random
forest algorithm. When examining the confusion
matrix for the predictable model (later in this section),
most of the false positive samples are also between
these two activities, which supports the point being
made here.
In contrast, Figure 7 presents the lowest-ranked
feature, which corresponds to the binned distribution
of the minimum and maximum accelerations of the z-
axes in the segments. Almost all the activity values of
this feature are identical, except for sitting. This
descriptive analysis visually validates the output of the
algorithmic feature ranking approach as the top-
ranked features have more variability than those
ranked lower.
Physical Activity Recognition by Utilising Smartphone Sensor Signals
347
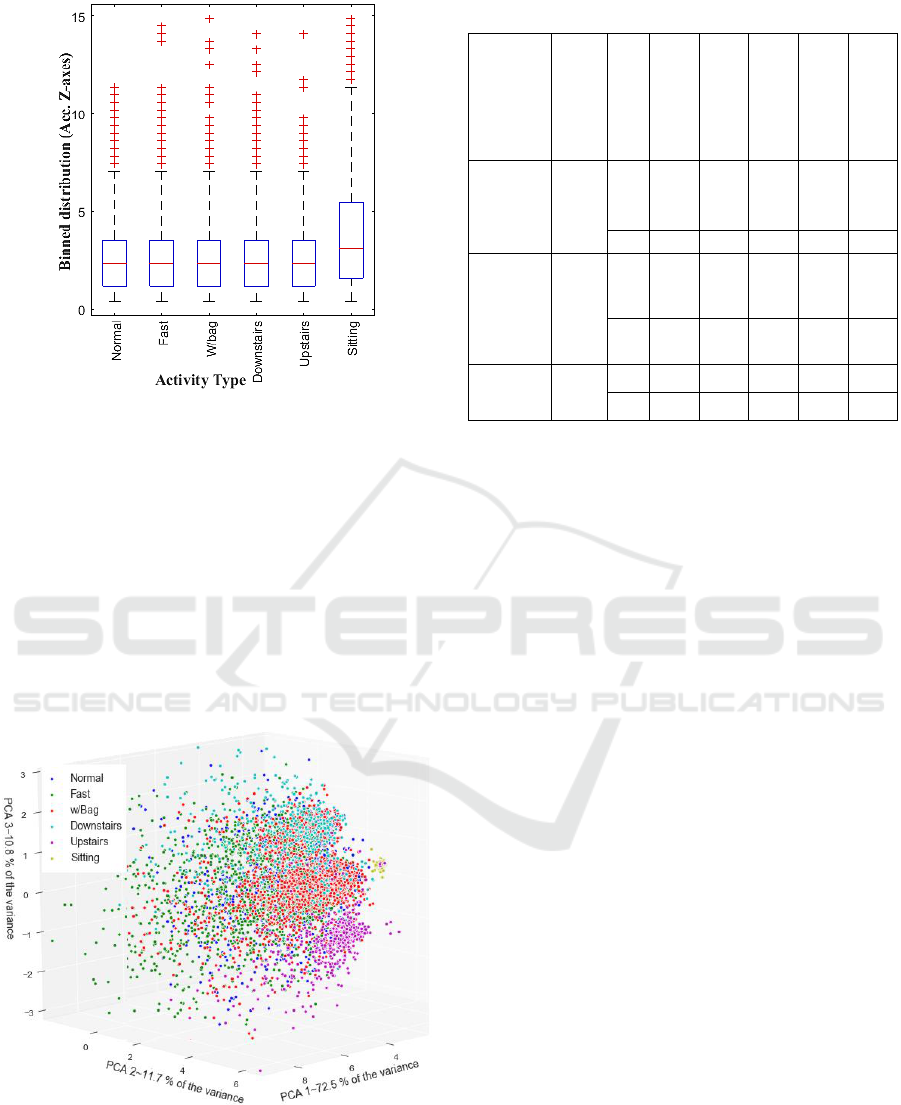
Figure 7: Binned distribution of the accelometer z-axis
feature.
When plotting the data points by transforming the
top 10 ranked features using the PCA algorithm, the
activity data points tend to be located close to each
other in the PCA feature space (Goodall and Jolliffe,
2002; Bro and Smilde, 2014). Figure 8 shows the
dataset observations for the six activities utilising the
first three principal components. The first, second and
third PCs used in this plot explain 72.5%, 11.7% and
10.8% of the total variance, respectively, the total
variance being the sum of the variances of all the
individual PCs.
Figure 8: PCA data points scattered using the top 10 ranked
features.
Table 5: Overall classification accuracy for each model.
Activity type
Activity merge
#Features
XGB
(%)
SVM
(%)
NN (%)
Soft voting
(%)
Hard voting
(%)
Normal,
Fast,
Downstairs,
Upstairs,
Sitting
W/bag
merged
with
Normal
195
93.54
93.35
93.88
94.60
94.27
304
93.11
93.30
93.50
94.17
93.64
Walk,
Downstairs,
Upstairs,
Sitting
Fast
and
W/bag
merged
with
Normal
195
97.06
97.30
97.65
97.79
97.54
304
97.01
97.15
97.49
97.73
97.49
All
None
195
86.18
84.88
87.67
87.79
87.24
304
84.64
84.54
84.83
87.14
86.95
It is apparent that some outliers sit far from their
group or overlap with another group, and these could be
misclassified by the predictable model built. However,
outliers were included in the classification tests and
were not excluded from any process within this
experiment, as they are real-world samples.
Three different experimental settings were
undertaken to study how various activity types affected
the identification rate. First, as normal walk and walk
with bag are the most similar activity types, they were
merged to form a single activity. The second test
merged normal, fast, and walk with bag into a single
activity. The final test examined the correct
classification rate for all the activities. Two types of
voting were used: hard and soft majority voting.
Using only an accuracy metric does not fully reveal
overlapping and false positive rates among the classes,
as it computes the ratio of true predicted labels to the
total examined sample, which becomes insensitive to
unbalanced classes. Therefore, an F score is computed,
which is interpreted as the weighted mean of the
precision and recall. An F score of 1.0 is the highest and
a lowest score of 0.0 is the lowest. It worth mentioning
that it is common to use F score for binary classification
problems, however, adapting the metric for multiclass
problem is achieved using one label versus all other
labels. In which, the relative contribution of precision
and recall to the F score is equal, as Figure 9 illustrates.
Figure 9 shows that sitting and walking upstairs
have the highest F-score. In contrast, walking
downstairs has the lowest recall and F-score rates in
comparison with the other activities. Also, the figure
shows the support of each class which represents the
number of occurrences of each class in the test set.
ICPRAM 2019 - 8th International Conference on Pattern Recognition Applications and Methods
348
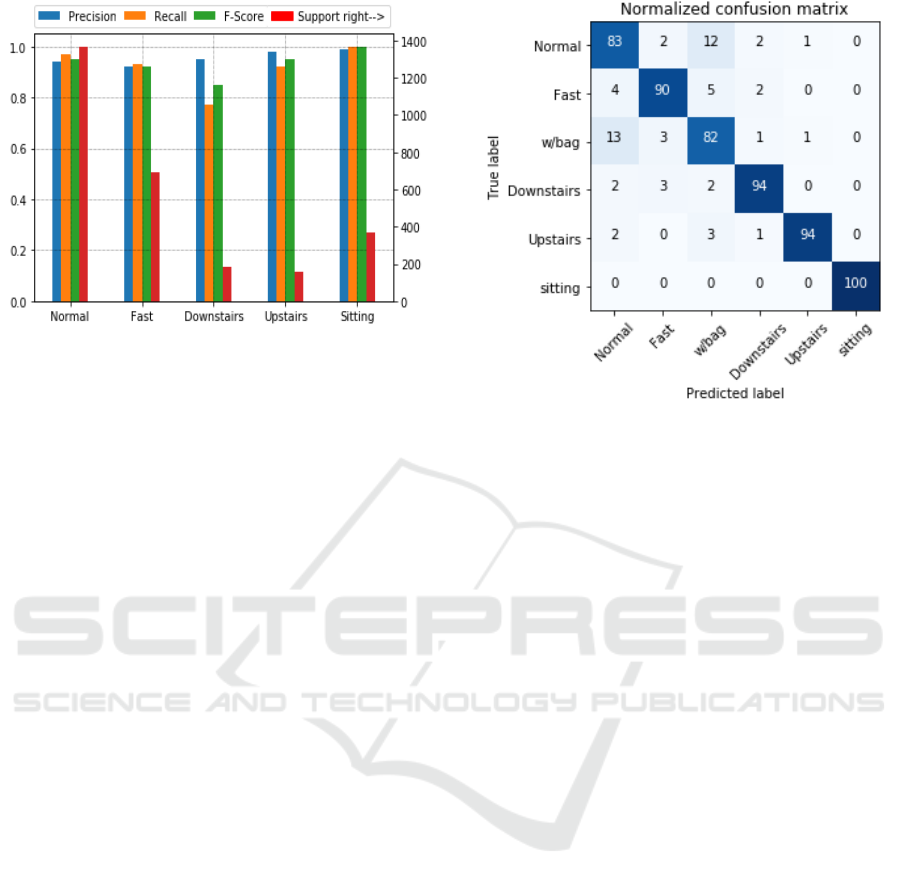
Figure 9: Precision, recall, F-score and support of five
activities (walk with bag samples are merged with normal
walk).
The confusion matrix summarises the performance of
the classification model for the multi-class
classification task in this study (in particular the soft
voting model). It also shows how the predictable
model performs on a class level, in which both true-
positive and false-negative values can be measured.
presents the normalised confusion matrix for the
percentages for all six activities. It is not surprising
that sitting has the highest prediction rate of the
activities. This is due to the uniqueness of its
generated sensor signals, as in both the top- and low-
ranked features, it was clearly distinguished from the
other activities.
The finding is also consistent with the box-plots in
Figure 6 and Figure 7, in which the misclassified
samples of the normal walk activity are mostly
assigned to the walk with bag activity and vice versa.
With regard to the downstairs activity, the false-
positive samples are misclassified as walking types
(either normal, fast or with bag) and this could be
interpreted as some of the downstairs samples actually
containing normal and fast walk types. For example,
once a subject reaches the bottom of the stairs, the
individual walks a few more steps to complete the
activity, which might become a noisy/outlier sample
in the downstairs activity dataset.
5 DISCUSSION
One of the most interesting findings of this study is
that all the top 10 ranked features, as illustrated in
Figure 5, are based on only the y-axis of the gyroscope
and accelerometer sensors. This could be interpreted
as being due to the location of the device, as it was
Figure 10: Normalised confusion matrix (%) of the soft
voting model.
placed on the side of the person’s waist, which makes
the y-axis the axis most sensitive to human walk-
based activity motions. It would be interesting to
assess the effects of different device locations during
sensing using the same experimental setup proposed
in this study. Although the developed approach
reached a high level of accuracy in identifying human
physical activity based on raw smartphone motion
sensor signals, other aspects could be examined and
investigated in future research to generate more
findings, including the following:
The evaluation of this study was conducted offline
using a desktop computer. It has not been
thoroughly tested in a live environment
(smartphone) to measure other operational
metrics, such as computational overheads,
memory consumption and the time required for the
whole pipeline to be completed, starting from
acquiring motion signals, to feature extraction,
segmentation, pre-processing, and finally
inferencing, where the examined data are
classified into the right activity type.
The collected dataset was acquired using a single
type of mobile device (Samsung Galaxy S6).
Investigating other widely used devices, such as an
Apple iPhone, could reveal how similar/different
the generated motion signals might be for different
devices and to what extent feature space
distribution varies.
Future work could also investigate other factors,
such as identifying the minimum number of
seconds and samples required per individual in
order to train a user-dependent predictable model
Physical Activity Recognition by Utilising Smartphone Sensor Signals
349

successfully in order that it can accurately match a
given signal with the corresponding physical
activity. This study constructed a general
predictable model that takes advantage of the
signals generated by the whole dataset population
(60 participants).
6 CONCLUSIONS
The findings of this study provide evidence that it is
possible to identify an individual’s physical activity
with a high degree of accuracy, reaching nearly 98%,
based on smartphone-embedded gyroscope and
accelerometer sensor signals gathered over two days.
This was achieved by leveraging the capabilities of
machine learning algorithms in two stages: feature
ranking, in which the feature space is ranked based on
the multiclass classification approach, followed by
activity identification, in which only top-ranked
features are included within the classification phase.
The soft majority voting approach provides the
highest accuracy in comparison with other models,
such as single classifier or hard majority voting.
REFERENCES
Al-Naffakh, N. et al. (2016) ‘Activity Recognition using
wearable computing’, in 2016 11th International
Conference for Internet Technology and Secured
Transactions (ICITST). IEEE, pp. 189–195. doi:
10.1109/ICITST.2016.7856695.
Altun, K., Barshan, B. and Tunçel, O. (2010) ‘Comparative
study on classifying human activities with miniature
inertial and magnetic sensors’, Pattern Recognition,
43(10), pp. 3605–3620. doi: 10.1016/j.patcog.2010.
04.019.
Anguita, D. et al. (2012) ‘Human Activity Recognition on
Smartphones Using a Multiclass Hardware-Friendly
Support Vector Machine’, in Lecture Notes in Computer
Science (including subseries Lecture Notes in Artificial
Intelligence and Lecture Notes in Bioinformatics), pp.
216–223. doi: 10.1007/978-3-642-35395-6_30.
Antos, S. A., Albert, M. V. and Kording, K. P. (2014) ‘Hand,
belt, pocket or bag: Practical activity tracking with
mobile phones’, Journal of Neuroscience Methods, 231,
pp. 22–30. doi: 10.1016/j.jneumeth.2013.09.015.
Bahle, G. et al. (2014) ‘Recognizing Hospital Care
Activities with a Coat Pocket Worn Smartphone’, in
Proceedings of the 6th International Conference on
Mobile Computing, Applications and Services. ICST.
doi: 10.4108/icst.mobicase.2014.257777.
Bayat, A., Pomplun, M. and Tran, D. A. (2014) ‘A study on
human activity recognition using accelerometer data
from smartphones’, Procedia Computer Science.
Elsevier Masson SAS, 34(C), pp. 450–457. doi:
10.1016/j.procs.2014.07.009.
Bhanu Jyothi, K. and Hima Bindu, K. (2018) ‘A Case Study
in R to Recognize Human Activity Using Smartphones’,
in, pp. 191–200. doi: 10.1007/978-981-10-6319-0_17.
Bieber, G. et al. (2011) ‘The hearing trousers pocket’, in
Proceedings of the 4th International Conference on
PErvasive Technologies Related to Assistive
Environments - PETRA ’11. New York, New York,
USA: ACM Press, p. 1. doi: 10.1145/2141622.2141674.
Bro, R. and Smilde, A. K. (2014) ‘Principal component
analysis’, Analytical Methods, 6(9), pp. 2812–2831. doi:
10.1039/c3ay41907j.
Capela, N. A. et al. (2016) ‘Evaluation of a smartphone
human activity recognition application with able-bodied
and stroke participants’, Journal of NeuroEngineering
and Rehabilitation, 13(1), p. 5. doi: 10.1186/s12984-
016-0114-0.
Derawi, M. and Bours, P. (2013) ‘Gait and activity
recognition using commercial phones’, Computers &
Security, 39, pp. 137–144. doi: 10.1016/j.cose.2013.07.
004.
F, A. (no date) AndroSensor. Available at: https://
play.google.com/store/apps/details?id=com.fivasim.an
drosensor&hl=en_GB (Accessed: 14 August 2018).
Ganti, R. K., Srinivasan, S. and Gacic, A. (2010)
‘Multisensor Fusion in Smartphones for Lifestyle
Monitoring’, in 2010 International Conference on Body
Sensor Networks. IEEE, pp. 36–43. doi: 10.1109/
BSN.2010.10.
Goodall, C. and Jolliffe, I. T. (2002) Principal Component
Analysis. John Wiley & Sons, Ltd. Available at:
http://onlinelibrary.wiley.com/doi/10.1002/047001319
2.bsa501/full.
Ha, S. and Choi, S. (2016) ‘Convolutional neural networks
for human activity recognition using multiple
accelerometer and gyroscope sensors’, in 2016
International Joint Conference on Neural Networks
(IJCNN). IEEE, pp. 381–388. doi: 10.1109/
IJCNN.2016.7727224.
Hamm, J. et al. (2013) ‘Automatic Annotation of Daily
Activity from Smartphone-Based Multisensory
Streams’, in, pp. 328–342. doi: 10.1007/978-3-642-
36632-1_19.
He, Y. and Li, Y. (2013) ‘Physical Activity Recognition
Utilizing the Built-In Kinematic Sensors of a
Smartphone’, International Journal of Distributed
Sensor Networks, 9(4), p. 481580. doi: 10.1155/
2013/481580.
Heng, X., Wang, Z. and Wang, J. (2016) ‘Human activity
recognition based on transformed accelerometer data
from a mobile phone’, International Journal of
Communication Systems, 29(13), pp. 1981–1991. doi:
10.1002/dac.2888.
Jiang, W. and Yin, Z. (2015) ‘Human Activity Recognition
Using Wearable Sensors by Deep Convolutional Neural
Networks’, in Proceedings of the 23rd ACM
international conference on Multimedia - MM ’15. New
York, New York, USA: ACM Press, pp. 1307–1310.
doi: 10.1145/2733373.2806333.
ICPRAM 2019 - 8th International Conference on Pattern Recognition Applications and Methods
350

Kwapisz, J. R., Weiss, G. M. and Moore, S. a (2010) ‘Cell
Phone-Based Biometric Identification’, Biometrics:
Theory Applications and Systems (BTAS), 2010 Fourth
IEEE International Conference on, pp. 1–7.
Kwon, Y., Kang, K. and Bae, C. (2014) ‘Unsupervised
learning for human activity recognition using
smartphone sensors’, Expert Systems with Applications,
41(14), pp. 6067–6074. doi: 10.1016/j.
eswa.2014.04.037.
Lara, O. D. and Labrador, M. A. (2013) ‘A Survey on
Human Activity Recognition using Wearable Sensors’,
IEEE Communications Surveys & Tutorials, 15(3), pp.
1192–1209. doi: 10.1109/SURV.2012.110112.00192.
Mitchell, E., Monaghan, D. and O’Connor, N. (2013)
‘Classification of Sporting Activities Using Smartphone
Accelerometers’, Sensors, 13(4), pp. 5317–5337. doi:
10.3390/s130405317.
Nakano, K. (2017) ‘Effect of Dynamic Feature for Human
Activity Recognition using Smartphone Sensors’,
(iCAST), pp. 539–543.
Ogbuabor, G. and La, R. (2018) ‘Human Activity
Recognition for Healthcare using Smartphones’, in
Proceedings of the 2018 10th International Conference
on Machine Learning and Computing - ICMLC 2018.
New York, New York, USA: ACM Press, pp. 41–46.
doi: 10.1145/3195106.3195157.
Palczewska, A. et al. (2014) ‘Interpreting Random Forest
Classification Models Using a Feature Contribution
Method’, in, pp. 193–218. doi: 10.1007/978-3-319-
04717-1_9.
Reyes-Ortiz, J.-L. et al. (2014) ‘Human Activity
Recognition on Smartphones with Awareness of Basic
Activities and Postural Transitions’, in Lecture Notes in
Computer Science (including subseries Lecture Notes in
Artificial Intelligence and Lecture Notes in
Bioinformatics), pp. 177–184. doi: 10.1007/978-3-319-
11179-7_23.
Ronao, C. A. and Cho, S. B. (2016) ‘Human activity
recognition with smartphone sensors using deep
learning neural networks’, Expert Systems with
Applications. Elsevier Ltd, 59, pp. 235–244. doi:
10.1016/j.eswa.2016.04.032.
Saha, J. et al. (2018) ‘An Ensemble of Condition Based
Classifiers for Device Independent Detailed Human
Activity Recognition Using Smartphones †’,
Information, 9(4), p. 94. doi: 10.3390/info9040094.
San-Segundo, R. et al. (2018) ‘Robust Human Activity
Recognition using smartwatches and smartphones’,
Engineering Applications of Artificial Intelligence, 72,
pp. 190–202. doi: 10.1016/j.engappai.2018.04.002.
Shoaib, M. et al. (2016) ‘Complex Human Activity
Recognition Using Smartphone and Wrist-Worn Motion
Sensors’, Sensors, 16(4), p. 426. doi:
10.3390/s16040426.
Strobl, C. et al. (2008) ‘Conditional Variable Importance for
Random Forests’, BMC Bioinformatics, 9(1), p. 307.
doi: 10.1186/1471-2105-9-307.
Weld, D. S. and Bansal, G. (2018) ‘The Challenge of Crafting
Intelligible Intelligence’. Available at: http://arxiv.org
/abs/1603.08507.
Physical Activity Recognition by Utilising Smartphone Sensor Signals
351
