
Subjective Annotations for Vision-based Attention Level Estimation
Andrea Coifman
1
, P
´
eter Rohoska
1,3
, Miklas S. Kristoffersen
1,2
,
Sven E. Shepstone
2
and Zheng-Hua Tan
1
1
Department of Electronic Systems, Aalborg University, Denmark
2
Bang & Olufsen A/S, Struer, Denmark
3
Continental Automotive, Budapest, Hungary
∗
Keywords:
Attention Level Estimation, Natural HCI, Human Behavior Analysis, Subjective Annotations.
Abstract:
Attention level estimation systems have a high potential in many use cases, such as human-robot interaction,
driver modeling and smart home systems, since being able to measure a person’s attention level opens the
possibility to natural interaction between humans and computers. The topic of estimating a human’s visual
focus of attention has been actively addressed recently in the field of HCI. However, most of these previous
works do not consider attention as a subjective, cognitive attentive state. New research within the field also
faces the problem of the lack of annotated datasets regarding attention level in a certain context. The novelty
of our work is two-fold: First, we introduce a new annotation framework that tackles the subjective nature
of attention level and use it to annotate more than 100,000 images with three attention levels and second,
we introduce a novel method to estimate attention levels, relying purely on extracted geometric features from
RGB and depth images, and evaluate it with a deep learning fusion framework. The system achieves an overall
accuracy of 80.02%. Our framework and attention level annotations are made publicly available.
1 INTRODUCTION
Natural interaction has become an essential element
in Human-Computer Interaction (HCI) over the past
years. In the context of smart homes, the integra-
tion of intelligent systems into the home environment
has improved the natural and effective communica-
tion between humans and home appliances. Howe-
ver, providing a natural interaction between smart de-
vices and humans without the use of a physical de-
vice, e.g. a remote control, is still a challenging task.
Vision-based systems are able to provide a more effi-
cient and natural way of communication. As the years
pass, these systems are starting to be more frequently
applied into our daily living and homes. Although
interaction between humans and computers is already
well established in our homes, ways to make these sy-
stems more intelligent still draw much research inte-
rest. One common improvements is the integration of
an intelligent system to give recommendations to the
users (Gomez-Uribe and Hunt, 2016; Nararajasivan
and Govindarajan, 2016) based on learned interests.
Most studies are based on integrating context-aware
devices to track human behavior and routines (Tam-
∗
The presented work was done in affiliation with
1
but
the affiliation of the author changed to
3
during the submis-
sion.
dee and Prasad, 2018). In this paper, we propose to
use attention levels as an effective means to improve
natural HCI in the home by measuring and classifying
the attention level of a user. Attention can be defined
as the focus of cognitive resources on a task, ignoring
sources of distraction (Zaletelj and Ko
ˇ
sir, 2017). In
other words, attention is related to whether a user is
focused or not on the task at hand, e.g. the interaction
with a device.
Quantitative techniques for measuring attention
levels rely on the use of different sensors depending
on the type of measurement: direct or indirect (Man-
cas and Ferrera, 2016). Direct measurements include
brain responses e.g. by using EEG (Murthy G.N. and
Khan, 2014) techniques, among others. However, ex-
tracting data from these sensors is expensive, intru-
sive, and uncomfortable for a natural communication.
To address this problem, indirect measurement of at-
tention levels has been studied through non-intrusive
observation of users’ behaviors, e.g. by using eye-
trackers or head pose estimators (Asteriadis et al.,
2011; Mass
´
e et al., 2017). Indirect measurements do
not require the use of a physical sensor attached to
the user, which makes the interaction with the system
more natural. Most works on estimating attention le-
vels through indirect measurements rely on the gaze
direction of a user. This is due to the fact that the
Coifman, A., Rohoska, P., Kristoffersen, M., Shepstone, S. and Tan, Z.
Subjective Annotations for Vision-based Attention Level Estimation.
DOI: 10.5220/0007311402490256
In Proceedings of the 14th International Joint Conference on Computer Vision, Imaging and Computer Graphics Theory and Applications (VISIGRAPP 2019), pages 249-256
ISBN: 978-989-758-354-4
Copyright
c
2019 by SCITEPRESS – Science and Technology Publications, Lda. All rights reserved
249

eye gaze is highly correlated with what a user is inte-
rested in (Zaletelj and Ko
ˇ
sir, 2017). Existing datasets
that provide annotations rely on objective frameworks
e.g. calculating the direction of gaze or movements
of eyes among other techniques (Kar and Corcoran,
2017).
This paper contributes to the field of HCI by provi-
ding subjective attention level annotations to an exis-
ting publicly available dataset, Pandora (Borghi et al.,
2017), that contains visual recordings of users. A sub-
jective label of attention level refers to the fact that
each of the labelers bases their labeling decision on
how they perceive each user’s attention level in the
recordings, by taking the established definition of at-
tention level into account. Based on the annotations,
we further present a novel method that is able to mea-
sure attention level automatically. Our framework and
attention level annotations are made publicly availa-
ble
1
. The remainder of this paper is organized as fol-
lows: Section 2 reviews previous state-of-the-art met-
hods for estimating attention alongside existing da-
tasets; Section 3 explains the process of annotating
the dataset; Section 4 presents a baseline for estima-
ting attention with subjective attention annotations; in
Section 5 we present our experiments and quantitative
results for the previously built baseline.
2 RELATED WORKS AND
MOTIVATIONS
2.1 Vison-based Attention Estimation
First works on addressing attention estimation pro-
blems were based on predicting head pose or direction
of eye gaze, which are considered to be high level des-
criptors of attention. This is due to the fact that, nor-
mally, the position of the head and the gaze direction
are highly correlated with the subject of the user’s
interest or, more applied to this paper, what caught
the user’s attention (Jariwala et al., 2016; Zaletelj and
Ko
ˇ
sir, 2017). Majority of studies focused on determi-
ning the Visual Focus of Attention (VFOA) for users’
attention estimation. The VFOA denotes the target of
what a user is looking at and it is mostly determined
by the combination of a user’s eye gaze and head pose
dynamics (Mass
´
e et al., 2017). The VFOA characte-
rizes a perceiver and target pair. It may be defined
either by the line from the perceivers face to the per-
ceived target, or by the perceivers direction of sight
or gaze direction. However, estimating the attention
1
http://kom.aau.dk/∼zt/online/SubjectiveAnnotations/
level of a user based only on eye gaze can be proble-
matic in the home context, due to the lack of detection
range and the sensor’s low resolution.
In this work, we formulate the attention level es-
timation as a classification problem to be solved in
a supervised learning framework, since we have sub-
jective annotations of attention levels on a dataset. To
this end, we propose a set of geometric features as
an effective representation of high-level features that
will serve as descriptors of the attention level of a
user. The set of representative features consist of face,
head, and body points, distances, and angles that des-
cribe the eye gaze direction together with head and
body orientation of the user. There are a number of
advantages of using the proposed features in a su-
pervised framework. First, it includes more than eye
gaze and pose information and thus is more descrip-
tive. Second, it avoids deploying separate eye gaze
and pose estimation systems and thus potentially re-
duces the complexity of the system. Finally, the sy-
stem works even when eyes are not visible as multiple
features are involved in the estimation of attention le-
vels.
Many prior works in the field of HCI aim to use
lower-level geometric features (e.g. locations, distan-
ces or angles between locations) to predict and clas-
sify higher-level features (e.g. direction of eye-gaze,
body pose or head pose) for attention level estima-
tion. Chen et al. (Chen et al., 2016) evaluated five
dimensional feature vectors, containing geometric fe-
atures of detected joints to evaluate joint motions for
action recognition. Yun et al. (Yun et al., 2012) eva-
luates two-person interaction based on a wide variety
of geometric body features, such as joint keypoints
and distances, and joint-to-plane distances. Mass
´
e et
al. (Mass
´
e et al., 2017) propose a framework where
correlation between head pose and eye gaze is used
to estimate the VFOA. The authors of some of these
works also address the importance of these features
to estimate attention in the field of HCI. To this ex-
tent, we decide to use geometric features and the cor-
responding relation between these features to evaluate
the level of attention of a user.
2.2 Datasets and Annotation Methods
Different approaches have been proposed for genera-
ting attention estimation datasets and corresponding
annotations. The most common way for researchers
is to record their own datasets and hand label the ima-
ges with information regarding the direction of the
gaze (Tseng and Cheng, 2017) or shifts of attention
between targets over the images in the dataset (Steil
et al., 2018). All of the previously mentioned da-
VISAPP 2019 - 14th International Conference on Computer Vision Theory and Applications
250

tasets and their annotations can be used to estimate
the focus of attention, through the eye gaze and head
pose labels. However, there are no existing informa-
tion on the level of attention, even though, most of
the datasets can be re-labeled with attention level an-
notations. Asteriadis et al. (Asteriadis et al., 2011)
proposed a dataset similar to ours. In their work, the
authors hand-labeled the Boston University (Boston,
2018) dataset using similar approaches regarding at-
tention levels. First, the images were labeled regar-
ding annotator’s perception of attention over the sub-
ject in the image, with two levels - ’0’ and ’1’ re-
garding attentive or non-attentive state. Second, an
average decision rule was applied in order to evaluate
the agreement between annotators. In contrast to the
authors’ work, we hand-label the images with three
levels of attention - ’0’, ’1’, and ’2’ regarding low,
medium, and high attentive state. For evaluating the
level of agreement between annotators, we apply a
”majority” decision rule which selects the final label
as the one that has more than half of the votes from the
labelers. In this way, we ensure a fair decision. Furt-
hermore, we evaluate geometric features to address
the problem of estimating attention level of a user.
3 SUBJECTIVE ANNOTATIONS
In this section, the publicly available dataset and the
approach towards hand-labeling the 130,889 RGB
images with subjective attention annotations are ex-
plained. A decision rule is later applied in order to
evaluate the agreement between the labels from diffe-
rent labelers for each video frame.
3.1 Original Data and Reason of Use
Borghi et al. (Borghi et al., 2017) first introduced the
Pandora dataset in 2016 as a part of research project in
the automotive field for head center localization, head
pose, and shoulder pose estimation. The dataset con-
tains 110 sequences of 22 different subjects perfor-
ming constrained and unconstrained driving-like mo-
vements. The data was collected using a Microsoft
Kinect One device, which acquires the upper-body
part of each of the subjects. The authors stated that, in
this way, the position of the sensor would simulate as
if it was located in the car’s dashboard. In this paper
we follow this idea considering the lack of attention
level datasets in the context of the living room. The
position of the sensor and the captured upper-body si-
mulates very well the idea of capturing attention level
of a user from a smart system, such as smart TVs.
3.2 Annotation Method
In the present paper, a version
2
of the dataset that
contains 261,778 RGB (1920x1080 pixels) and depth
(512x424) images was used. The dataset contains
five different sequences of constrained (three) and un-
constrained (two) actions from 20 different subjects.
Contrary to previous datasets explained in Section 2.2
with annotations based on shifts of attention, we pro-
pose a frame-by-frame approach, in order to better
understand the context and different situations. To
this end, the data was re-structured as unique sequen-
ces for each of the 20 subjects, with jointly constrai-
ned and unconstrained movements, ending up with an
average of 6,544 RGB frame images per subject. The
frames were manually annotated with subjective an-
notations of attention level by five annotators: four
were used for labeling and one for checking. A sub-
jective label of attention level refers to the fact that
each of the labelers based their labeling decision on
their personal feelings and opinion. An objective de-
finition of attention (see Section 1) was provided to
the labelers beforehand, along with the definition of
each attention level:
’0’ Low attention level: The subject was not paying
attention to the task at hand.
’1’ Mid attention level: The subject was partially
paying attention to the task at hand.
’2’ High attention level: The subject was paying full
attention to the task at hand.
3.3 Decision Rule and Agreement
The total number of annotations was 523.556 (four la-
bels per frame). In order to measure the agreement be-
tween the annotators, a decision rule was determined.
In this way, every frame would have a unique label.
The decision rule aim to assign the most fair label to
each of the frames. A first decision rule was applied
over the annotations by selecting the alternative that
had more than half of the votes (majority rule). In this
way, votes were treated equally. Having four anno-
tations per frame, majority was settled when three or
more labels were equal, ending up with an agreement
over all the annotations from the dataset of 79.7%.
In order to increase the percentage of agreement bet-
ween the annotators, a checker labeler was introduced
to annotate the unsolved frames. The annotations pro-
cedure for the checker was the same as for the rest of
the annotators (explained in Section 3.2). After the
2
The authors are still updating the Pandora dataset with
new RGB and depth images. Last noticed version updated
on 29th of May, 2018.
Subjective Annotations for Vision-based Attention Level Estimation
251

checker annotated the frames, a second majority de-
cision rule was applied over each five annotations per
frame. The resolved labels between annotators incre-
ased to 92.6% of the frames. A median filter was ap-
plied to decide the label for the remaining frames.
The distribution of the annotations in the dataset
is as follows: the labels corresponding to low atten-
tion level occupy most of the labeled data with 70.8%
of annotations; mid and high attention level annotati-
ons are more or less equally distributed with a total of
15.5% and 13.7% of annotations over the total labe-
led dataset, respectively. Table 1 shows the number of
frames and the agreement between annotators before
and after integrating the checker, for each subject or
set of images. Fig. 1 shows an example of three dif-
ferent frames extracted from the Pandora dataset with
their corresponding final label of level of attention, af-
ter the agreement between annotators: Fig. 1a shows
a subject manipulating a second screen, representing
subjective low level of attention; Fig. 1b shows a sub-
ject which head position is not aligned with the di-
rection of the gaze, representing the subjective me-
dium attention level (mid); and Fig. 1c shows a sub-
ject looking directly to the sensor, which clearly re-
presents the subjective high attention level.
4 ATTENTION LEVEL
ESTIMATION METHODS
In this section, we first introduce the proposed featu-
res and methods for attention level estimation. First,
we explain the procedure for extracting the keypoints,
we define the geometric features and present our ap-
proach to integrate depth. And second, we explain
three simple machine learning methods and five com-
plex deep learning models.
4.1 Feature Extraction
All keypoint coordinates are extracted using the pu-
blicly available OpenPose API (Hidalgo et al., 2018)
from the RGB images of the annotated dataset. We
use RGB color space since the original OpenPose mo-
del was trained using the same color space. For ad-
dressing the problem of attention estimation, we ex-
tract keypoints representing body and face parts of the
user. Neck and right/left shoulder keypoints are ex-
tracted for describing the upper-body of the subject.
Nose and eye center keypoints for the right and left
eye are extracted for describing the face of the sub-
ject, and six eye contour keypoints for describing the
right/left eyes. In cases when the API outputs multi-
ple people for only one person (e.g. either a false posi-
tive detection or breaking the keypoints of one person
into two), we find the similarity between two keypoint
vectors and merge them if the missing keypoints are
correlated. Since some of the keypoints from vari-
ous frames can still be missing after this operation,
we interpolate between the last detection and the most
recent detection, for each keypoint, to create a conti-
nuous stream of detections.
Before constructing our geometric features des-
cribed below, we recalculate the position of each
keypoint on each frame according to the coordinate
system where the nose keypoint represents the origin.
This way we can transform our features from being
relative to the image coordinate system and instead
construct them localized.
The geometric features were inspired by Zhang et
al. (Zhang et al., 2018) and are constructed based
on the extracted keypoints. They consist of a set of
relations between keypoints. Two types of geometric
features were defined:
1. A set, D, of Euclidean distances between
keypoints.
2. A set, A, of angles between two unit vectors, each
of which represents a line linking two consecutive
keypoints.
The first set of geometric features is described by four
types of distances:
D = {D
F
, D
BF
, D
LE
, D
RE
}, (1)
where D
F
corresponds to the Euclidean distances be-
tween face keypoints and is defined by:
D
F
= {||f
f
f
j
− f
f
f
i
|| | i, j ∈ F, i < j}, (2)
with F being the face keypoints, and f
f
f
i
the coordinate
of the i
th
face keypoint. D
BF
corresponds to the Euc-
lidean distances between face and body keypoints and
is defined by:
D
BF
= {||f
f
f
j
−b
b
b
i
|| | i ∈ B, j ∈ F}, (3)
where B are the body keypoints and b
b
b
i
the coordinate
of the i
th
body keypoint. D
LE
corresponds to the Eu-
clidean distances between left eye center keypoint to
each six contour keypoints of the left eye and they are
defined by:
D
LE
= {||e
e
e
i
−c
c
c
L
|| | i ∈ LE}, (4)
with LE being the contour keypoints of the left eye,
e
e
e
i
the coordinate of the i
th
contour keypoint, and c
c
c
L
the coordinate of the left eye center. Similarly, D
RE
corresponds to the Euclidean distances between right
eye center keypoint to each six contour keypoints of
the right eye.
VISAPP 2019 - 14th International Conference on Computer Vision Theory and Applications
252
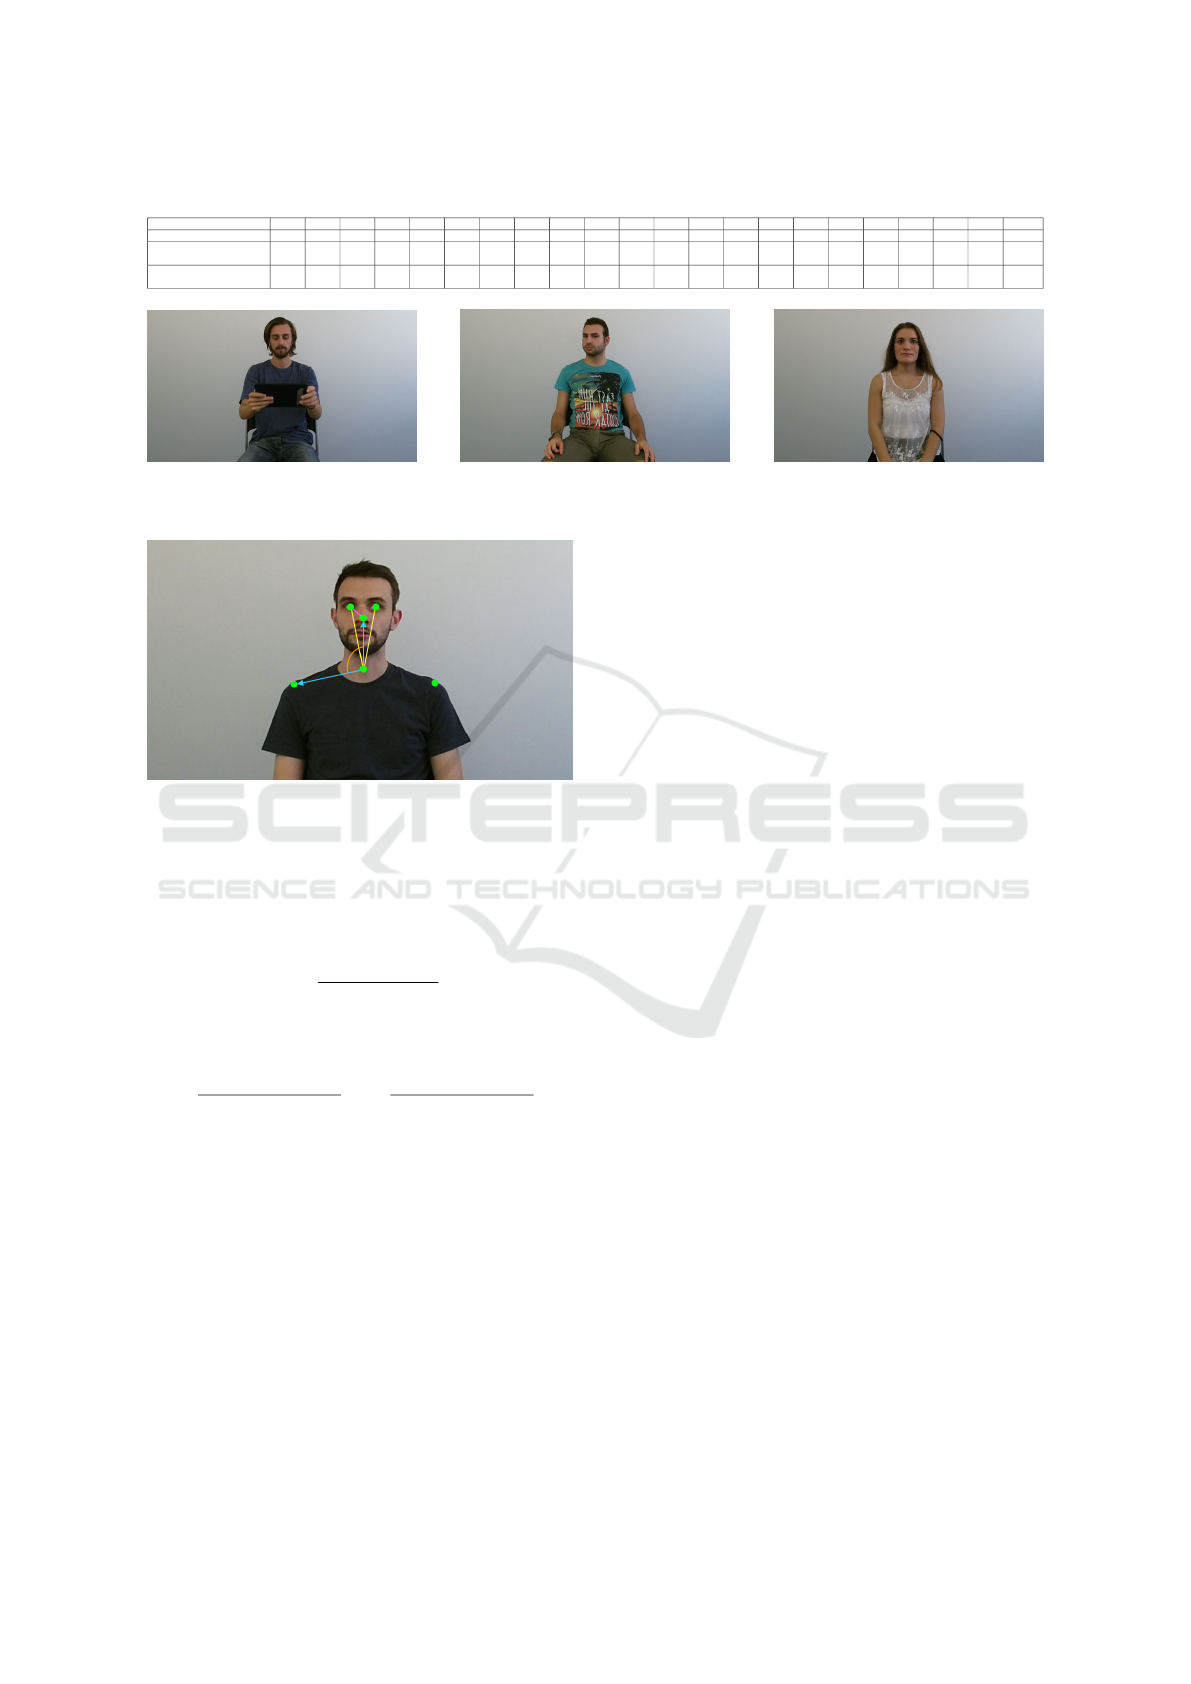
Table 1: Agreement between annotators and checker for the annotated dataset.
Set # 1 2 3 4 5 6 7 8 9 10 11 12 13 14 15 16 17 18 19 20 Mean Std
# Frames 5197 5562 6317 6706 5340 6222 4861 6907 6433 6757 5295 6820 7312 8122 7396 6014 7130 8976 8689 4833 - -
% Majority settled between
annotators
94.15 83.75 78.12 68.92 82.02 65.67 81.98 80.32 92.04 91.86 64.49 76.73 83.52 74.17 82.18 76.02 86.94 65.66 88.20 80.96 79.89 8.8245
% Majority settled
with checker
98.19 94.70 90.87 85.71 94.14 85.26 95.23 94.90 98.91 97.60 82.85 90.62 93.34 93.70 92.39 91.57 96.06 87.32 96.05 92.72 92.61 4.2085
(a) Low (b) Mid (c) High
Figure 1: Example of frames with the corresponding three label of attention level.
Figure 2: Graphical representation of keypoints and geo-
metric features in colors: green for keypoints, pink for D
F
,
yellow for D
BF
, blue for vectors used to compute the angles
(orange). Original image extracted from Pandora dataset
(Borghi et al., 2017).
For the definition of the set, A, we compute three
unit vectors. One between nose and neck:
v
v
v
1
=
f
f
f
nose
−b
b
b
neck
||f
f
f
nose
−b
b
b
neck
||
. (5)
And two between neck and left/right shoulders, re-
spectively:
v
v
v
2
=
b
b
b
Lshoulder
−b
b
b
neck
||b
b
b
Lshoulder
−b
b
b
neck
||
,v
v
v
3
=
b
b
b
Rshoulder
−b
b
b
neck
||b
b
b
Rshoulder
−b
b
b
neck
||
. (6)
We then describe the set as:
A =
arccos
v
v
v
T
1
v
v
v
2
, arccos
v
v
v
T
1
v
v
v
3
, (7)
which are two angles between neck to nose vector and
vectors from neck to left/right shoulders, respectively.
Research within computer vision has shown that,
in many applications, when depth information is in-
cluded along with RGB imagery, the extra modality
can improve the performance of the system (Li and
Jarvis, 2009; Molina et al., 2015). We extract depth
information on a point of interest basis. This process
covers finding positions on the original RGB image,
where depth information is to be extracted using the
already computed keypoints as keys. By taking the
average depth in a 3x3 area around each position,
we alleviate the problem of possible small positional
errors in the extracted keypoints. Note that the ex-
traction of depth pixel intensity information is done
after interpolating the missing keypoint coordinates,
but before recalculating the keypoint coordinates ac-
cording to the Nose keypoint. Once all features are
extracted, we standardize them.
4.2 Attention Level Estimation
In this section, we present several methods for atten-
tion estimation with subjective attention annotations,
which can serve as baselines for further development.
We use our own baseline for attention level estima-
tion, since we find that there are no adequate baselines
at the present and we consider our novel attention le-
vel estimation framework and subjective labeling pro-
cess a pioneer work.
Before training DNN models for attention level
classification, we train and evaluate three classic ma-
chine learning models, to set up a baseline for our
more complex models performance. We train Support
Vector Machine (SVM), Logistic Regression (Logit)
and a single hidden layer Multilayer Percepton (MLP)
for multiclass classification.
4.2.1 Deep Neural Network (DNN) Models
Using all of our feature space as a whole, as the in-
put to our DNN models (“early” fusion, see Fig. 3a),
might not always yield the best possible result. Ot-
her studies made their efforts on fusing multiple
keypoints and geometric features (Zhang et al., 2018),
and argue that fusing these features together at a later
stage of the network - either by training a fully con-
nected layer on top of different dense layer streams
(“fully-connected” fusion, see Fig. 3b) or combining
the softmax decisions (“late” fusion, see Fig. 3c) - can
further increase the overall classification accuracy. To
Subjective Annotations for Vision-based Attention Level Estimation
253
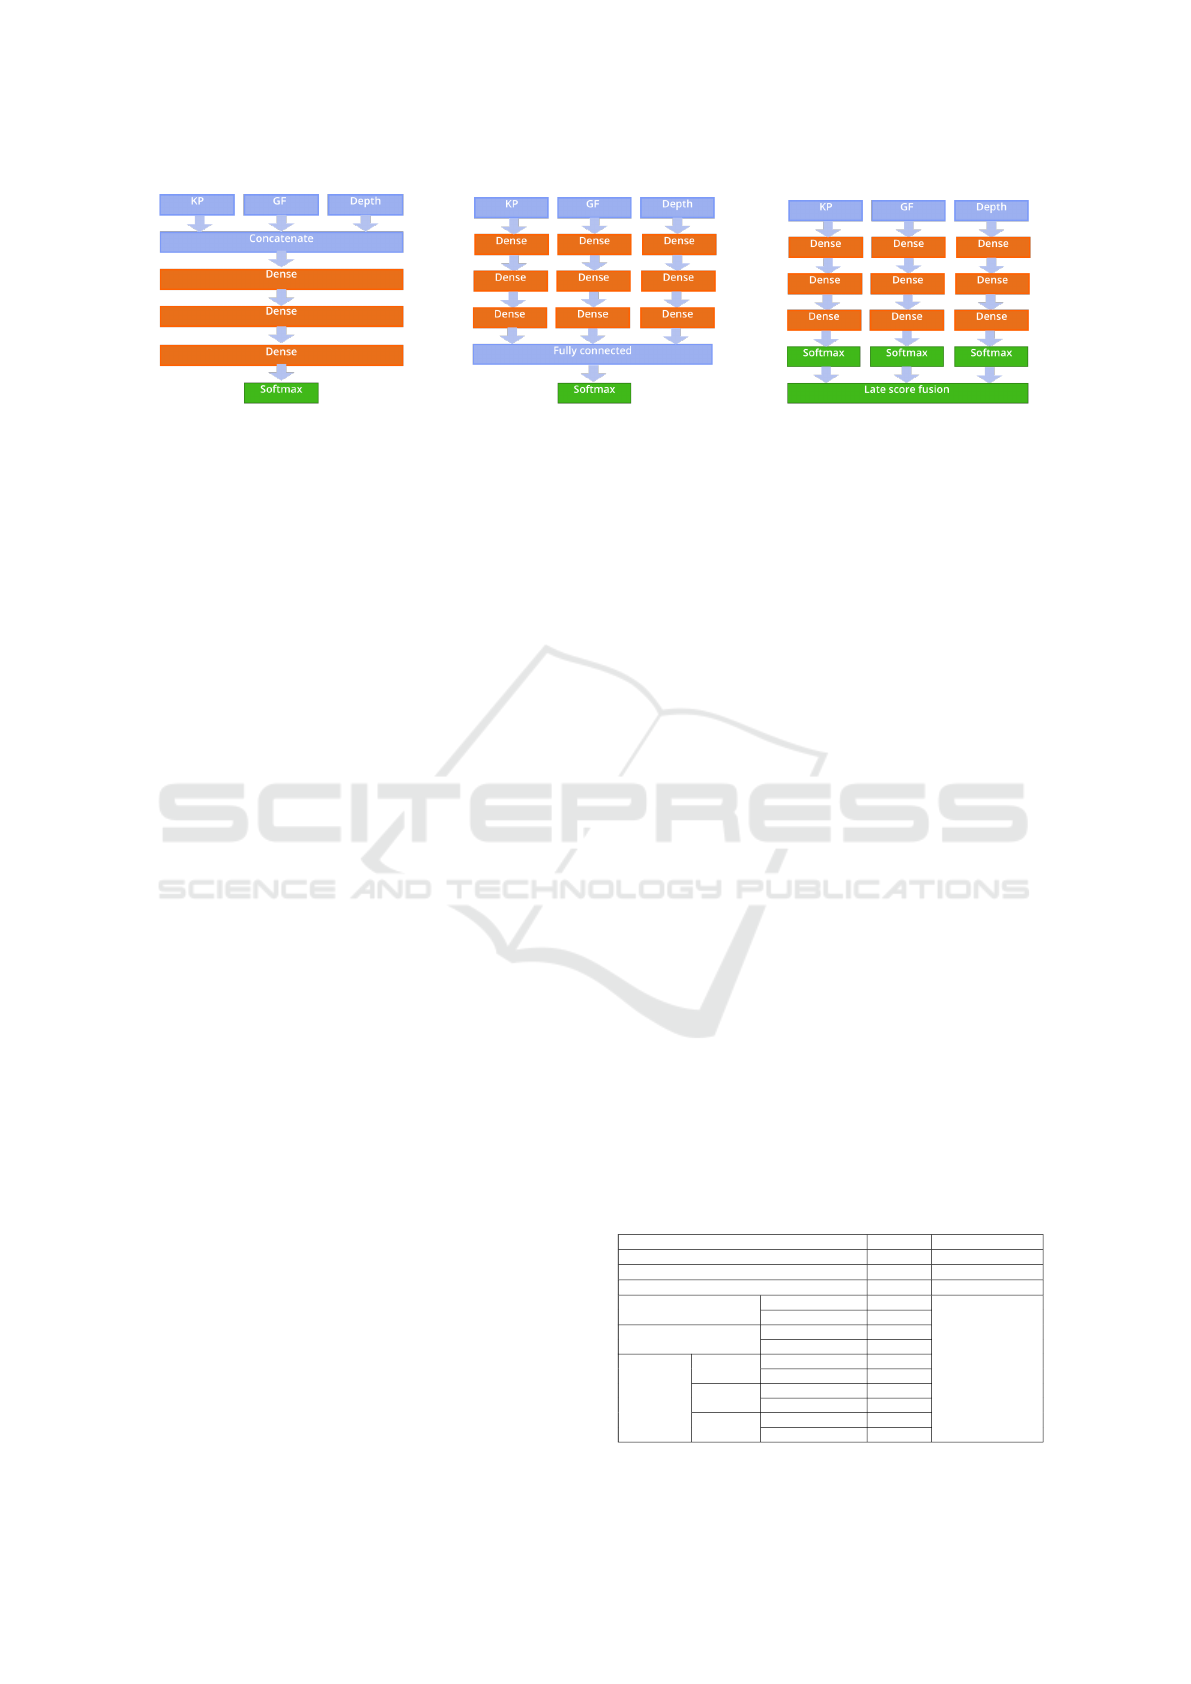
(a) Early (b) Fully-connected (c) Late
Figure 3: DNN models and methods for fusing keypoints (KP), geometric features (GF) and depth.
further evaluate our extracted features, we decided to
follow the three feature fusion frameworks, explai-
ned below. Note that in all models where we apply
fully-connected or late fusion, we handle keypoints,
geometric features and/or depth in streams of separate
dense layers. Further on, in this paper, these streams
are noted as feature streams.
Early Fusion: the keypoints and geometric features
(when having two modalities) and depth (three moda-
lities) are concatenated and given as input to the DNN
models during training and inference.
Fully-connected Feature Fusion: the degree of how
much each feature subset contributes to the classifi-
cation task at hand is learned through different infor-
mation streams based on the input. This is possible
to be learned through trainable weights of a DNN.
Each stream represents layers of densely connected
neurons that are kept separately for each stream and
are only connected to a fully connected layer at a la-
ter stage, before classification. This way the different
layers of each stream can learn unbiased information
by the other stream, but share information through the
neurons of the fully connected layer, before classifica-
tion.
Late Fusion: this approach integrates common mea-
ning representations derived from different modalities
into a combined final interpretation, by utilizing sepa-
rate classifiers that can be trained independently. The
final decision is reached by combining the partial out-
puts of the unimodal classifiers, by either taking the
maximum (maximum fusion) or the average scores of
all feature stream specific softmax layers (average fu-
sion) train a set of learnable weights on top of each
softmax layer and attaching a new softmax layer on
top of these weights, to reach the final classification
scores (Kuang et al., 2016).
Each of the dense layers have 256 and fully con-
nected layers have 64 hidden units, with ReLU acti-
vations. The learning rate was initially set to 0.0001
for the Adam optimizer. In case of fully-connected
fusion and weighted score fusion, we train the diffe-
rent feature streams separately. When we train the
fully connected fusion models, the softmax layers of
each stream are detached and connected to a fully
connected layer which is further connected to its own
softmax layer. We freeze the weights of each feature
stream and only update the weights of the new lay-
ers during backpropagation. With this procedure, we
can deny the bias in each stream caused by the paral-
lel ones. We train our late fusion models in the same
fashion, except we keep the softmax layers, and at-
tach a new custom layer that operated on the decision
of each stream.
5 EXPERIMENTAL RESULTS
AND DISCUSSION
Four-fold cross-validation were used for evaluating
the presented algorithms. The final accuracy is obtai-
ned as the average of all the accuracies of all four
models from each algorithm. Table 2 shows the per-
formance of the classic machine learning algorithms
over the dataset alongside the performance of the dif-
ferent DNN models for each modality in terms of
accuracy.
From our experiments, we find that including
depth information among the input features is mostly
beneficial. Table 2 shows that both the early and fully-
connected fusion of keypoints, geometric features and
Table 2: Performance of the classic algorithms and DNN
models with two (KP and GF) and three (KP, GF and depth)
modalities.
Model Accuracy Standard deviation
SVM 0.6121 0.0043
Logit 0.5887 0.0030
MLP 0.6314 0.0155
Early fusion
KP + GF 0.7293
(0.0020-0.0040)
KP + GF + Depth 0.7547
Fully-connected fusion
KP + GF 0.7781
KP + GF + Depth 0.8002
Late fusion
Average
KP + GP 0.7196
KP + GF + Depth 0.7169
Maximum
KP + GF 0.7161
KP + GF + Depth 0.7075
Weighted
KP + GF 0.7236
KP + GF + Depth 0.7234
VISAPP 2019 - 14th International Conference on Computer Vision Theory and Applications
254
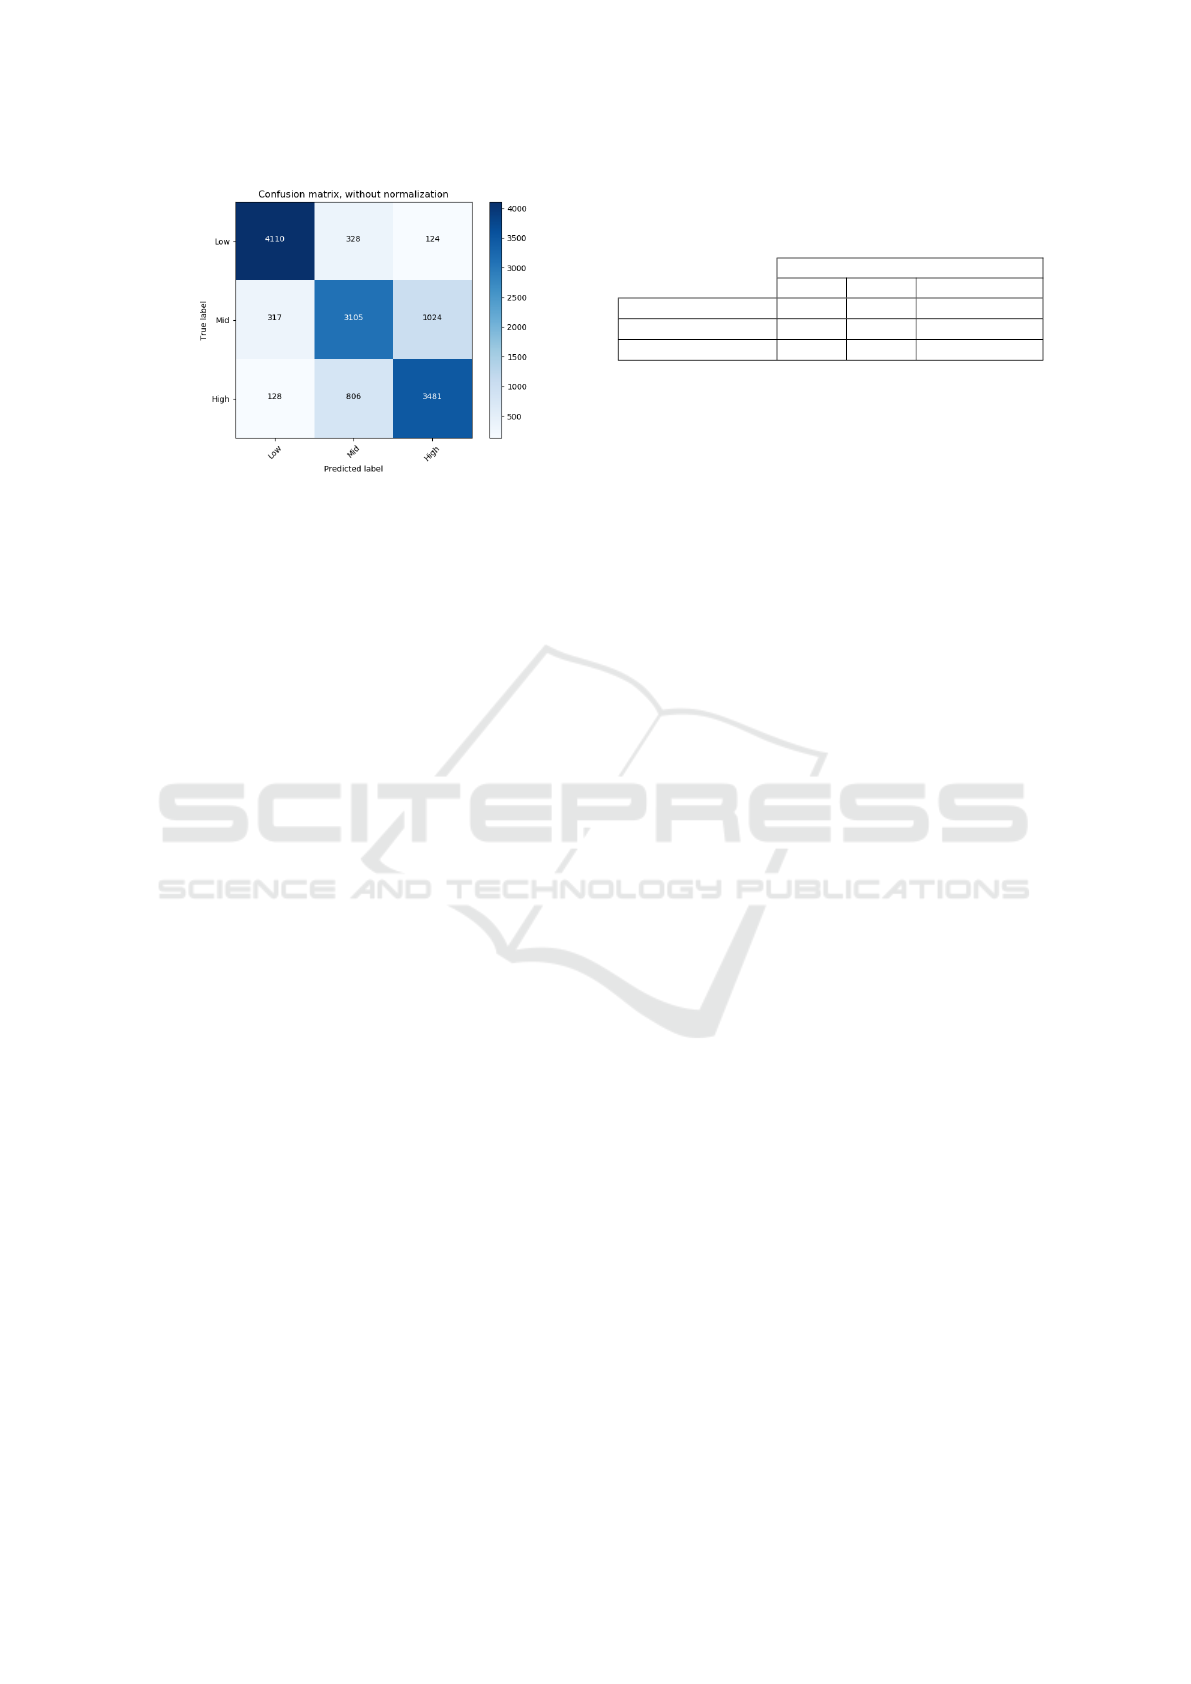
Figure 4: Confusion matrix of the results of the fully-
connected fusion of keypoints, geometric features and
depth. Darker colors correspond to a larger number of clas-
sifications.
depth outperforms the fusion of keypoints and geo-
metric features. The three different versions of late
fusion models did only make a marginal difference
between the same results. From the results of our
best performing model (fully-connected fusion with
three modalities, see Table 2) we find that most false
negative and false positive classifications are perfor-
med regarding “mid” attention level. Fig. 4 shows
that more than 60% of the false classifications hap-
pen along the “mid” label. This result can be best ex-
plained by the nature of the annotations. Although in
most cases “low” and “high” attention level was cle-
arly decided by the majority votes of the annotators,
“mid” attention level was mostly decided by the final
agreement rule or the checker’s annotations. This me-
ant that most images which caused confusion or a dif-
ficult decision for the annotators fell under the “mid”
attention label, resulting in the most difficult and ver-
satile class of all three. It is also important to note that
when one of the DNN models outperformed a previ-
ous one, the performance change was best visible on
the misclassification rate of the “mid” class.
The results in Table 3 show how accurately indi-
vidual streams estimate single attention level classes
(accuracy per individual class label). It is clearly visi-
ble that keypoints perform the estimation of low and
mid attention level the most accurate, however geo-
metric features are the best at estimating high atten-
tion level. Although depth is a overall low accuracy
descriptor of attention, the results from Table 2 jus-
tify the inclusion of depth information. These results
show fusion (on any level) of different modalities can
help to increase the model’s overall performance for
the task at hand. Table 2 shows that late fusion’s per-
formance was always inferior compared to the other
two versions of fusion. This is best explained by late
fusion only being a powerful tool when it is introdu-
Table 3: Results of how accurately individual streams esti-
mate single attention level classes (accuracy per individual
class label).
Accuracy per individual class label
Low Mid High
Keypoints 0.8938 0.7470 0.7807
Geometric Features 0.8909 0.7434 0.7886
Depth 0.7764 0.6704 0.6745
ced to modalities that are represented differently in
the input data. This difference can refer to difference
in temporal aspects or representation (e.g images and
numeric data or sound). Neither of the feature sub-
sets and modalities that were fused together differ on
a temporal aspect and the way these features or moda-
lities are represented in the feature space, which ex-
plains the inferior performance of all late fusion mo-
dels. To validate these results, we introduced a new
fusion model, where the geometric features were fu-
sed together in a fully-connected model, and fused to-
gether with the depth features in a weighted late fu-
sion model. The results of the new fusion can not
over perform the results of the best fully connected
fusion model either. The better performance of the
fully connected fusion model can be best explained
by the nature of the method. Since all streams are
kept separated for the early stages of the network, the
learned weights inside the stream specific layers are
less correlated to each of the fusion streams. Howe-
ver, the classification error is propagated back to each
of these layers, during global optimization. There-
fore, the model can still adjust its learned parameters
according to the other separated streams. This way,
the learned information is only limited throughout the
early stages of training.
6 CONCLUSION
Estimating attention level of a user is a very chal-
lenging task. The majority of methods rely on des-
cribing attention by measuring the VFOA of a user
with combination of head pose estimation. The de-
velopment of datasets in the field have been at the
focus point in research over the past years. Howe-
ver, existing datasets either do not include annotati-
ons or rely on objective annotations depending on the
direction of the eye gaze and head pose of a user. In
this paper, we proposed a novel approach towards es-
timating attention level of a user with subjective an-
notation levels by evaluating geometric features. We
hand-labeled over 100,000 images of the Pandora da-
taset with three levels of subjective annotations, using
five participants. The objective of the labeling process
was to label attention level of data based solely on per-
Subjective Annotations for Vision-based Attention Level Estimation
255

sonal feelings and opinion, which we believe is bene-
ficial for tasks such as estimating the attention level of
a user, to incorporate the subjective nature of attention
itself. We further set up baseline results of attention
level estimation, using our annotations and different
deep learning fusion models. Our best achieved accu-
racy was 80.02% on attention level estimation. As a
future work, we consider labeling the dataset for other
applications in the field related to attention, such as
the VFOA (looking at the TV or not) of each person,
frame-by-frame. Shift of attention labels can also be
added based on either a new labeling session or either
by using the information available in the current at-
tention level labels, e.g annotating the frames where
the attention shifts from low to mid, mid to high and
high to low.
REFERENCES
Asteriadis, S., Karpouzis, K., and Kollias, S. (2011). The
Importance of Eye Gaze and Head Pose to Estimating
Levels of Attention. 2011 Third International Confe-
rence on Games and Virtual Worlds for Serious Appli-
cations.
Borghi, G., Venturelli, M., Vezzani, R., and Cucchiara, R.
(2017). POSEidon: Face-from-Depth for Driver Pose
Estimation. IEEE Conference on Computer Vision and
Pattern Recognition.
Boston, U. (2018). Boston university common data set
2017-2018.
Chen, H., Wang, G., Xue, J.-H., and He, L. (2016). A novel
hierarchical framework for human action recognition.
Pattern Recognition, 55:148–159.
Gomez-Uribe, C. A. and Hunt, N. (2016). The Netflix Re-
commender System: Algorithms, Business Value, and
Innovation. ACM Transactions on Management Infor-
mation Systems, 6(4):Article No. 13.
Hidalgo, G., Cao, Z., Simon, T., Wei, S.-E., and Joo, H.
(2018). OpenPose: Real-time multi-person keypoint
detection library for body, face, and hands estimation.
original-date: 2017-04-24T14:06:31Z.
Jariwala, K., Dalal, U., and Vincent, A. (2016). A robust eye
gaze estimation using geometric eye features. Third
International Conference on Digital Information Pro-
cessing, Data Mining, and Wireless Communications.
Kar, A. and Corcoran, P. (2017). A Review and Analy-
sis of Eye-Gaze Estimation Systems, Algorithms and
Performance Evaluation Methods in Consumer Plat-
forms. IEEE Access, 5:16495–16519.
Kuang, H., Chan, L. L. H., Liu, C., and Yan, H. (2016).
Fruit classification based on weighted score-level fea-
ture fusion. Journal of Electronic Imaging, 25(1).
Li, Z. and Jarvis, R. (2009). Real time Hand Gesture Re-
cognition using a Range Camera. Australasian Con-
ference on Robotics and Automation (ACRA).
Mancas, M. and Ferrera, V. (2016). How to Measure At-
tention? Mancas M., Ferrera V., Riche N., Taylor J.
(eds) From Human Attention to Computational Atten-
tion, 10.
Mass
´
e, B., Ba, S., and Horaud, R. (2017). Tracking Gaze
and Visual Focus of Attention of People Involved in
Social Interaction. Computing Research Repository,
Computer Science(Computer Vision and Pattern Re-
cognition).
Molina, J., Pajuelo, J. A., and Mart
´
ınez, J. M. (2015). Real-
time Motion-based Hand Gestures Recognition from
Time-of-Flight Video. Springer Science+Business
Media New York 2015.
Murthy G.N., K. and Khan, Z. A. (2014). Cognitive at-
tention behaviour detection systems using Electroen-
cephalograph (EEG) signals. Research Journal of
Pharmacy and Technology, 7(2):238–247.
Nararajasivan, D. and Govindarajan, M. (2016). Location
Based Context Aware user Interface Recommendation
System. Proceedings of the International Conference
on Informatics and Analytics, page Article No. 78.
Steil, J., M
¨
uller, P., Sugano, Y., and Bulling, A. (2018).
Forecasting user attention during everyday mobile in-
teractions using device-integrated and wearable sen-
sors. Proceedings of the 20th International Confe-
rence on Human-Computer Interaction with Mobile
Devices and Services.
Tamdee, P. and Prasad, R. (2018). Context-Aware Com-
munication and Computing: Applications for Smart
Environment. Springer Series in Wireless Technology.
Tseng, C.-H. and Cheng, Y.-H. (2017). A camera-based
attention level assessment tool designed for classroom
usage. The Journal of Supercomputing, pages 1–14.
Yun, K., Honorio, J., Chattopadhyay, D., Berg, T. L., and
Samaras, D. (2012). Two-person interaction detection
using body-pose features and multiple instance lear-
ning. IEEE Computer Society Conference on Compu-
ter Vision and Pattern Recognition Workshops.
Zaletelj, J. and Ko
ˇ
sir, A. (2017). Predicting students’ at-
tention in the classroom from Kinect facial and body
features. EURASIP Journal on Image and Video Pro-
cessing, 2017(80).
Zhang, S., Yang, Y., Xiao, J., Liu, X., Yang, Y., Xie, D.,
and Zhuang, Y. (2018). Fusing Geometric Features for
Skeleton Based Action Recognition using Multilayer
LSTM Networks. IEEE Transactions on Multimedia,
20(9).
VISAPP 2019 - 14th International Conference on Computer Vision Theory and Applications
256
