
Semantic Segmentation of Non-linear Multimodal Images for Disease
Grading of Inflammatory Bowel Disease: A SegNet-based Application
Pranita Pradhan
1,2
, Tobias Meyer
2
, Michael Vieth
3
, Andreas Stallmach
6
, Maximilian Waldner
4,5
,
Michael Schmitt
1
, Juergen Popp
1,2
and Thomas Bocklitz
1,2
1
Institute of Physical Chemistry and Abbe Center of Photonics, Friedrich-Schiller-University, Jena, Germany
2
Leibniz Institute of Photonic Technology, Member of Leibniz Health Technologies Jena, Germany
3
Institute of Pathology, Klinikum Bayreuth, Bayreuth, Germany
4
Erlangen Graduate School in Advanced Optical Technologies (SAOT),
Friedrich-Alexander University of Erlangen-Nuremberg, Germany
5
Medical Department 1, Friedrich-Alexander University of Erlangen-Nuremberg, Erlangen, Germany
6
Department of Internal Medicine IV (Gastroenterology, Hepatology, and Infectious Diseases), Jena University Hospital,
Jena, Germany
Keywords:
Semantic Segmentation, Non-linear Multimodal Imaging, Inflammatory Bowel Disease.
Abstract:
Non-linear multimodal imaging, the combination of coherent anti-stokes Raman scattering (CARS), two-
photon excited fluorescence (TPEF) and second harmonic generation (SHG), has shown its potential to assist
the diagnosis of different inflammatory bowel diseases (IBDs). This label-free imaging technique can support
the ‘gold-standard’ techniques such as colonoscopy and histopathology to ensure an IBD diagnosis in clinical
environment. Moreover, non-linear multimodal imaging can measure biomolecular changes in different tissue
regions such as crypt and mucosa region, which serve as a predictive marker for IBD severity. To achieve a
real-time assessment of IBD severity, an automatic segmentation of the crypt and mucosa regions is needed. In
this paper, we semantically segment the crypt and mucosa region using a deep neural network. We utilized the
SegNet architecture (Badrinarayanan et al., 2015) and compared its results with a classical machine learning
approach. Our trained SegNet model achieved an overall F1 score of 0.75. This model outperformed the
classical machine learning approach for the segmentation of the crypt and mucosa region in our study.
1 INTRODUCTION
Histopathological examination represents the ‘gold-
standard’ for diagnosing inflammatory bowel disease
(IBD), where the quantification of colonic inflamma-
tion is based on the visual appearance of the tissue.
However, histopathology delays the diagnosis due to
a long sample preparation protocol that includes tak-
ing biopsies, tissue embedding, tissue sectioning and
staining. In this regard, label-free imaging techniques
like multiphoton microscopy (MPM) has been rec-
ognized as an in vivo imaging technique for IBD
diagnostics (Sch
¨
urmann et al., 2013) (Chernavskaia
et al., 2016) (Waldner et al., 2017). These label-
free techniques allow a non-destructive investigation
of biomolecules in tissue with high tissue penetra-
tion depth and spatial resolution (Cicchi and Pavone,
2014) (Vogler et al., 2015).
In the past, MPM techniques like two-photon ex-
cited fluorescence (TPEF) and second harmonic gen-
eration (SHG) along with coherent anti-stokes Raman
scattering (CARS) were used to visualize biomolecu-
lar changes associated with IBDs. Biomolecular in-
formation like changed CARS, TPEF and SHG signal
intensity along with the crypt morphometries served
as predictive marker for an inflamed colon tissue.
Likewise, Chernavskaia et al. presented a predictive
modelling of histological indexes associated with IBD
based on the biomolecular changes of the crypt and
mucosa region. Such an automatic predictive mod-
elling of histological indexes is beneficial to accel-
erate IBD diagnosis. In the work of Chernavskaia
et al., the crypt and mucosa region were manually
segmented, so a full automatization of the predictive
modelling of histological indexes requires a seman-
tic segmentation of crypt and mucosa region without
manual effort.
Semantic segmentation of the crypt and mucosa
396
Pradhan, P., Meyer, T., Vieth, M., Stallmach, A., Waldner, M., Schmitt, M., Popp, J. and Bocklitz, T.
Semantic Segmentation of Non-linear Multimodal Images for Disease Grading of Inflammatory Bowel Disease: A SegNet-based Application.
DOI: 10.5220/0007314003960405
In Proceedings of the 8th International Conference on Pattern Recognition Applications and Methods (ICPRAM 2019), pages 396-405
ISBN: 978-989-758-351-3
Copyright
c
2019 by SCITEPRESS – Science and Technology Publications, Lda. All rights reserved

region is challenging due to several reasons. First,
shape irregularities of the crypts add a large biolog-
ical variance to the data. For example, an inflamed
colon tissue reveals crypt deformations and a loss of
crypt density, whereas regularly shaped crypts can be
found in healthy colon tissue. Second, the crypts are
located within the mucosa and therefore the two re-
gions overlap, making the classification even more
difficult. Third, the identification of the crypt bound-
aries is complicated as they are closely located to each
other. Lastly, there is a limited amount of annotated
medical data, which captures various tissue structures
of an inflamed colon. The above mentioned reasons
lead to a high morphological variance of the tissue
structures thereby making the semantic segmentation
of the crypt and mucosa challenging. For this segmen-
tation task machine learning algorithms can be uti-
lized, either classical machine learning or deep learn-
ing. Due to this challenging segmentation task men-
tioned above a high domain-specific representation is
needed, which is difficult to obtain using hand-crafted
features in classical machine learning.
On the other hand, deep convolutional neu-
ral networks (DCNNs) are capable of learning
domain-specific representations of an image and have
achieved successful results in image classification
(Babaie et al., 2017) (Krizhevsky et al., 2012a), object
recognition (Pathak et al., 2018) and semantic seg-
mentation (Roth et al., 2015) (Long et al., 2014). Ex-
isting DCNNs like U-Net (Ronneberger et al., 2015)
and SegNet (Badrinarayanan et al., 2015) have gained
state-of-the-art results in biomedical image segmenta-
tion and in the field of digital pathology (Janowczyk
and Madabhushi, 2016). In this study, we utilize DC-
NNs to semantically segment multimodal images into
biologically significant regions for assisting the pre-
dictive modelling of histological indexes. Further-
more, we compare the segmentation results obtained
by a DCNN with a classical machine learning ap-
proach.
The paper is organized as follows: In section 2
we introduce the previous work related to gland seg-
mentation of histology images, in section 3 we outline
our multimodal image dataset and our segmentation
workflow. This is followed by a description of the
evaluation metrics and a presentation of the results in
section 4. We discuss and conclude our work in sec-
tion 5 and 6, respectively.
2 RELATED WORK
Medical Image Segmentation (MIS) can be utilized
for numerous applications like identifying tissue
structures, cell counting, lesion and tumour detection
(Norouzi et al., 2014). The approaches for MIS can
be categorized into three types. First, the segmen-
tation using classical image processing techniques
like thresholding, morphological operations and wa-
tershed transform (Wu et al., 2005). Second, train-
ing a classification model based on handcrafted im-
age features (classical machine learning) like statis-
tical features, grey level co-occurrence matrix fea-
tures and local binary patterns (Farjam et al., 2007)
(Doyle et al., 2007) (Naik et al., 2008) (Guo et al.,
2018). And the third approach is the segmentation
using high-level features obtained by a DCNN (Kainz
et al., 2017) (Awan et al., 2017) (Chen et al., 2016).
Wu et al. utilized classical image processing al-
gorithms including thresholding and seeded region
growing for segmentation of the human intestinal
glands. However, this method considered a prior
knowledge of the morphological structures of the
gland and was qualitatively evaluated (Wu et al.,
2005). In another approach by Peng et al., k-means
clustering and morphological operations were used
to segment the prostate glandular structures. Based
on these structures a linear classifier to distinguish
normal and malignant glands was constructed (Peng
et al., 2011). Peng et al. utilized a k-means clustering
algorithm directly on the colour information. There-
fore, the approach is not incorporating shape and tex-
ture features, which are important for crypt segmen-
tation.
In the contribution by Farzam et al. and Doyle et
al., texture, shape and graph-based features were ex-
tracted within a classical machine learning approach.
Based on these features, a linear classifier to dis-
tinguish different pathological tissue sections of the
prostate cancer patients was built (Farjam et al., 2007)
(Doyle et al., 2007). In the work presented by Naik
et al., a Bayesian classifier was used to identify true
lumen areas and the false positive lumen areas were
removed by applying size and structure constraints.
Using the true lumen area, a level set curve (Li et al.,
2005) was initialized and evolved until the interior
boundary of the nuclei. Morphological features (like
distance ratio, compactness, area overlap ratio) were
calculated based on the boundaries of the detected lu-
men area and nuclei. This was followed by a mani-
fold learning scheme called Graph Embedding algo-
rithm (Shi and Malik, 2000) to reduce the dimension
of the feature space. Based on the reduced feature
space, a support vector machine (SVM) algorithm
was used to classify the images into different Glea-
son grades of prostate cancer (Naik et al., 2008). The
above-mentioned methods efficiently segmented reg-
ularly shaped gland structures but faced challenges in
Semantic Segmentation of Non-linear Multimodal Images for Disease Grading of Inflammatory Bowel Disease: A SegNet-based
Application
397
segmenting irregularly shaped gland structure.
To tackle this problem, Gunduz-Demir et al. pro-
posed an object-graph based approach that relies on
decomposing an image into objects. Their approach
used a three-step region growing algorithm, followed
by boundary detection and false region elimination
(Gunduz-Demir et al., 2010). In another work by Sir-
inukunwattana et al. (Sirinukunwattana et al., 2015),
a Random Polygons Model (RPM) to segment glan-
dular structure in human colon tissue was formulated.
The glandular structures were modelled as polygons
with random vertices that were located on the cell
nuclei within the epithelium. Based on the spatial
arrangement of the epithelial nuclei and neighbour-
ing nuclei, an inference of the RPM was made via
Reversible-Jump Markov Chain Monte Carlo simu-
lation. False positive polygons were removed by
post-processing procedures (Sirinukunwattana et al.,
2015). While this technique is stochastic in nature, it
can produce different results for the same image and
thus a robust approach is needed.
Approaches using DCNNs like AlexNet
(Krizhevsky et al., 2012b), VGGNet (Simonyan
and Zisserman, 2014), GoogLeNet (Szegedy et al.,
2014), U-Net (Ronneberger et al., 2015) and SegNet
(Badrinarayanan et al., 2015) have achieved promis-
ing results in MIS. The recent MICCAI 2015 Gland
Segmentation Challenge presented several innovative
algorithms for segmentation of colon glands in
histology images (Sirinukunwattana et al., 2015).
Chen et al. achieved state-of-the-art performance on
the Warwick-QU colon adenocarcinoma dataset by
integrating multi-level feature representation with
Fully Convolutional Network (FCN) (Chen et al.,
2016). Likewise, Kainz et al. used two DCNN that
were inspired by the LeNet-5 architecture (LeCun
et al., 1998) (Kainz et al., 2017). The first DCNN was
used to separate the closely located gland structures
and the second DCNN was used to distinguish gland
and non-gland regions (Kainz et al., 2017). In Awan
et al., a DCNN was used to mark gland boundaries
and based on the glandular shape, a two-class and
three-class classification model for colorectal ade-
nocarcinoma using histology image was designed
(Awan et al., 2017).
In this contribution, we intend to use a SegNet
model (Badrinarayanan et al., 2015) for the semantic
segmentation of non-linear multimodal images into
four distinct regions. Our method is different to the
described previous works in the following ways:
• This work is the first to implement semantic seg-
mentation of crypts and mucosa region in non-
linear multimodal images. All the above methods
have been implemented on H&E (Hematoxylin
and Eosin) stained image which needs a long sam-
ple preparation time and leads to sample destruc-
tion. In contrast, label-free non-linear multimodal
imaging can be used as an in vivo technique and its
automatic tissue classification can provide a real-
time histological index prediction.
• Our method is adapted to multimodal images that
show low SNR and are hard to analyze (Vogler
et al., 2015).
• Unlike other machine learning methods, we per-
form a four-class semantic segmentation of multi-
modal images. In addition to the crypt region we
also segment the mucosa region that can be used
to assign a histological index.
3 MATERIAL AND METHODS
3.1 Dataset
For this study, we utilized an already published
dataset composed of twenty multimodal images sam-
pled from twenty IBD patients. Each multimodal im-
age was converted to an RGB image, which was con-
structed based on the three modalities, CARS at 2850
cm
−1
(red channel), TPEF at 458 nm (green chan-
nel) and SHG at 415 nm (blue channel). We followed
the same image pre-processing steps as explained by
Chernavskaia et al. which included downsampling
of the multimodal image followed by median filter-
ing, uneven illumination correction (Legesse et al.,
2015), background estimation and contrast adjust-
ment (Chernavskaia et al., 2016). The dataset was
randomly divided into 11 training, 5 validation and 4
test images. The training dataset was augmented us-
ing a rotation angle 60°and 90°.
A histological index between 0 (healthy) and 2
(severe disease) based on crypt architecture, mucosal
chronicity and activity was assigned to every image
by a trained pathologist. In addition, manually an-
notated crypt and mucosa regions were obtained as a
false-colour image (as shown in figure 1). The man-
ually annotated image is partitioned into four subre-
gions R
l
, l = {0, 1, 2, 3}: mucosa without crypt (R
0
)
labelled as 0, crypt (R
1
) labelled as 1, non-mucosa
(R
2
) labelled as 2 and background (R
3
) labelled as 3.
Table 1: Overview of the dataset.
Dataset # images
Rotation
angle
Total
# patches
# selected
patches
Train 11 0°, 60°, 90° 9.228 3.990
Validation 5 0° 1.168 1.168
Test 4 0° 880 880
ICPRAM 2019 - 8th International Conference on Pattern Recognition Applications and Methods
398
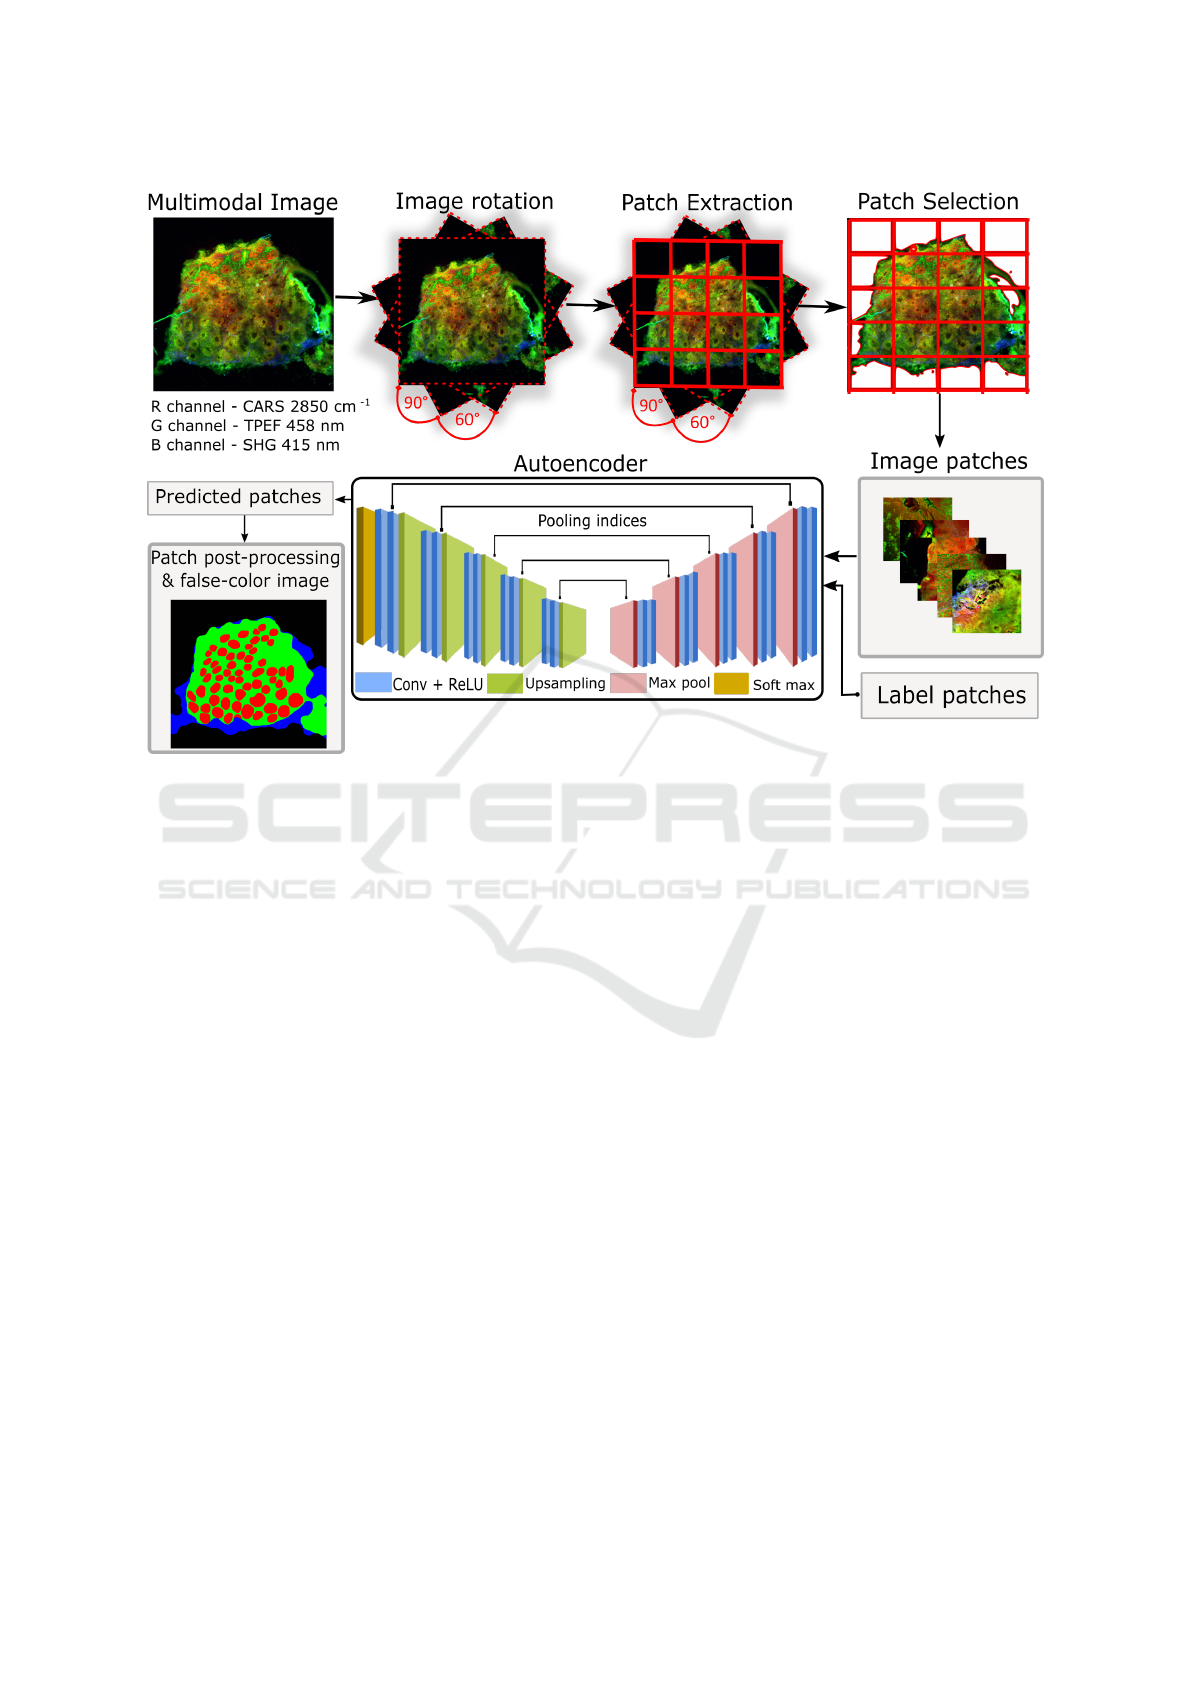
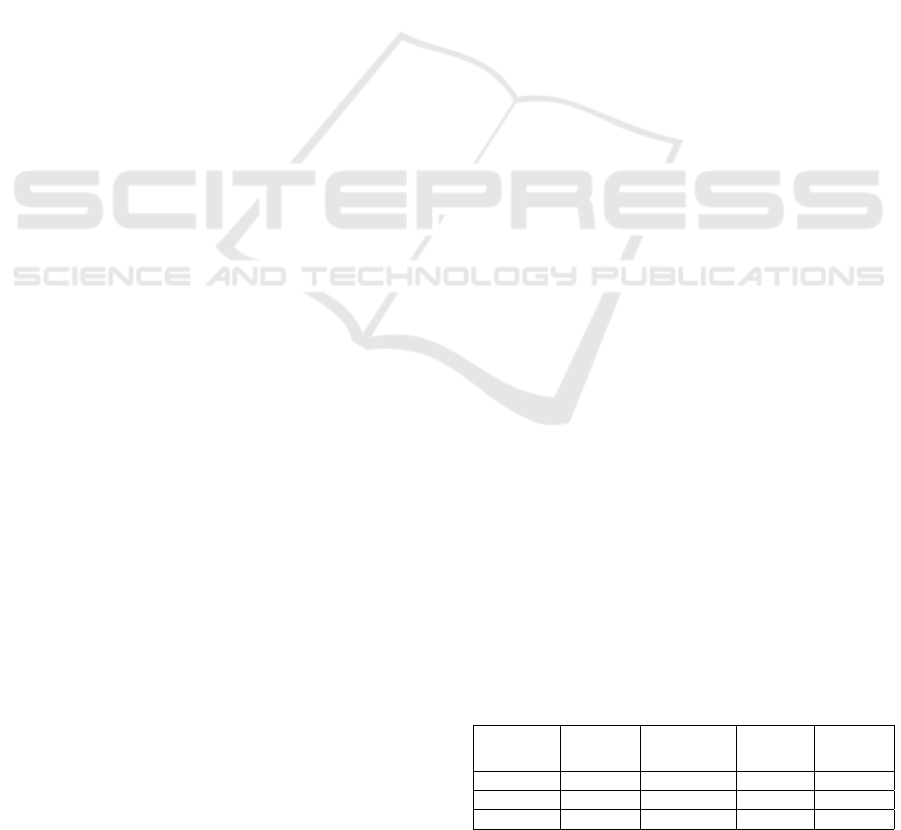
Figure 1: Overview of our proposed segmentation workflow. (1) Data augmentation using random rotations of the multimodal
image. (2) Extracting patches of size 256 × 256. (3) Selecting patches including only tissue regions. (4) Training a SegNet
model using the patches and their label map. (5) Combining the predicted patches into a segmentation map. The segmentation
map is depicted as false-colour image where green, red, blue and black represent R
0
(mucosa without crypt), R
1
(crypt), R
2
(non-mucosa), R
3
(background).
3.2 Classical Machine Learning
Approach
We formulate the tissue segmentation task as a pixel
classification problem. For the pixel classification we
extracted texture features locally using first-order sta-
tistical moments of the histogram (Guo et al., 2018).
These features give an intuitive understanding of the
underlying texture in different tissue regions locally
and are easy to calculate.
A set of 11 texture features (mean, standard de-
viation, skewness, kurtosis, median, energy, entropy,
RMS, variance, minimum, maximum) was calculated
using a window of (5 ×5) around each pixel for every
channel of the multimodal images. This led to 33 tex-
ture features (11 features × 3 channels) per pixel. To
reduce the computational complexity, the multimodal
images were resized by a factor of 3 and features were
calculated for every fifth pixel. Background pixels
were excluded with the help of a binary mask which
was generated using k-means clustering (k = 2) and
morphological operations. Morphological operations
composed of dilation (kernel size: 9 × 9, iterations:
2), closing (kernel size: 9×9, iterations: 2) and open-
ing (kernel size: 3 × 3, iterations: 2) were used. A
linear classification model based on a principal com-
ponent analysis in combination with a linear discrim-
inant analysis (PCA-LDA) was built using the 33 tex-
ture features. The model was trained using texture
features extracted from 11 training images and its per-
formance was evaluated on the remaining images.
All the computations were performed using
Python machine learning library Scikit-learn (Pe-
dregosa et al., 2011), Numpy (Travis E, 2006) and
Scipy (Jones et al., 2001). The total execution time
was approximately 20 hours on a commercially avail-
able PC system Intel® Core
TM
i5-7500 CPU, 3.40
GHz, 16GB RAM.
3.3 Deep Learning Approach
3.3.1 Encoder-decoder Architecture
We used the SegNet architecture proposed by Badri-
narayanan et al. (Badrinarayanan et al., 2015). This
network proceeds with an encoder and a decoder with
13 convolutional layers in each. The input to the first
layer of the encoder is an image of size M × N.
Semantic Segmentation of Non-linear Multimodal Images for Disease Grading of Inflammatory Bowel Disease: A SegNet-based
Application
399

An activation map of the (m + 1)
th
encoder layer
is given as:
x
m+1
= [MAX{ReLU[CONV
m
{x
m
} + b
m
]}] (1)
CONV{.} is the convolution operator, ReLU[.] is
the rectified linear unit function: f (x) = max(0, x),
MAX{.} is the max pooling layer with a receptive
field of (2 × 2) and a stride of 2, m ε{1, 2. . . . . . .., 13}
represent index of the convolution layer and b
m
is the
learned bias of m
th
layer. The decoder consists of
an upsampling, convolution and batch normalization
layer. An activation map y
m+1
of the (m + 1)
th
de-
coder layer is given as:
y
m+1
= NORM[CONV
m
{US(y
m
) + b
m
}] . (2)
Here, y
m
is the activation map of m
th
layer, US(.) is
the upsampling layer and NORM[.] is the batch nor-
malization layer. The features from the last layer
of the decoder are fed to a softmax activation layer.
The output of the softmax layer is a c channel im-
age, where c represents the number of classes. A seg-
mented image is generated by assigning each pixel to
the class, which had the maximum probability.
3.3.2 Segmentation Workflow
The semantic segmentation of the multimodal image
into four regions was performed using a patch based
convolutional neural network approach (Jaremenko
et al., 2015). This workflow was implemented using
Python with the Deep Learning Library Keras (Chol-
let et al., 2015) with Theano backend (Theano Devel-
opment Team, 2016).
The model construction started with a patch ex-
traction and a patch selection. Each multimodal im-
age (denoted by I) of size M × N was divided into
patches (denoted by P) of size 256 × 256 pixels with-
out any overlap. The number of patches per image
was different as our images were different in size.
Each patch P
i
can be partitioned into at most four
sub-regions (denoted as R
0
, R
1
, R
2
, R
3
) such that
S
3
l=0
R
l
= P where
S
represents union set. To remove
the background patches from the training set, a homo-
geneity factor (H =
∑
K
s=1
∑
K
t=1
p
st
1+|s−t|
, where p
st
is the
probability of relative position of a pixel pair, K is the
distinct intensity level) was calculated for each patch
and a threshold of 60% was optimized such that all
the patches belonged to the tissue section. This led to
9.228 training patches. The patches from validation
and test set were used for model evaluation. Table 1
shows an overview of the dataset and the patches.
For patch training, the SegNet model (Badri-
narayanan et al., 2015) was trained end-to-end to
classify the pixels of the multimodal patch into the
four regions. The input of the SegNet model (Badri-
narayanan et al., 2015) was a multimodal patch and
the output of the model was a segmented patch. The
weights of the encoder layers were initialized using
VGG16 model pre-trained on ImageNet dataset (Si-
monyan and Zisserman, 2014) (Russakovsky et al.,
2014). We trained the model using a mini-batch of
five patches and the stochastic gradient descent op-
timizer to minimize the cross-entropy loss function.
The learning rate was set to 10
−4
and the training was
terminated when the validation loss converged. The
total training time was approximately 3 hours on a
single NVIDIA GeForce GTX 1060 (6GB memory).
The model performance was evaluated on the test
patches. The predicted patches were combined into
a whole image, which was called ‘segmented map’.
This segmented map was post-processed using mor-
phological operations like removing blobs and filling
holes. The segmented map was visualized as a false-
colour image, wherein the regions R
0
(mucosa with-
out crypt), R
1
(crypt), R
2
(non-mucosa), R
3
(back-
ground) were indicated in green, red, blue and black,
respectively. The segmented map was visually evalu-
ated, and the quantitative evaluation of the segmented
regions was performed by calculating the F1 score
and recall as explained in section 4.
4 RESULTS
4.1 Qualitative Evaluation
We visually inspected the segmented map of the vali-
dation and the test images. The segmentation of reg-
ularly shaped crypts for images with architecture = 0,
chronicity = 0, activity = 0, was good. On the other
hand, the model performed poorly for segmenting ir-
regularly shaped crypts observed in architecture>0
and chronicity>0. The segmentation of the mucosa
region was good for all images. We believe that
training the SegNet model (Badrinarayanan et al.,
2015) with more images of histological index greater
than 0 can improve the segmentation performance for
images with higher histological indexes, e.g. with
stronger altered crypt structures. Also a good qual-
ity image with high SNR is required for training the
model.
4.2 Quantitative Evaluation
One of the evaluation metrics for classification prob-
lems is accuracy, which is misleading for unbalanced
class sizes. In our case the number of background
ICPRAM 2019 - 8th International Conference on Pattern Recognition Applications and Methods
400
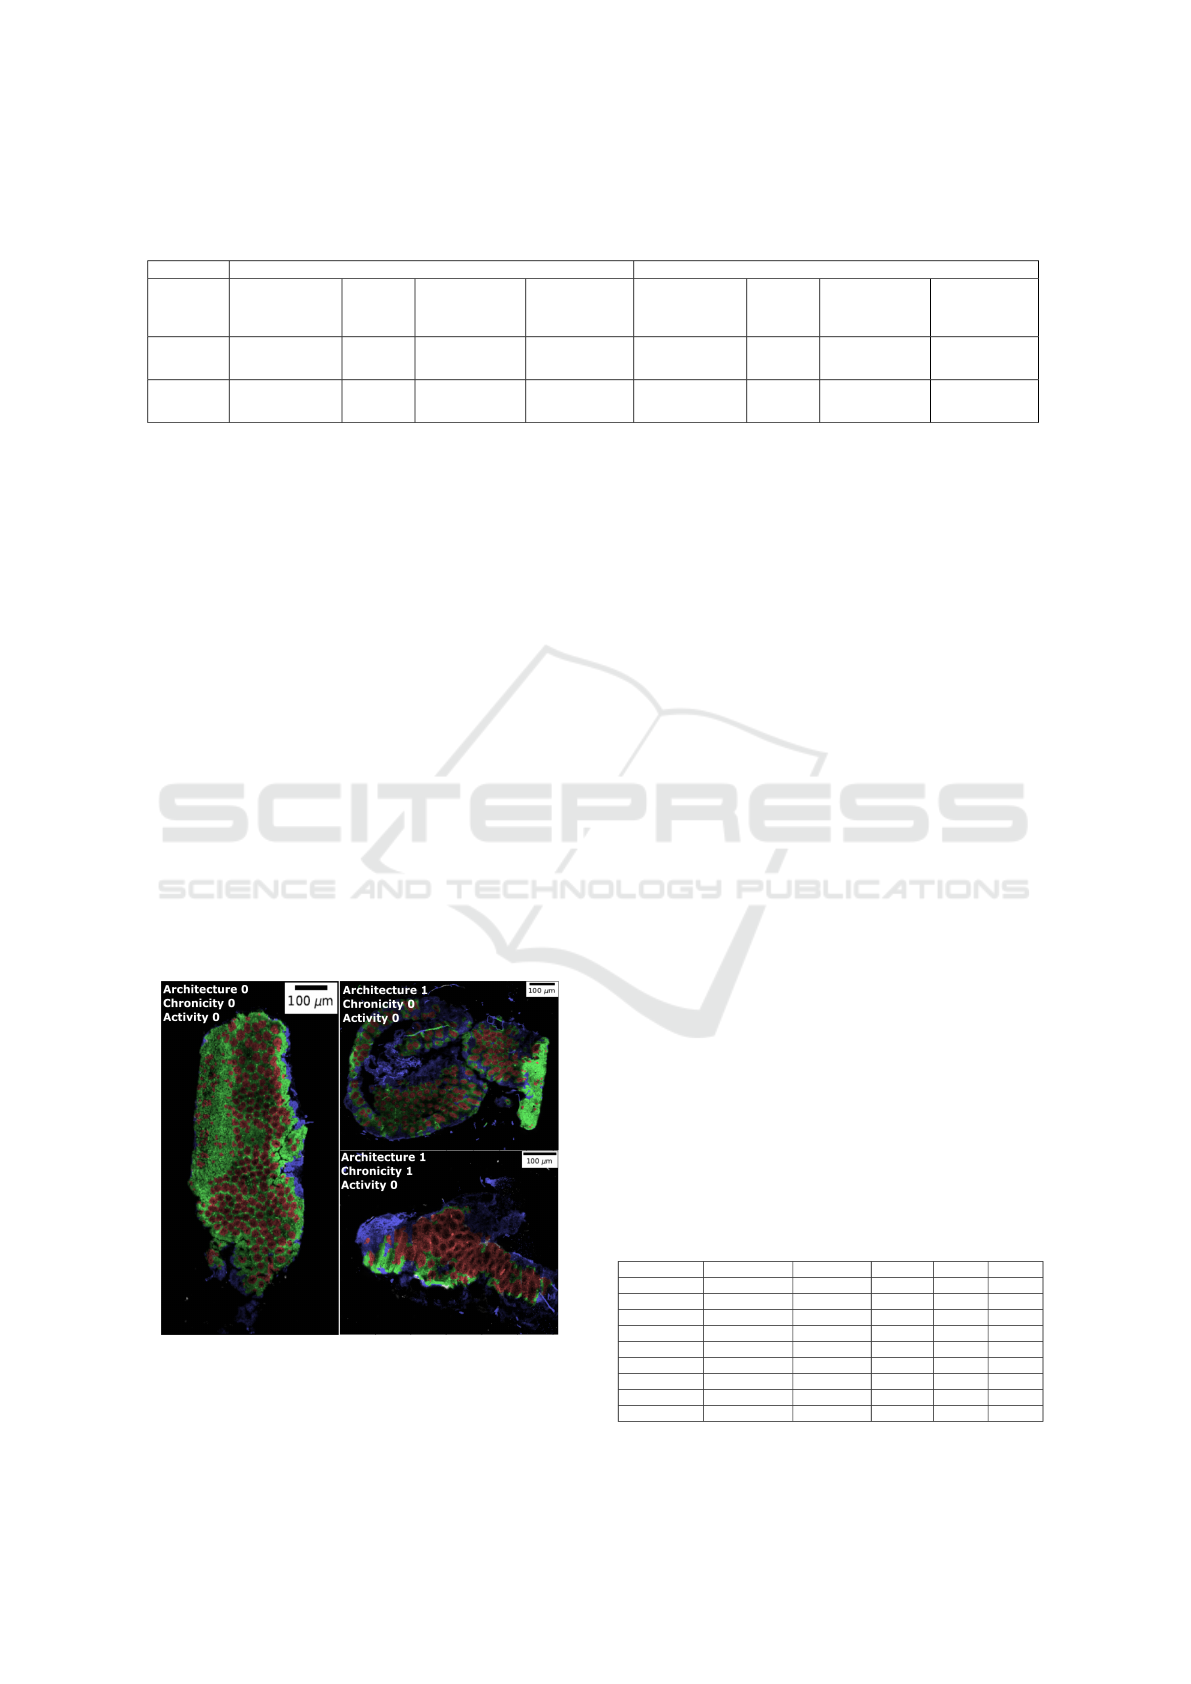
Table 2: Comparison of machine learning and deep learning prediction for R
0
(mucosa without crypt), R
1
(crypt), R
2
(non-
mucosa) and R
3
(background) based on F1 score and recall. The values correspond to mean (± standard deviation). The
number in bold is the best score for classical machine learning and deep learning.
F1 score Recall
R
0
(mucosa
without crypt)
R
1
(crypt)
R
2
(non-mucosa)
R
3
(background)
R
0
(mucosa
without crypt)
R
1
(crypt)
R
2
(non-mucosa)
R
3
(background)
Deep
learning
0.55
(±0.17)
0.63
(±0.13)
0.64
(±0.14)
0.95
(±0.02)
0.57
(±0.22)
0.63
(±0.17)
0.76
(±0.15)
0.92
(±0.03)
Machine
learning
0.27
(±0.11)
0.18
(±0.18)
0.56
(±0.23)
0.96
(±0.02)
0.45
(±0.12)
0.55
(±0.24)
0.44
(±0.25)
1
(±0.00)
pixels is much higher than the number of pixels be-
longing to the crypt region, hence accuracy is an in-
appropriate choice for an evaluation metric.
We evaluated the model performance using F1
score and recall for each region. The number of pixels
in the segmented map that intersect with its manually
annotated image is considered as true positive. The
higher the number of true positives, higher is the F1
score and recall. The two metrics are given by F
1
=
2TP/(2TP+FN+FP) and Recall= TP/(TP+FN), where
TP is true positive, FP is false positive and FN is false
negative.
In table 2, we report the mean and standard de-
viation of the F1 score and recall for each region of
the segmented maps after post-processing. These val-
ues did not change significantly before and after post-
processing. The overall segmentation accuracy for the
region R
0
, R
1
, R
2
shows that SegNet model (Badri-
narayanan et al., 2015) outperformed the classical ma-
chine learning approach. Specifically, an overlap of
the predicted crypts with manually annotated crypts
was 18% and 63% using classical machine learning
and deep learning, respectively.
Figure 2: Segmented map superposed with the grey scale
multimodal image along with the histological indexes.
Regularly shaped crypts (left image) are well segmented
whereas a poor segmentation of irregularly shaped crypts
is observed (right bottom).
In table 3, we report the F1 scores of R
0
(mu-
cosa without crypt) and R
1
(crypt) for the test and
validation image along with its histological indexes
for both learning approaches. The evaluation of the
segmented regions is important as chronicity of the
mucosa and the architecture of crypts serve as pre-
dictive marker for the IBD diagnosis. From the re-
sults, we observe that using deep learning the two re-
gions for different histological index levels are effi-
ciently segmented. Furthermore, the SegNet model
(Badrinarayanan et al., 2015) shows remarkable per-
formance on images with lower histological index
(like test image 4). The F1 score for both regions R
0
(mucosa without crypt) and R
1
(crypt) were 0.75 and
0.71, respectively.
However, the trained SegNet model (Badri-
narayanan et al., 2015) shows under-segmentation
for some cases shown in table 4. The first column
is a multimodal image patch, the second column is
the manual annotation, the third and fourth column
is the prediction by classical machine learning and
deep learning (without post-processing), respectively.
The crypt segmentation using the handcrafted fea-
tures show worse performance, whereas the SegNet
(Badrinarayanan et al., 2015) model can efficiently
segment regularly shaped and distorted crypts. How-
ever, the SegNet model (Badrinarayanan et al., 2015)
leads to under segmentation of closely located crypts
shown in the fourth and fifth row. Also, a noisy patch
shown in the last row can degrade the quality of the
segmentation.
Table 3: F1 score of the region R
0
(mucosa without crypt)
and R
1
(crypt) for validation and test images along with its
histological indexes. The best performance is obtained for
the image with architecture = 0, activity = 0, chronicity = 0.
Image Architecture Chronicity Activity F
1
(R
0
) F
1
(R
1
)
Test image 1 1 1 0 0.69 0.60
Test image 2 1 1 0 0.67 0.69
Test image 3 1 0 0 0.49 0.61
Test image 4 0 0 0 0.76 0.71
Test image 5 1 0 0 0.26 0.32
Val image 6 2 2 1 0.37 0.68
Val image 7 1 0 0 0.74 0.74
Val image 8 1 1 0 0.46 0.65
Val image 9 1 0 0 0.56 0.70
Semantic Segmentation of Non-linear Multimodal Images for Disease Grading of Inflammatory Bowel Disease: A SegNet-based
Application
401
Table 4: The first three rows show regularly sized and deformed crypts with a precise segmentation (without post-processing)
using our trained SegNet model. The last three rows illustrate typical cases of under-segmentation, possibly due to closely
located crypts or a noisy patch. The region R
0
(mucosa without crypt) is shown in green, R
1
(crypt) is shown in red, R
2
(non-mucosa) is shown in blue and R
3
(background) is shown in black.
!
Multimodal image Manual annotation Machine learning Deep learning
Regularly shaped cryptsElongated crypt
Closely located cryptsNoisy patch
ICPRAM 2019 - 8th International Conference on Pattern Recognition Applications and Methods
402

5 DISCUSSION
In this paper, we presented a semantic segmentation
of non-linear multimodal images to automatize the
predictive modelling of histological indexes for char-
acterizing inflammatory bowel disease stages. We
used a SegNet (Badrinarayanan et al., 2015) model
for the segmentation of multimodal images into mu-
cosa and crypt regions. Moreover, we compared the
SegNet (Badrinarayanan et al., 2015) based semantic
segmentation of multimodal images with a classical
machine learning approach.
For the classical machine learning approach, tex-
ture features and linear classifier (PCA-LDA) was
chosen due to simplicity. In order to make a fair
comparison between the two approaches, same set of
training images were used and the window size in
the machine learning approach was set comparable to
the receptive field of the SegNet model. Optimizing
the window size for the machine learning approach
did not affect the performance significantly, rather
smaller window size increased the computation time.
It was observed that the classical machine learning ap-
proach along with the hand-crafted features lack the
ability to segment the tissue regions, due to a disturb-
ing biological variance resulting from different grades
of IBD. As these hand-crafted features are calculated
using the intensity at pixel-level, it failed to retain the
intrinsic shape information of the crypts. While man-
ually calculated texture features were incapable of
segmenting the crypt and mucosa regions, deep neu-
ral network like SegNet (Badrinarayanan et al., 2015)
achieved reasonable to good result.
Our SegNet model was trained using categori-
cal cross entropy loss function which considers ev-
ery pixel as an independent sample and asserts equal
learning for all pixels. This is a drawback for images
with unbalanced classes. Therefore, we believe that
weighted pixel wise cross entropy and dice loss func-
tion can segment the multimodal images effectively.
The weighted pixel wise cross entropy loss in the U-
net (Ronneberger et al., 2015) assisted the segmen-
tation of closely located cells in biomedical images.
Similarly for closely located crypts more advanced
loss functions (Hashemi et al., 2018) can be imple-
mented.
Deep learning approach can generalize the diver-
sity in the underlying data and learn domain-specific
representations, although it manifests certain draw-
backs. Firstly, it is difficult to understand the con-
tribution of the CARS, TPEF and SHG signal in-
tensity for the segmentation of the mucosa and the
crypts. Secondly, a deep learning approach requires
large amount of good quality data which is difficult to
obtain particularly in a new technique like non-linear
multimodal imaging. Thus, a data augmentation was
needed.
For data augmentation, the multimodal images
were randomly rotated to consider arbitrary orienta-
tions of the multimodal images. This helped to con-
struct a rotation-invariant model. The patches out-
side the image grid were zero-padded and were fil-
tered by the patch selection process before training
the model. However, another possibility could be to
mask these zero-padded regions in the loss calcula-
tion during model training. Other augmentation tech-
niques like zooming, shearing and resizing of the im-
ages affected the spatial resolution and the crypt ar-
chitecture in the multimodal image. Therefore these
techniques were not applied.
In addition to data augmentation, a patch-based
DCNN was used to increase the training data and also
retain the crypt architecture. The patch size 256 ×256
was optimized such that maximum tissue structure is
retained. Smaller patch size failed to retain informa-
tion between the crypts and generated more data mak-
ing the training computationally expensive. The patch
based DCNN worked efficiently, but due the com-
bining of the patches to an image a “blocky effect”
was generated. “Blocky effect” can also be generated
due some other factors like the use of ’same’ convolu-
tions instead of ’valid’ convolutions and odd number
of feature maps before the pooling layer during train-
ing process.
To tackle this “blocky effect” simple post-
processing methods were applied, which include mor-
phological operations like remove blobs and region
filling to eliminate false positive regions. These post-
processing methods improved the segmentation re-
sults qualitatively. However, quantitative evaluation
of these methods did not show significant changes in
the F1 score and recall. Therefore, more complicated
post-processing procedures like conditional random
field (CRF) (Sutton and McCallum, 2012) are needed
which can remove the false positives and improve re-
sults quantitatively. Nevertheless, these procedures
increase the model complexity. Our post-processing
methods led to an under segmentation of the crypts
in some patches. This can be misleading in assess-
ing the histological index as fusion of two regularly
shaped crypts can be identified as one deformed crypt,
leading to false prediction of IBD stage. Therefore,
care must be taken while choosing appropriate post-
processing procedures.
On the whole, a robust model can be constructed
for segmenting the multimodal images with a large
number of good quality images. Further, advanced
loss function and post-processing procedures as men-
Semantic Segmentation of Non-linear Multimodal Images for Disease Grading of Inflammatory Bowel Disease: A SegNet-based
Application
403

tioned above will need to be explored in future stud-
ies.
6 CONCLUSIONS
In summary, we achieved a quantitative evaluation
of a semantic segmentation task of non-linear mul-
timodal images to complement IBD diagnosis. An
automatic segmentation of the crypt and mucosa re-
gion can reduce the manual diagnostic effort and can
be used to predict histological indexes in real-time
based on non-linear multimodal images. One limi-
tation of our work was a small database with only a
few exemplars of high histological index levels. Nev-
ertheless, in future, a large dataset of annotated multi-
modal images to evaluate the model will be generated
and this will improve the model presented here. In
conclusion, non-linear multimodal imaging can assist
the ‘gold-standard’ techniques and can be utilized un-
der clinical conditions. Furthermore, incorporating a
model for automatic segmentation of multimodal im-
ages into the multimodal microscope can provide a
real-time histological index prediction and accelerate
the start of a clinical therapy.
ACKNOWLEDGEMENTS
Financial support of the EU, the ‘Th
¨
uringer Min-
isterium f
¨
ur Wirtschaft, Wissenschaft und Digi-
tale Gesellschaft’, the ‘Th
¨
uringer Aufbaubank’, the
Federal Ministry of Education and Research, Ger-
many (BMBF), the German Science Foundation (BO
4700/1-1, PO 563/30-1, STA 295/11-1), and Leib-
niz association via the ScienceCampus ‘InfectoOp-
tics’ for the project ‘BLOODi’ are greatly acknowl-
edged.
REFERENCES
Awan, R., Sirinukunwattana, K., Epstein, D., Jefferyes, S.,
Qidwai, U., Aftab, Z., Mujeeb, I., Snead, D., and Ra-
jpoot, N. (2017). Glandular morphometrics for objec-
tive grading of colorectal adenocarcinoma histology
images. Scientific Reports, 7(1):16852.
Babaie, M., Kalra, S., Sriram, A., Mitcheltree, C., Zhu, S.,
Khatami, A., Rahnamayan, S., and Tizhoosh, H. R.
(2017). Classification and retrieval of digital pathol-
ogy scans: A new dataset. CoRR, abs/1705.07522.
Badrinarayanan, V., Kendall, A., and Cipolla, R.
(2015). Segnet: A deep convolutional encoder-
decoder architecture for image segmentation. CoRR,
abs/1511.00561.
Chen, H., Qi, X., Yu, L., and Heng, P. (2016). DCAN: deep
contour-aware networks for accurate gland segmenta-
tion. CoRR, abs/1604.02677.
Chernavskaia, O., Heuke, S., Vieth, M., Friedrich, O.,
Sch
¨
urmann, S., Atreya, R., Stallmach, A., Neurath,
M. F., Waldner, M., Petersen, I., Schmitt, M., Bock-
litz, T., and Popp, J. (2016). Beyond endoscopic as-
sessment in inflammatory bowel disease: real-time
histology of disease activity by non-linear multimodal
imaging. Scientific Reports, 6:29239.
Chollet, F. et al. (2015). Keras.
Cicchi, R. and Pavone, F. S. (2014). Multimodal non-
linear microscopy: A powerful label-free method
for supporting standard diagnostics on biological tis-
sues. Journal of Innovative Optical Health Sciences,
7(5):1330008.
Doyle, S., Hwang, M., Shah, K., Madabhushi, A., Feldman,
M., and Tomaszeweski, J. (2007). Automated grad-
ing of prostate cancer using architectural and textural
image features. In 2007 4th IEEE International Sym-
posium on Biomedical Imaging: From Nano to Macro,
pages 1284–1287.
Farjam, R., Soltanian-Zadeh, H., Jafari-Khouzani, K., and
Zoroofi1, R. A. (2007). An image analysis approach
for automatic malignancy determination of prostate
pathological images. Clinical Cytometry, 72B:227–
240.
Gunduz-Demir, C., Kandemir, M., Tosun, A. B., and Sok-
mensuer, C. (2010). Automatic segmentation of colon
glands using object-graphs. Medical Image Analysis,
14:1–12.
Guo, S., Pfeifenbring, S., Meyer, T., Ernst, G., Eggeling, F.,
Maio, V., Massi, D., Cicchi, R., Pavone, F. S., Popp,
J., and Bocklitz, T. (2018). Multimodal image analysis
in tissue diagnostics for skin melanoma. Journal of
Chemometrics, 32:e2963.
Hashemi, S. R., Salehi, S. S. M., Erdogmus, D., Warfield,
S. K., and Gholipour, A. (2018). Asymmetric simi-
larity loss function to balance precision and recall in
highly unbalanced deep medical image segmentation.
CoRR, abs/1803.11078.
Janowczyk, A. and Madabhushi, A. (2016). Deep learn-
ing for digital pathology image analysis: A compre-
hensive tutorial with selected use cases. Journal of
Pathology Informatics, 7(1):29.
Jaremenko, C., Maier, A., Steidl, S., Hornegger, J., Oetter,
N., Knipfer, C., Stelzle, F., and Neumann, H. (2015).
Classification of confocal laser endomicroscopic im-
ages of the oral cavity to distinguish pathological from
healthy tissue.
Jones, E., Oliphant, T., Peterson, P., et al. (2001). SciPy:
Open source scientific tools for Python. [Online; ac-
cessed ¡today¿].
Kainz, P., Pfeiffer, M., and Urschler, M. (2017). Segmenta-
tion and classification of colon glands with deep con-
volutional neural networks and total variation regular-
ization. PeerJ, 5:e3874.
Krizhevsky, A., Sutskever, I., and Hinton, G. E. (2012a).
Imagenet classification with deep convolutional neu-
ICPRAM 2019 - 8th International Conference on Pattern Recognition Applications and Methods
404

ral networks. In Advances in Neural Information Pro-
cessing Systems.
Krizhevsky, A., Sutskever, I., and Hinton, G. E. (2012b).
Imagenet classification with deep convolutional neu-
ral networks. In Proceedings of the 25th Interna-
tional Conference on Neural Information Processing
Systems - Volume 1, NIPS’12, pages 1097–1105.
LeCun, Y., Bottou, L., Bengio, Y., and Haffner, P. (1998).
Gradient-based learning applied to document recogni-
tion.
Legesse, F., Chernavskaia, O., Heuke, S., Bocklitz, T.,
Meyer, T., Popp, J., and Heintzmann, R. (2015).
Seamless stitching of tile scan microscope images.
Journal of Microscopy, 258(3):223–232.
Li, C., Xu, C., Gui, C., and Fox, M. D. (2005). Level set
evolution without re-initialization: a new variational
formulation. In 2005 IEEE Computer Society Con-
ference on Computer Vision and Pattern Recognition
(CVPR’05), volume 1, pages 430–436 vol. 1.
Long, J., Shelhamer, E., and Darrell, T. (2014). Fully
convolutional networks for semantic segmentation.
CoRR, abs/1411.4038.
Naik, S., Doyle, S., Feldman, M., Tomaszewski, J., and
Madabhushi, A. (2008). Automated gland and nuclei
segmentation for grading of prostate and breast cancer
histopathology.
Norouzi, A., Rahim, M. S. M., Altameem, A., Saba, T.,
Rad, A. E., Rehman, A., and Uddin, M. (2014). Med-
ical image segmentation methods, algorithms, and ap-
plications. IETE Technical Review, 31(3):199–213.
Pathak, A. R., Pandey, M., and Rautaray, S. (2018). Ap-
plication of deep learning for object detection. Pro-
cedia Computer Science, 132:1706 – 1717. Interna-
tional Conference on Computational Intelligence and
Data Science.
Pedregosa, F., Varoquaux, G., Gramfort, A., Michel, V.,
Thirion, B., Grisel, O., Blondel, M., Prettenhofer,
P., Weiss, R., Dubourg, V., Vanderplas, J., Passos,
A., Cournapeau, D., Brucher, M., Perrot, M., and
Duchesnay, E. (2011). Scikit-learn: Machine learning
in Python. Journal of Machine Learning Research,
12:2825–2830.
Peng, Y., Jiang, Y., Eisengart, L., Healy, M., Straus, F.,
and Yang, X. (2011). Computer-aided identification of
prostatic adenocarcinoma: Segmentation of glandular
structures. Journal of Pathology Informatics, 2(1):33.
Ronneberger, O., Fischer, P., and Brox, T. (2015). U-net:
Convolutional networks for biomedical image seg-
mentation. CoRR, abs/1505.04597.
Roth, H., Farag, A., Lu, L., Turkbey, E. B., and Sum-
mers, R. M. (2015). Deep convolutional networks
for pancreas segmentation in CT imaging. CoRR,
abs/1504.03967.
Russakovsky, O., Deng, J., Su, H., Krause, J., Satheesh, S.,
Ma, S., Huang, Z., Karpathy, A., Khosla, A., Bern-
stein, M. S., Berg, A. C., and Li, F. (2014). Ima-
genet large scale visual recognition challenge. CoRR,
abs/1409.0575.
Sch
¨
urmann, S., Foersch, S., Atreya, R., Neumann, H.,
Friedrich, O., Neurath, M. F., and Waldner, M. J.
(2013). Label-free imaging of inflammatory bowel
disease using multiphoton microscopy. Gastroenterol-
ogy, 145(3):514 – 516.
Shi, J. and Malik, J. (2000). Normalized cuts and image
segmentation. IEEE Transactions on Pattern Analysis
and Machine Intelligence, 22(8):888–905.
Simonyan, K. and Zisserman, A. (2014). Very deep con-
volutional networks for large-scale image recognition.
CoRR, abs/1409.1556.
Sirinukunwattana, K., Snead, D. R. J., and Rajpoot, N. M.
(2015). A stochastic polygons model for glandular
structures in colon histology images. IEEE Transac-
tions on Medical Imaging, 34(11):2366–2378.
Sutton, C. and McCallum, A. (2012). An introduction to
conditional random fields. Foundations and Trends in
Machine Learning, 4(4):267–373.
Szegedy, C., Liu, W., Jia, Y., Sermanet, P., Reed, S. E.,
Anguelov, D., Erhan, D., Vanhoucke, V., and Rabi-
novich, A. (2014). Going deeper with convolutions.
CoRR, abs/1409.4842.
Theano Development Team (2016). Theano: A Python
framework for fast computation of mathematical ex-
pressions. arXiv e-prints, abs/1605.02688.
Travis E, O. (2006). A guide to numpy. USA: Trelgol Pub-
lishing,.
Vogler, N., Heuke, S., Bocklitz, T. W., Schmitt, M., and
Popp, J. (2015). Multimodal imaging spectroscopy
of tissue. Annual Review of Analytical Chemistry,
8:359–387.
Waldner, M. J., Rath, T., Sch
¨
urmann, S., Bojarski, C., and
Atreya, R. (2017). Imaging of mucosal inflammation:
Current technological developments, clinical implica-
tions, and future perspectives. Frontiers in Immunol-
ogy, 8:1256.
Wu, H.-S., Xu, R., Harpaz, N., Burstein, D., and Gil,
J. (2005). Segmentation of intestinal gland images
with iterative region growing. Journal of Microscopy,
220:190–204.
Semantic Segmentation of Non-linear Multimodal Images for Disease Grading of Inflammatory Bowel Disease: A SegNet-based
Application
405
