
ExploroBOT: Rapid Exploration with Chart Automation
John McAuley
1
, Rohan Goel
1,2
and Tamara Matthews
1
1
CeADAR, School of Computing, Technological University Dublin, Kevin Street, Dublin 8, Ireland
2
BITS Pilani, Department of Computer Science, Goa, India
Keywords:
Visual Analytics, Automatic Chart Generation, Data Exploration, Intelligent Visual Interfaces.
Abstract:
General-purpose visualization tools are used by people with varying degrees of data literacy. Often the user
is not a professional analyst or data scientist and uses the tool infrequently, to support an aspect of their
job. This can present difficulties as the user’s unfamiliarity with visualization practice and infrequent use of
the tool can result in long processing time, inaccurate data representations or inappropriate visual encodings.
To address this problem, we developed a visual analytics application called exploroBOT. The exploroBOT
automatically generates visualizations and the exploration guidance path (an associated network of decision
points, mapping nodes where visualizations change). These combined approaches enable users to explore
visualizations based on a degree of “interestingness”. The user-driven approach draws on the browse/explore
metaphor commonly applied in social media applications and is supported by guided navigation. In this paper
we describe exploroBOT and present an evaluation of the tool.
1 INTRODUCTION
Exploration is the key to Visual Analytics (VA). Du-
ring an explorative session, an analyst can create a
large number of visualizations when trying to under-
stand the intricacies of a dataset. In this process an an-
alyst selects data dimensions and applies different en-
coding strategies to produce a range of visualizations.
Experienced analysts use this exploration as a means
of sense making – iterating through vast swathes of vi-
sualizations to understand data particularities. How-
ever, data analytics is practiced by a broader commu-
nity of users with different levels of analytic expertise.
Unlike professional analysts, business users may
lack formal statistical training or visualization expe-
rience and may only use a tool occasionally, for pre-
sentations and reporting, or to understand a dataset.
This results in users spending time learning a tool, un-
derstanding the process of visual encoding and man-
aging complex datasets. The infrequency in using
the tool can enhance the problem as they must reac-
quaint themselves to the process of visual exploration
on each use. As a result, users often rely on the same
chart type – the approach that produced a positive out-
come previously – and ignore the different encoding
strategies that could provide more meaningful results.
To address this problem, we have developed an au-
tomated visual analytics tool called exploroBOT. Its
aim is to replace visualization creation with visuali-
zation exploration, borrowing interactive metaphors
from social media applications (such as “liking” and
“swiping”). Thus, as opposed to creating visualizati-
ons for a dataset by relying on preferred visual enco-
dings, the user can explore a range of visualizations
and then decide on what type of visualization or type
of data they would like to explore next. This reduces
the complexity experienced during visual exploration
and enables the user to rapidly navigate large datasets.
In this paper, we describe the motivating princi-
ples of exploroBOT and outline a set of design con-
siderations with their implementation. In a controlled
experiment we evaluated exploroBOT with a leading
Business Intelligence application (Tableau), the re-
sults showing that users answered a set of tasks more
rapidly and more accurately when using exploroBOT
than when using Tableau. This suggests potential in
developing systems that encourage users to explore
rather than create visualizations. We discuss the fin-
dings and outline directions for future work.
2 REVIEW OF LITERATURE
Numerous platforms enable data exploration through
computer-guided interactive visualizations, providing
visual analytics that target at specific business and
McAuley, J., Goel, R. and Matthews, T.
ExploroBOT: Rapid Exploration with Chart Automation.
DOI: 10.5220/0007345202250232
In Proceedings of the 14th International Joint Conference on Computer Vision, Imaging and Computer Graphics Theor y and Applications (VISIGRAPP 2019), pages 225-232
ISBN: 978-989-758-354-4
Copyright
c
2019 by SCITEPRESS – Science and Technology Publications, Lda. All rights reserved
225

analytic domains: Cognos (IBM), SQL Server BI
(Microsoft), Business Objects (SAP), Teradata, and
PowerPivot (Microsoft), many deployed as web ap-
plications
1
: Tableau, Spotfire, QlikView, JMP (SAS),
Jaspersoft, ADVIZOR Solutions, BoadrBI, Centri-
fuge, Visual Mining. However, the effective use
of these tools requires expertise in visualization,
statistics and data or relational semantics. There
can be a combinatorial number of visual encodings
(with multi-dimensionality and multi-level hierar-
chies) available to a user. This can provide the user
with a challenging visualization design space and re-
sults in sub-optimal or ineffective representations.
As a result, research seeks to support user-driven,
flexible exploration through the application of “intel-
ligent interfaces” (Pak Chung et al., 2000), Automatic
Visual Analytics enabling guided exploration (algo-
rithmically driven, adaptive and personalized) (Stol-
per et al., 2014; Graham and Wilkinson, 2010), “visu-
alization recommendation” (recommender systems)
and automated “visual assistants”.
Recommender systems incorporate a user’s pre-
vious activity on a platform to recommend new con-
tent. VisComplete for example, uses an existing col-
lection of visualization workflows (“pipelines”), mo-
deled as directed acyclic graphs, to build new pipeli-
nes and predict likely choices. The “small-multiples”
method is used in various multi-dimensional visuali-
sations (Scheibel et al., 2016). The “behavior-driven
recommendation” implemented in HARVEST (Gotz
et al., 2010) monitors users’ behavior patterns (“active
trail”) to derive recommendations.
In the absence of an item-user history, recommen-
ders use statistical and perceptual measures organi-
zed upon various conceptual frames. VizDeck, for in-
stance, generates a user interface that mimics the card
game metaphor, visualizations being selected based
on statistical properties of the data (Perry et al., 2013).
The SEEDB is a data-driven recommender that finds
interesting representations based on a “distance me-
tric” from a reference dataset (Vartak et al., 2015b).
VizRec (Vartak et al., 2015a) is a knowledge-based
visualization recommendation system using a set of
relevant criteria (called “AXES”). Although the sy-
stem can generate interesting visualizations fast, the
approach requires manual preprocessing to create uni-
fied visualization models using the AXES technique.
Voyager (Wongsuphasawat et al., 2016) supports
“faceted browsing”, introducing the notion of “design
and data variation”, along with “demonstration as a
1
www.tableau.com; www.spotfire.tibco.com;
www.qlik.com; www.jmp.com; www.jaspersoft.com;
www.advizorsolutions.com; www.board.com;
www.centrifugesystems.com; www.visualmining.com
means to recommendation” while VisExamplar (Sa-
ket et al., 2017) proposes visual transformations ba-
sed on a user’s interaction with an existing set of vi-
sual encodings (predicting users’ intent).
An area that received less attention in the litera-
ture is the idea of visualization sequencing in which
users can navigate a dataset using a set of (semi or
automatically generated) visualizations sequenced in
a coherent presentation. The notion of coherence is
addressed in “GraphScape” (Kim et al., 2017), which
looked at the cost of sequencing visualizations based
on chart similarity. Although this is an interesting
approach considering the underlying design space, it
neglects the user’s comprehension of the data or their
requirements in moving from one chart to another.
Visual Assistants provide automatic visualization
based on a combination of knowledge or heuristics
(based on early work in visualization research that
reduced abstract complexity through development of
data and user-orientated taxonomies (Shneiderman,
1996; Amar et al., 2005). “Vizassist” uses Interactive
Genetic Algorithms (IGA) to map models for visuali-
zation heuristics learning from user feedback (Bouali
et al., 2016). However, the user is required to ma-
nually define the IGA mapping model – therefore to
understand the core tenets of visualization design and
practice. In “CEF” (Yalc¸n et al., 2016) design gui-
dance links to cognitive stages, has fixed visualizati-
ons per data type and enumerates exploratory paths.
Several visualisation metaphors learned from this
study: the guided exploration, “faceted browsing”,
“design and data variation”, distance measures to eva-
luate chart “interestingness” – were creatively built
into exploroBOT.
3 THE exploroBOT SYSTEM
We present exploroBOT, an easy-to-use tool that ena-
bles the visual exploration of data without manually
creating charts or narrative development. The aim of
the system is to challenge the existing conventions on
visual analytics – in which the shelf and drag-drop
metaphors are widely applied – by automating the
chart creation and supporting data exploration pro-
cess. In this section, we consider the design space
and describe the implementation of exploroBOT.
exploroBOT is based on the “browsing explora-
tion” metaphor and uses a novel type of user-driven
navigation. It is supported by a visual guidance lat-
tice and a set of general decision-making steps, which
do not require previous learning from the user-system
interactions. The visual guidance lattice shows the
graph (network) of (currently available) charts inter-
IVAPP 2019 - 10th International Conference on Information Visualization Theory and Applications
226

Figure 1: Example of exploroBOT decision lattice.
connected by their navigation paths (Figure 1), pro-
viding visual clues of the seen/not seen charts and
the actual position along the exploration path. The
decision-making steps are generalized choices for the
next chart structure (design, dimensions, data type) or
special data properties (like “interestingness” and “si-
milarity”, which are described in Section 3.2).
The interaction in exploroBOT borrows from that
on social media archives, where users tend to con-
sume swaths of data quickly by honing their interests
in particular topics using simple interaction such as
liking, sharing, voting etc. Each of these lightweight
actions influence what content the user will be presen-
ted in subsequent sessions on the platform.
3.1 Path Selection during Exploration
The decision making process on which exploration
path to follow is entirely the user’s choice, suppor-
ted by a visualization of the charts network along the
“decision-making” steps (an example of the decision
lattice is shown in Figure 1).
The decision lattice is generated as a graph repre-
sentation of all the possible types of charts from the
data, with nodes representing the chart types. The
edges indicate the path choices between these charts
with the node colour indicating the current chart (yel-
low) and the possible charts in the immediate next
step (red) depending on the user’s choice. This de-
cision lattice serves as a “guiding” map for the user-
exploration of all possible charts.
While there is an advantage for experienced users
who already know the type of chart they want and can
navigate directly to a desired type of chart and data,
the less informed users can explore sequentially by
following several routes, defined by their choices in
the “decision-making” steps. At each step, the user is
asked whether he finds the present visualization “in-
teresting”. If yes, the user can explore further by alte-
ring the following three properties of a chart:
• Number of Dimensions: add or remove a data di-
mension. For example, adding a numerical data
dimension to a box-plot generates a scatter plot;
• Type of Variables: Keeping the chart design and
the number of dimensions same, replace one of
the dimension by some other variable;
• Chart Design: Alter the visual encoding, without
changing the data
On the other hand, if the user is not interested in
the current chart, he is routed to the most “dissimilar”
visual encoding from the present chart, post which he
can start exploring again. The notions of “interesting-
ness” and “dissimilarity” are explained in the subse-
quent subsection.
This approach incorporates the concept of “user-
guidance” and also the user-chosen “steps” to de-
fine the characteristics for each chart. The “user-
guidance”, based on a graph network for charts, crea-
tes a reference framework for understanding the path
and evolution of the exploration. It also helps in fin-
ding important charts and how many or what types of
charts can be generated. The latter idea is a genera-
lization of the basic chart making process that a kno-
wledgeable user would apply: they choose the chart
type, number of dimensions and data type. These
combined approaches lead to a quick definition of the
required charts, without other inputs from the user in
defining the design parameters.
3.2 Interestingness and Dissimilarity
exploroBOT is not a recommender system – where
previous information on user interest in certain charts
is recorded and then used to recommend more charts
or define the interestingness of a chart. Thus, here we
only look to fulfill the concept of chart “interesting-
ness” in its literal meaning.
The “interestingness” of a chart may have vari-
ous definitions depending on the user’s interests: the
user may be looking for charts with highly correlated
(or uncorrelated) data or for charts with high peaks
(e.g. outliers) or simply for multi-dimensional charts.
These criteria allow the user to quickly access the data
novelty or most unusual characteristics. While other
basis can be defined as measures of “interestingness”,
the criteria used in this work to quantify it are:
(i) Data Correlation: Highly correlated data (iden-
tified using the Pearson correlation coefficient) in
scatter plots and trend charts, hints towards an inte-
resting relationship between the two variables. A hig-
her absolute value of Pearson’s coefficient will mean
a higher interestingness.
ExploroBOT: Rapid Exploration with Chart Automation
227
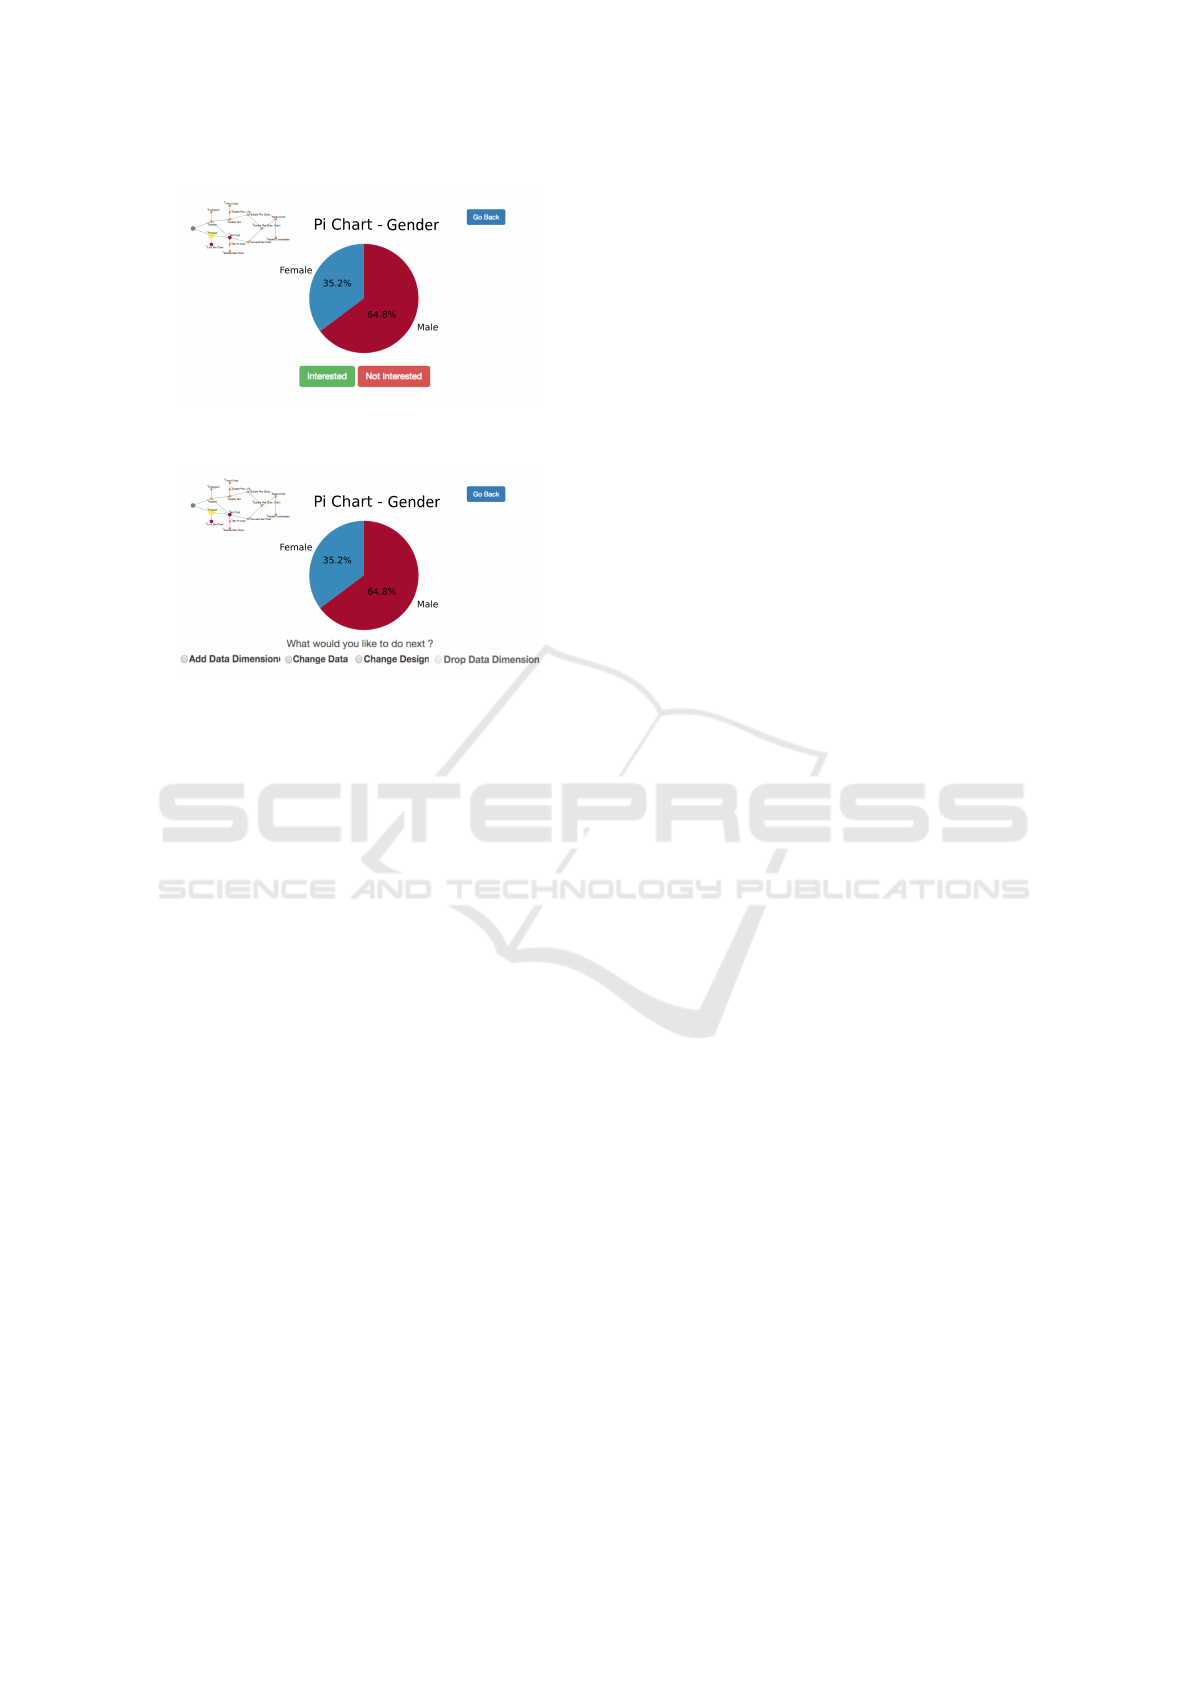
Figure 2: Examples of decision points in exploroBOT: ”In-
terested” vs ”Not interested”.
Figure 3: Examples of decision points in exploroBOT:
”Add/Drop data”, ”Change Data”, ”Change Design”.
(ii) Peaks: Spikes and large differences in a nu-
merical property of the dataset instantly attract atten-
tion. The normalized numerical differences in these
quantities are used to measure and compare the inte-
restingness value.
(iii) Outliers: Statisticians are looking for data
points defying the general characteristics of data. A
chart with more outliers is deemed more interesting.
When a user finds the current graph “not interes-
ting”, he is moved to a point in the decision lattice
with the most “dissimilar” graph to the current one.
To compare the charts, exploroBOT uses the cosine
similarity metric between visualizations represented
as vectors. For converting a chart to a vector, the fol-
lowing properties are considered: number of dimen-
sions, chart type (bar chart, pie chart, etc), markings
used in visualization (like bars in bar-chart, circles in
bubble chart, etc), types and names of attributes used
in visualization (numeric, string or date-time). Mo-
reover, “dummy coding” is used to represent the ca-
tegorical variables like “chart type” as dichotomous
variables, allowing computation of the cosine simila-
rity metric.
Nevertheless, it is not expected that users would
have a desired visualization in mind, the main scope
of exploroBOT is exploring the data within a well
organized framework, which shall contribute to the
user’s knowledge of data and its representations.
3.3 The User Interface
Given the aim of exploroBOT is to support non-
professional analysts, we developed a minimal inter-
face consisting of a single visualization and a single
decision point. This ensures a browse friendly inter-
face, as in social media applications. During the ex-
ploration process, on the screen (Figure 2 and 3), one
sees a chart and two buttons: “Interested” or “Not In-
terested”, along with a snapshot of the decision lat-
tice (as discussed in Section 3.1) to aid the exploration
process. A bigger view of the decision lattice (Figure
1) can be accessed by clicking on it.
As illustrated in Figure 4 each decision results in
a new graphical representation. In each instance, ad-
ding more data provides a more complex visualiza-
tion, encoding more data in an appropriate representa-
tion. In this example, the user begins with a pie chart
(univariate) with the attribute “Embarked”. Then the
user wants to explore further by adding a data dimen-
sion from many possible attributes. However, the user
only wants to see the “most interesting” visualization
that includes “Embarked” with one more dimension.
Here, the dimension “Fare” is automatically selected
(as the large difference in the heights of the “bars” is
a criteria for ”interestingness” – see subsection 3.2),
resulting in a bar chart (bivariate). Adding more di-
mensions, results in a grouped bar chart (multivariate)
and finally in a bubble chart. At each step in this ex-
plorative process, the new visualization or the new va-
riable to be added/removed is automatically selected
based on the concept of ”interestingness”. This pro-
cess reduces the need for a user to manually create a
visualization, select dimensions and measures etc.
When the user has completed the exploration, they
are presented with a history (Figure 5) of the visuali-
zations they interacted with during the session. At
this point, the user can change their reaction to a chart
(from interested to non-interested and vice-versa) or
potentially create a presentation. This approach ena-
bles iteration, re-engagement and path discovery.
4 DESIGN CONSIDERATIONS
In this section, we list the set of design considerations
(C1 - C5) which support the process of chart explo-
ration. The overarching aim is to create a simple
and easy to use application that enables a user to
intuitively explore large and complex datasets.
C1: Address the Cold Start Problem: Suggest
Dimensions for Analysis
Often there is a cold start problem with visual
IVAPP 2019 - 10th International Conference on Information Visualization Theory and Applications
228
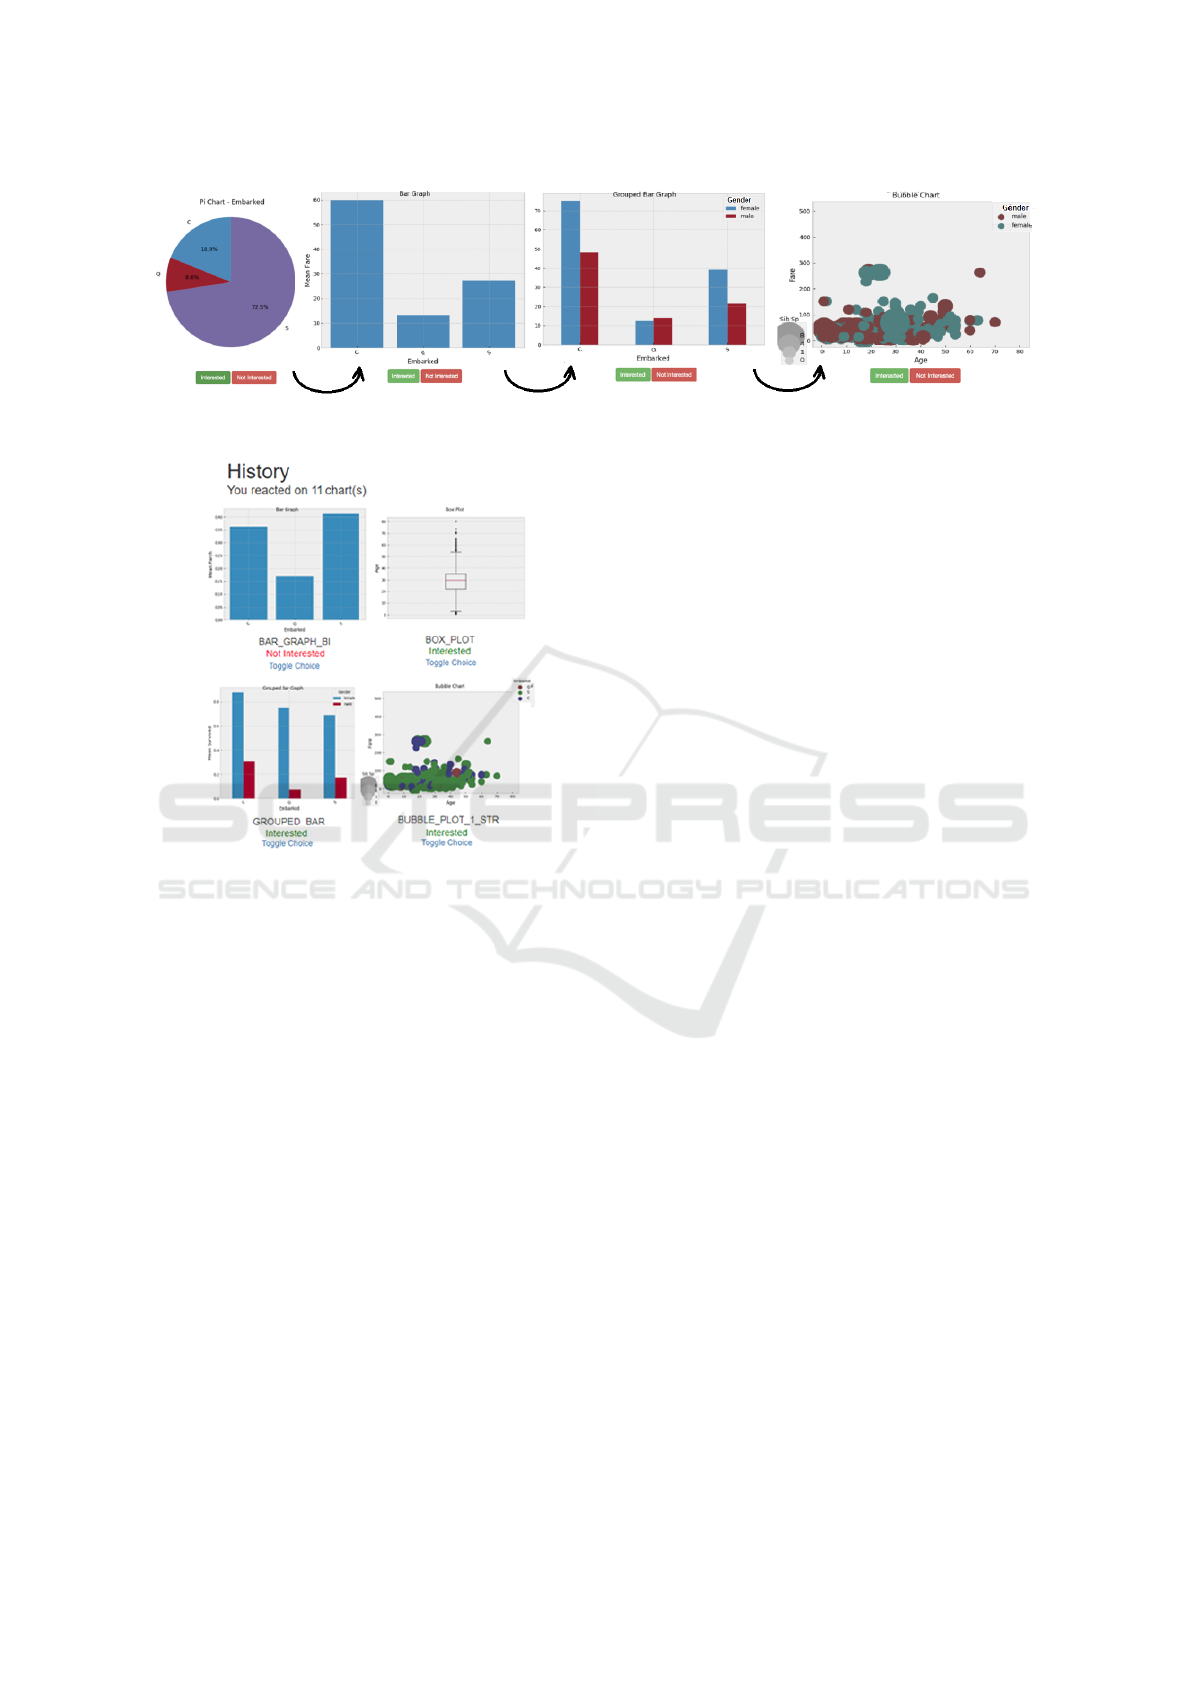
Figure 4: Example of exploroBOT user navigation. Data from Kaggle, Titanic dataset (www.kaggle.com/c/titanic/data).
Figure 5: Example of History of charts the user has interac-
ted with (partial image).
analytics as people get to grips with a dataset and
consider what is of interest, what should they look at
first or where should they start their analysis? This
problem is compounded when the data is complex,
if, for example, certain dimensions have a high
number of levels. In these cases, the user must bin
the data or filter out levels considered unnecessary.
Our approach is to suggest dimensions that can start
the analysis and provide the user with univariate
visualizations based on this selection – boxplot,
histogram, pie or bar chart. This reduces potential
overwhelm when beginning the explorative session.
A gradual increase in complexity helps the user
understand the data.
C2: Start exploration with Points of Interest
It is important that the initial visualization grabs the
user’s interest and incites their curiosity. From this
perspective, a set of statistical measures are used to
drive the analysis based on the idea of “interesting-
ness”. For example, outliers provide interesting focal
points which could enable the user to raise questions
or posit hypotheses about the data. Similarly, time
series help to set the scene or orientate the user, large
differentials within a single dimension shows a steep
rise or decline, while correlations between multiple
dimensions illustrate potential relationships in the
data.
C3: Exploration over Creation
Underpinning the design of exploroBOT is the view
that visual analysis is time consuming and potentially
inaccurate when employed by users without training
or expertise. To avoid these difficulties, we posit
the idea of exploration over creation so that instead
of creating a small set of visualizations, the user
browses a large repository of visualizations using
simple interactive techniques.
C4: Maintain Context and Sequence Visualizati-
ons
A problem with sequencing visualizations (as op-
posed to a multi-view or coordinated displays) is
maintaining context during analysis (Unwin et al.,
2006). A system should not just drop a user into an
explorative session and continually suggest visualiza-
tions to the user; each visualization requires reorien-
tation as the user tries to understand how the data is
presented.
This is achieved by asking the user how they
would like to change (Section 3) the existing vi-
sualization – different design (design variation),
different data (data variation), more data or less data
(data augmentation or reduction) – we select a new
visualization from the repository and present that
graph to the user. These changes in charts are not
random but aimed at supporting the users exploration.
C5: Enable Iteration and Path Discovery
Our work is founded on the assumption that multi-
ple exploratory paths exist within a dataset and that
chaining together visualizations in a coherent manner
helps to develop an understanding of the data, pro-
ducing insightful analysis. Users should be encoura-
ExploroBOT: Rapid Exploration with Chart Automation
229

Table 1: Task questions and answers.
Questions
1 What is the Female percentage among passengers?
2 How many children aged under 10 y.o?
3 What was the Median Fare of those Embarked as ”C” ?
4
What was the Age of oldest person Embarked
and their Gender?
Answers
1 (pichart, 32.5%)
2 (histogram, 50)
3 (barchart, 60)
4 (bubble plot, age/Embarked/gender; 70, female)
ged to explore varying paths, while new or alternative
paths for analysis should be suggested.
5 EVALUATION
We conducted a study to compare exploroBOT with a
leading Business Intelligence tool, Tableau. Tableau
is the market leader in exploratory visual analytics
and is promoted as a user friendly and rapid analytics
tool. Tableau’s principal interface is based on a shelf
metaphor – where the users place various dimensions
or measures on a canvas – where the visualizations
are rendered. This approach to visual analytics is a
common metaphor in BI tooling.
Tableau enables users to access all elements of a
chart, along with required settings for a wide variety
of chart descriptors. Thus, it provides a highly versa-
tile tool for designing accurate visualizations. Oppo-
sed to Tableau, the exploroBOT has data exploration
as its main scope with minimal access to chart details.
Therefore, here we compare only the visual data ex-
ploration process – considering the user access time
and results accuracy (how many answers were correct
out of the total) between a complete user-defined chart
design (Tableau) and a basic exploratory tool (explo-
roBOT).
5.1 Study Design
We compared exploroBOT with Tableau on a single
dataset (the Kaggle Titanic dataset
2
) using a between
group methodology (2 groups, 2 apps, 1 dataset). The
dataset was selected because it is interesting, people
can relate to the information within and it has a rela-
tively equal division of dimensions (categorical) and
measures (numerical) variables.
The tasks were questions (Table 1) on information
that can be extracted using basic visual analytics. We
measured task accuracy and time to solve the task on
2
www.kaggle.com/c/titanic/data
four questions. Two additional questions were provi-
ded at first, to allow the participants begin their ses-
sion and get accustomed to the dataset and interface.
We purposefully did not provide any training on ex-
ploroBOT as the the aim of the tool was to enable
exploration without training or support.
5.2 Participants
We recruited 30 participants from an MSc course in
data visualization. The participants had undertaken
three projects with Tableau – and should have begin-
ner to intermediate familiarity with the tool – but were
unfamiliar with exploroBOT.
This cohort of students were considered suitable
as they have experience with Tableau, but would not
consider themselves expert users, and are studying
data visualization. As a result, they have knowledge
of charts and statistical techniques – such as boxplots
and histograms – as well as simple visualizations,
such as pie charts and bar charts.
5.3 Study Protocol
The study was conducted in two cohorts with each
cohort split between each tool. As mentioned, the
participants were not provided with any training on
exploroBOT but a short presentation of the tool was
provided in a previous class. Each group - Tableau
and exploroBOT - were given the questions, the da-
taset and the tool. They were asked to complete the
question sheet (there was no time limit on the study).
Each question sheet had four multiple choice questi-
ons (four tasks) and the participants were also asked
to mark the time they took to answer each question.
Then they were asked to provide some feedback on
their experience of the tool. The study time averaged
at about 20 minutes.
5.4 Analysis of Results
We hypothesised that visualization exploration (as de-
monstrated with the exploroBOT tool) would result
in more rapid and accurate insights (measured as the
accuracy and time of a task) when compared with
visualization creation (as demonstrated with the Ta-
bleau tool). We measured task time and task accuracy
(as percent of correctly answered questions out of to-
tal number of questions). Their means and confidence
intervals are shown in Table 2.
Given the relatively small number of participants
(15 for each group) the distribution of time and accu-
racy do not meet the requirements of normality, evalu-
ated using the Shapiro-Wilks test (Shapiro and Wilk,
IVAPP 2019 - 10th International Conference on Information Visualization Theory and Applications
230
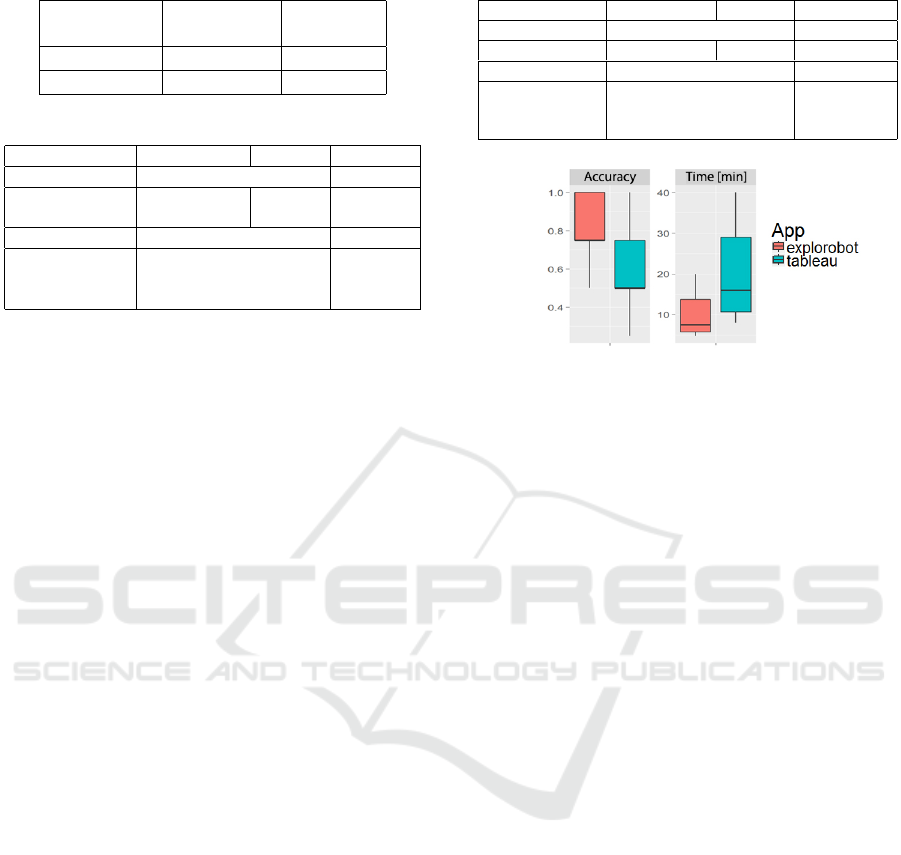
Table 2: Mean values with 95% confidence intervals.
App
Accuracy
[%]
Time
[min]
exploroBOT 83.3 ± 15.4 10.8 ± 7
Tableau 58.3 ± 22.5 19.4 ± 10
Table 3: Results of Statistical Tests for the Time parameter.
exploroBOT
Tableau p-value
Test p-values range
Shapiro-Wilk 0.006 0.106
<0.05 vs
>0.05
Lavene’s Test 0.145 >0.05
Welch Anova 0.011 <0.05
Kruskal-Wallis 0.005 <0.05
Wilkoxon 0.005 <0.05
1965). Therefore we could not ensure the validity
conditions required of a classic ANOVA test. For both
groups, the results for time and acccuracy have non-
normal distributions (with one exception, the Time
for the Tableau, Table 3) although the variances (eva-
luated using the Levene’s Test) (Levene, 1960) are
homogeneous (Table 3 and Table 4). As a result,
the means were compared using non-parametric tests:
the one-way ANOVA not assuming homogeneous va-
riances, the Welch one-way test (Welch, 1951), the
Kruskal-Wallis test, a median of all pairwise differen-
ces (Salkind, 2007) and the Wilcoxon-Matt-Whitney
test (Neuh
¨
auser, 2011), which does not require nor-
mal distributions.
For the above three tests, the p-value is less than
0.05 (Table 3 and Table 4) suggesting we can reject
the hypothesis H0 of identical populations. For both
criteria (time and accuracy), the test showed a sig-
nificant statistical difference (at 0.05 level) between
groups, suggesting that the group using exploroBOT
completed the tasks more rapidly and more accurately
than the group using Tableau (details in Table 3 and
Table 4). The difference between groups is evident in
the box plots in Figure 6.
Participants feedback reflects the results of the
study, commenting that the tool could be ”very use-
ful for exploratory analysis”, that ”exploroBOT was
a good, useful tool” and that ”it was straightforward
to use as the graphs were automated”. Other parti-
cipants suggested that it ”was easy to use and that it
shows you data with a particular combination which
you haven’t thought of, which is good”. However,
participants also found the inability to select required
variables directly as frustrating when asked to com-
plete a goal-directed task. It is important to note that if
the tasks were more explorative this frustration would
be less prominent.
Table 4: Results of Statistical Tests for the Accuracy.
exploroBOT
Tableau p-value
Test p-values range
Shapiro-Wilk 0.0014 0.049 both <0.05
Lavene’s Test 0.2 >0.05
Welch Anova 0.0016 <0.05
Kruskal-Wallis 0.003 <0.05
Wilkoxon 0.003 <0.05
Figure 6: Boxplots of Accuracy and Time test results for
exploroBOT and Tableau.
6 DISCUSSION AND FUTURE
WORK
Compared to VisExemplar and VisRec which recom-
mend visualizations learned from user preferences,
exploroBOT is an exploration system which does not
recommend a specific chart but enables the user to
find (obtain) desired charts quickly and efficiently.
Like VizRec, exploroBOT uses data’s statistical pro-
perties to indicate (when required) the interesting
charts but allows the user to see such charts in the
context of an exploratory path, along with easy choi-
ces to finding other or same type of charts.
Although we showed that exploring visualizations
based on the notion of “interestingness” can result in
rapid and accurate results on a specific set of tasks
using a specific dataset, the participants found that
exploroBOT may be frustrating to use. Here, we only
focused on task time and accuracy and did not account
for recall.
There is clearly a benefit to the approach, but furt-
her work is required. Firstly, there is scope to better
understand how feature selection can be improved or
supported beyond ”interestingness”. Possibly, inclu-
ding a reversed “Show Me” feature (in Tableau, sug-
gesting visualizations for selected dimensions) here,
appropriate features can be suggested based on the
selected design, reducing the number of features to
those suitable. Secondly, the act of creating a chart
could benefit from further investigation (new chart ty-
pes, adjustable histograms, graphs, also new visual fe-
atures – colors, transparency, glyph-size adjustment).
ExploroBOT: Rapid Exploration with Chart Automation
231

7 SUMMARY
In this paper, we described exploroBOT, a novel sy-
stem developed to support rapid exploration using a
combination of automatic chart generation and intui-
tive navigation.
expoloroBOT enables quick data exploration
using automatic charts and a user-driven decision path
based on the “browsing exploration metaphor” sup-
ported by a novel visual guidance framework. This
allows a fast retrieval of the sought type of chart with
minimal effort in chart design.
Through an evaluation experiment, we found that
exploroBOT enabled swift and accurate data explo-
ration. Considering these results, we reflect on our
approach and suggested several directions for future
work. A video demonstration of exploroBOT is avai-
lable on YouTube: https://youtu.be/C4iPvRvwUEA.
ACKNOWLEDGEMENTS
This work is funded by the Centre for Applied Data
Analytics Research (CeADAR) and co-funded by En-
terprise Ireland (EI) and the International Develop-
ment Agency (IDA) in Ireland.
REFERENCES
Amar, R., Eagan, J., and Stasko, J. (2005). Low-level com-
ponents of analytic activity in information visualiza-
tion. In Proceedings - IEEE Symposium on Informa-
tion Visualization, INFO VIS, pages 111–117.
Bouali, F., Guettala, A., and Venturini, G. (2016). VizAs-
sist: an interactive user assistant for visual data mi-
ning. Visual Computer, 32(11):1447–1463.
Gotz, D., When, Z., Lu, J., Kissa, P., Cao, N., Qian, W. H.,
Liu, S. X., and Zhou, M. X. (2010). HARVEST: An
Intelligent Visual Analytic Tool for the Masses. In
Proceedings of the first international workshop on In-
telligent visual interfaces for text analysis, pages 1–4.
Graham, W. and Wilkinson, L. (2010). Autovis: automatic
visualization. Information Visualization, 9(1):47–69.
Kim, Y., Wongsuphasawat, K., Hullman, J., and Heer, J.
(2017). GraphScape : A Model for Automated Reaso-
ning about Visualization Similarity and Sequencing.
In CHI 2017 Conference on Human Factors in Com-
puting Systems, pages 2628–2638, Denver, CO, USA.
ACM.
Levene, H. (1960). Robust tests for equality of variances. In
Ingram Olkin; Harold Hotelling; et, editor, Contribu-
tions to Probability and Statistics: Essays in Honor of
Harold Hotelling, chapter Robust tes, pages 278–292.
Stanford University Press.
Neuh
¨
auser, M. (2011). Wilcoxon-mann-whitney test. In In-
ternational encyclopedia of statistical science, pages
1656–1658. Springer Berlin Heidelberg.
Pak Chung, W., Cowley, W., Foote, H., Jurrus, E., and Tho-
mas, J. (2000). Visualizing sequential patterns for text
mining. In Information Visualization, 2000. InfoVis
2000. IEEE Symposium on, pages 105–111. IEEE.
Perry, D., Howe, B., Key, A. M. F., and Aragon, C. (2013).
VizDeck: Streamlining Exploratory Visual Analytics
of Scientific Data. In iConference 2013, pages 338–
350, Washington DC, USA.
Saket, B., Kim, H., Brown, E. T., and Endert, A. (2017).
Visualization by Demonstration: An Interaction Para-
digm for Visual Data Exploration. IEEE Transactions
on Visualization and Computer Graphics, 23(1):331–
340.
Salkind, N. J. (2007). Kruskal-Wallis Test. In Encyclopedia
of measurement and statistics. Thousand Oaks, CA:
SAGE Publications, vol.1 edition.
Scheibel, W., Trapp, M., and D
¨
ollner, J. (2016). Interactive
Revision Exploration using Small Multiples of Soft-
ware Maps. In 11th Joint Conference on Computer
Vision, Imaging and Computer Graphics Theory and
Applications IVAPP, volume 2, pages 131–138.
Shapiro, S. S. and Wilk, M. B. (1965). An analysis of va-
riance test for normality (complete samples). Biome-
trika, 52(3/4):591–611.
Shneiderman, B. (1996). The Eyes Have It : A Task by
Data Type Taxonomy for Information Visualizations.
In Visual Languages, 1996. Proceedings., IEEE Sym-
posium on, pages 336–343.
Stolper, C. D., Perer, A., and Gotz, D. (2014). Progres-
sive visual analytics: User-driven visual exploration
of in-progress analytics. IEEE Transactions on Visua-
lization and Computer Graphics, 20(12):1653–1662.
Unwin, A., Theus, M., and Hofmann, H. (2006). Graphics
of large datasets: visualizing a million. Springer
Science & Business Media.
Vartak, M., Huang, S., Siddiqui, T., Madden, S., and Para-
meswaran, A. (2015a). Towards Visualization Recom-
mendation Systems. In Workshop on Data Systems for
Interactive Analytics (DSIA).
Vartak, M., Madden, S., Parameswaran, A., and Polyzotis,
N. (2015b). SEEDB : Supporting Visual Analytics
with Data-Driven Recommendations. In VLDB.
Welch, B. L. (1951). On the Comparison of Several
Mean Values: An Alternative Approach. Biometrika,
38:330–336.
Wongsuphasawat, K., Moritz, D., Anand, A., Mackinlay,
J., Howe, B., and Heer, J. (2016). Voyager: Explora-
tory Analysis via Faceted Browsing of Visualization
Recommendations. In IEEE Transactions on Visuali-
zation and Computer Graphics, volume 1, pages 1–1.
IEEE.
Yalc¸n, M. A., Park, C., and Bederson, B. B. (2016). Cogni-
tive Stages in Visual Data Exploration. In BELIV ’16,
October 24 2016, Baltimore, MD, USA. ACM.
IVAPP 2019 - 10th International Conference on Information Visualization Theory and Applications
232
