
Noise Attenuation using Genetic Algorithm in CT Image
A. A. Saraiva
1 a
, M. S. de Oliveira
2 b
, J. V. M. Sousa
1 c
, N. M. Fonseca Ferreira
4 d
,
Antonio Valente
3,5 e
and Salviano Soares
3 f
1
State University of Piaui, Piripiri, Piaui, Brazil
2
University of S
˜
ao Paulo, Ribeir
˜
ao Preto, S
˜
ao Paulo, Brazil
3
UTAD University, Vila Real, Portugal
4
Institute of Engineering of Coimbra / Polytechnic Institute of Coimbra, Portugal. Knowledge Engineering and
Decision-Support Research Center (GECAD) of the Institute of Engineering, Polytechnic Institute of Porto
INESC Technology and Science (INESC TEC), Porto, Portugal
5
INESC Technology and Science (INESC TEC), Porto, Portugal,
School of Science and Technology, UTAD University, Vila Real, Portugal
Keywords:
Medical Images, Genetic Algorithm, Noise Removal.
Abstract:
The techniques of image filtering have undergone an explosive growth in the last years to make new advances
and challenges. This is due to the fact, among several other reasons, the increase of the volume of images
coming from several sources. Digital images have been used for a variety of purposes, from the storage
of souvenirs to accurate medical exams. However, Images may be corrupted due to several factors. The
challenge of suppression or noise attenuation has led to the search for improved techniques in order to preserve
important characteristics of the image, but, on the other hand, there is no solution available to completely solve
the problem, boosting the production of the work proposed here. In this paper proposes a method for noise
attenuation in computed tomography images using a hybrid genetic algorithm, the proposed method seeks to
optimize the results in the space of solutions composed by a series of techniques of noise filtering. At the
end the proposed method is compared statistically with two other competing methods and after the resulting
filtered images are shown.
1 INTRODUCTION
The techniques of image filtering have undergone an
explosive growth in the last years to make new ad-
vances and challenges. This is due to the fact, among
several other reasons, the increase of the volume of
images coming from several sources. Digital images
have been used for a variety of purposes, from the
storage of souvenirs to accurate medical exams. How-
ever, Images may be corrupted due to several factors.
The challenge of suppression or noise attenuation
has led to the search for improved techniques, with the
objective of preserving important characteristics of
the image, improving visual perception in medicine,
a
https://orcid.org/0000-0002-3960-697X
b
https://orcid.org/0000-0003-2389-3334
c
https://orcid.org/0000-0002-5164-360X
d
https://orcid.org/0000-0002-2204-6339
e
https://orcid.org/0000-0002-5798-1298
f
https://orcid.org/0000-0001-5862-5706
for example, to increase the clarity of anatomical
structures present in DICOM images (
¨
Ozmen and
¨
Ozs¸en, 2018; Kiragu et al., 2017a; Zhang et al., 2017;
Baselice et al., 2017a), reconstruction (Barca et al.,
2017) and detection of alcohol (Kubicek et al., 2018).
However, there is no solution available to completely
solve the problem, thus motivating the search for im-
provements in existing methods, and in particular,
boosting the production of the work proposed here.
In the literature there are techniques based on meta
heuristics, as is the example of the technique de-
scribed in (Saraiva et al., 2018), where the authors
demonstrate a bioinspired hybrid method formed by a
set of filters for noise attenuation in medical images.
The filtering methods by means of wavelets are
also widely used (Khmag et al., 2016; Jain and Tyagi,
2016; Broughton and Bryan, 2018), in addition to
several other methods proposed for the solution of
the noise attenuation problem (Zafari et al., 2017;
Fajardo-Delgado et al., 2016; Liu, 2015; Khmag
140
Saraiva, A., S. de Oliveira, M., Sousa, J., Ferreira, N., Valente, A. and Soares, S.
Noise Attenuation using Genetic Algorithm in CT Image.
DOI: 10.5220/0007346301400148
In Proceedings of the 12th International Joint Conference on Biomedical Engineering Systems and Technologies (BIOSTEC 2019), pages 140-148
ISBN: 978-989-758-353-7
Copyright
c
2019 by SCITEPRESS – Science and Technology Publications, Lda. All rights reserved

et al., 2017;
¨
Ozmen and
¨
Ozs¸en, 2017; Dimililer et al.,
2017; Kiragu et al., 2017b).
In the technique demonstrated in (Baselice et al.,
2017b), the authors explore a method of noise reduc-
tion in magnetic resonance imaging based on the ran-
dom markov field (RMF), next to it is proposed the
maximum a posteriori estimator (MAP) to regularize
the 3D amplitude MRI acquisition stacks.
The peculiarity of the method is the definition of
a local Gaussian random 3D markov field capable of
adapting to local image behavior considering a map
of hyperparameters that describe the correlation be-
tween each pixel and its neighborhood, thus allowing
adjustment of filter intensity, preserving smooth ar-
eas, edges and small details in an unsupervised man-
ner.
In addition to the previously mentioned method,
an innovative technique is demonstrated in (Badretale
et al., 2017), the technique, according to the authors,
learns directly from an end-to-end mapping of the im-
ages in a deep convolutional neural network, in this
way, when learning a series of high and low level re-
sources of a data set with images, the proposed al-
gorithm shows itself capable of creating high quality
filtered images.
In this paper, a hybrid genetic algorithm is ap-
plied for gaussian noise attenuation in computerized
tomography medical image and compared with two
other methods in the literature through the use of eval-
uation metrics MSE (Talbi et al., 2015), PSNR (Fe-
dorov and Rodyhin, 2016) and SSIM (Hore and Ziou,
2010).
The GA was chosen because of its ability to
perform well in large optimization problems where
search space is unknown. In addition, the filter opti-
mization problems have been solved successfully us-
ing this technique (Momeni et al., 2017; Mahani et al.,
2017; de Paiva et al., 2016; Uzun and Akg
¨
un, 2016).
The proposed method combines the genetic meta-
heuristic algorithm with several filtering techniques
available in the literature to solve the attenuation
problem with the objective of producing high qual-
ity results through the search for possible solutions to
improve the results generated.
The hypothesis of the work , is that the proposed
model is able to present satisfactory results when
compared to other methods present in the literature
in several test cases.
Thus, in the next section, the methodology is ex-
plained. Results and discussion of results are pre-
sented in sections 3 and 4, respectively, and section
5 presents the conclusion.
2 GENETIC ALGORITHM
Genetic algorithms are the computational models
family inspired by the theory of evolution of the
species described by Charles Darwin (Goldberg,
1989). This technique is formed by algorithms in-
spired by the mechanisms of natural evolution and ge-
netic recombination, in this way it provides an adap-
tive search method that is based on the principle of
reproduction and survival of the fittest.
These algorithms use a population of potential
solutions, each one codified, according to a spe-
cific problem, into a chromosome-like data structure.
These structures envolving using genetic operators
where preservation and improvement of critical infor-
mation are promoted.
According to (Santos, 2015), in Darwin’s theory
the selection principle privileges the fittest individuals
with greater longevity, and therefore, they are more
likely to reproduce. Individuals with more offspring
are more likely to perpetuate their genetic informa-
tion in subsequent generations. These genetic infor-
mation store the identity of each individual and are
represented by chromosomes. Thus, these principles
are taken into account for the construction of algo-
rithms capable of finding the optimal solution for a
given problem through the evolution of populations
of solutions encoded through artificial chromosomes.
Represented as a chromosome, each potential so-
lution is subjected to an evolutionary process involv-
ing several steps, known as selection, crossover (sex-
ual recombination) and mutation.
At the end, after performing several a evolution
cycle (iterations or generations), the fittest individuals
are retained and the worst are excluded.The classical
GA is exemplified by algorithm 1 and described some
steps are below.
Algorithm 1: Genetic Algorithm Classic.
1: generation ← 0;
2: Generate random initial population;
3: Calculate the fitness of individuals in the popula-
tion;
4: while generation < generationMax do
5: Select eligible parents;
6: Perform crossover between selected parents;
7: Apply mutation on the children generated;
8: Calculate children’s fitness;
9: Replace all/some parent individuals in the
current population with children;
10: generation ← generation + 1
11: end while
• Generate Population: (Line 2) Step where n in-
Noise Attenuation using Genetic Algorithm in CT Image
141

dividuals are generated randomly, in this step each
generated individual represent a potential solution
of the problem and have their chromosomes en-
coded as binary string.
• Evaluation: (Line 3 and 8) The evaluation of the
individual is generally determined by evaluating
an objective function that represents the problem
and aims to generate a measure of fitness of each
individual in the current population that guide the
search process.
• Selection: The main forms of parent selection are
the selection by ranking, tournament and roulette
(De Jong, 2012) and take into account the fitness
of each individual for its execution. These meth-
ods are described in sequel.
– Roulette: In the roulette selection method, ex-
emplified in Fig 1, all individuals in the popu-
lation have a probability of being selected for
reproduction. For that each individual is rep-
resented in roulette proportionally to its fitness
value, then, for each individual to select, the
roulette wheel is rotated and the chosen indi-
vidual is the one whose roulette area is pointed
by the roulette needle.
Figure 1: Roulette selection method.
– Tournament: In the tournament method, a
number n of individuals is chosen in a random
fashion, and the one that gets the best fitness
among them will be chosen. This process will
be repeated until the required amount of parents
is reached.
– Ranking: The ranking method behaves differ-
ently, all individuals are ranked, the worst will
be assigned to rank 1, the second worst will be
assigned to rank 2 and the better will be in the
maximum rank. The probability selection of an
individual is given by its rank over the sum of
all ranks.
• Crossover: The crossover (mutation) operator
(item below) plays a fundamental role in a GA,
through which it is possible for the population to
diversify and maintain adaptation characteristics
through generations.
Considered the predominant operator, the
crossover is responsible for the creation of new
individuals by the blending of characteristics
of the parent individuals by digitally simulating
the natural process of gene blending (Eiben
et al., 2003). Some popular crossover types are:
1-point crossover, n-point crossover, and uniform
crossover (Santos, 2015).
Exemplified by the Fig 2, the 1-point crossing is
the method where a point is randomly determined
and from this point of division of the characteris-
tics of the parents, then a child is formed by the
initial part of the first parent and by the final part
of the second parent. The other child is formed by
the remaining material of the previous combina-
tion.
Figure 2: 1 point crossing method example.
The n-point crossover works somewhat like the
one illustrated above, but in this case instead of
just choosing a split point, n points are selected for
crossing and parenting. On the other hand in the
uniform crossover the individual child has each
element with 50% chance of belonging to the first
or second parent.
• Mutation: The mutation operation simply ran-
domly modifies a characteristic of the chromo-
some in which it is being applied, this step is im-
portant to create new values of features previously
non-existent or even that arise in low quantity
(Eiben et al., 2003). As in the crossing step, the
mutation occurs proportionally at a given proba-
bility rate. Fig 3 exemplifies the use of the muta-
tion.
Figure 3: Example of mutations.
In this step it is also possible to use more than one
operator, such as the Gaussian mutation operator, the
technique that draws a new value for the characteristic
from a Gaussian distribution N (µ, σ) with average µ
and standard deviation σ and the operator mutation
uniform.
BIODEVICES 2019 - 12th International Conference on Biomedical Electronics and Devices
142

3 METRIC METHODS OF
EVALUATION
The image filtering search aims to reduce the number
of artifacts to represent an image, removing the noise,
as much as possible. The ideal is to get the resulting
image as close as to the original image. One of the
ways to quantify the filtering is given by the proxim-
ity measurement using the Mean Square Error (MSE)
(Talbi et al., 2015) which can be defined mathemati-
cally by:
MSE =
1
mn
m−1
∑
x=0
n−1
∑
y=0
(I(x, y) − K(x, y))
2
(1)
In this equation I represents the original image and
K the final image to be compared. The x and y are two
matrices of size MxN, respectively representing the
original x-channel and the y-channel to be compared
(after filtering).
Another way to compare the quality of the im-
ages is the Peak Signal to Noise Ratio (PSNR) what is
usually a measure of image quality and can be repre-
sented by equation (2) (Fedorov and Rodyhin, 2016).
The PSNR ideal of comparison presents an optimum
value the higher its is your value.
PSNR = 10log
MAX
2
MSE
= 20 log
MAX
MSE
1
2
(2)
In which, MAX represents the maximum possible
value of the pixel in the image and MSE is the value
resulting from equation (1).
The main from them is that large distances be-
tween pixel intensities do not necessarily mean that
the content of the images be dramatically different.
It is important to note that a value of 0 for MSE indi-
cates perfect similarity. A value greater than 1 implies
smaller similarity and will continue to grow as the
mean difference between pixel intensities increases as
well.
In order to remedy some of the problems asso-
ciated with MSE for image comparison, one has the
Structural Similarity Index (SSIM). The SSIM is ob-
served by equation (3) (Tiwari et al., 2015).
SSIM(x, y) =
(2µ
x
µ
y
+ c
1
)(σ
xy
+ c
1
)
(µ
2
x
+ µ
2
y
+ c
1
)(σ
2
x
+ σ
2
y
+ c
2
)
(3)
In the equation (3) µ represents the mean, σ sym-
bolizes the standard deviation and σ
xy
the covariance.
And c
1
with c
2
represent constants that avoid the in-
stability of values.
Unlike MSE, the SSIM value can range from -1 to
1, where 1 indicates perfect likeness.
The essence of SSIM is to model the perceived
change in the structural information of the image,
while the MSE is actually estimating the perceived
errors. There is a subtle difference between the two,
but the results can be great.
In addition, the SSIM is used to analyze small sub-
samples instead of the entire image as in MSE. The
parameters used are the mean of the pixel intensities,
the variance of the intensities, together with the co-
variance. In this way, a more robust approach is ob-
tained capable of explaining the changes in the struc-
ture of the image, instead of just the perceived change.
For the quantitative comparison of the filtering
methods in this article, the objective metrics evalua-
tion methods MSE, PSNR and SSIM were used. Such
methods are known as full reference, because they
consider the original image as a reference.
4 METHODOLOGY
The proposed genetic algorithm (GAP) in this work is
based on the technique developed in (de Paiva et al.,
2016), where each individual of the population is a
two-dimensional image, however, as a contribution,
in the algorithm proposed here, the idea was recon-
structed and modified so that It is possible to perform
filtering on a set of DICOM images automatically.
In choosing the size of the tournament, Paiva
found that the worst case of the tournament size 3
tends to be better than the worst of the others. How-
ever, testing the different local search rates, although
all the results were very close, the value ratio of 0.6
was the one that obtained the best results in compar-
ison to the others. Furthermore, a superiority in the
results with the beta 1.5 parameters and the popula-
tion size is demonstrated.
In this sense, based on the analysis and the results
demonstrated by the author, the proposed parameters
were used here as proposed values due to the demon-
stration of the effectiveness of each change.
The proposed method has its beginning when a se-
ries of noisy DICOM images are used as input to the
method and the other individuals of the population are
created from applied mutation operators. In algorithm
2, the pseudocode of the algorithm is shown and its
steps are described.
The beginning of the GAP consists of creating the
initial population in two steps: first, the noise image
is used as input for three noise smoothing methods
below, thus, at the end of the first stage, the population
has three individuals.
• 3D median filter (Jiang and Crookes, 2006)
• BM4D (Maggioni et al., 2013)
Noise Attenuation using Genetic Algorithm in CT Image
143

• Ellipsoid (Yang et al., 2008)
After the first stage, one of the outputs of these
techniques is chosen randomly. It is then subjected
to a mutation operator also selected at random so that
quality changes are made to the previously generated
output. As mutation operators, three types were used:
• Gaussian filter: the filter that has the effect of
smoothing the image artifact through a Gaussian
function.
• Average filter: the technique that allows the
smoothing of noises in images by means of cal-
culating the average of all the filters of a given
vicinity for each pixel of the original image.
• Intensity change: is a linear operation that con-
sists of multiplying all the pixels of the image by
the same numerical factor.
At the end of this stage, the resulting image is
added to the existing population, then the mutation
process is repeated until the population reaches the
stipulated size, thus forming a hybrid population,
formed by the output of the three methods of suppres-
Algorithm 2: Genetic Algorithm Proposed (GAP).
1: function GAP(DicomPath)
2: images ←ReadAllFiles(DicomPath)
3: Population ←createPopulation(images)
4: best ←Population.best
5: while elapsedTime < maxTime do
6: cont ← 0
7: while cont < maxIter do
8: IntermPop ← Population
9: for i ← 1 to Population.size do
10: ind1, ind2 ←Parents(Population)
11: ind3 ←Crossover(ind1,ind2)
12: if (Λ ∈ [0, 1]) ≤LocalSearchRate
then
13: localSearch(ind3)
14: end if
15: IntermPop.append(ind3)
16: end for
17: Sort(IntermPop)
18: Population ←IntermPop[1..Popula-
19: -tion.size]
20: if (best =Population.best) then
21: cont ← cont + 1
22: else
23: cont ← 0
24: end if
25: end while
26: end while
27: end function
sion of the initial noise plus the images which have
gone through the process of mutation.
The GAP runs for a fixed time, in which the popu-
lation continues to evolve, while there are no changes
in the best individual for a maximum number of inter-
actions, step at which the entire population is restarted
while only the best individual is preserved.
An intermediate population twice the initial pop-
ulation is created during the process of evolution
formed by the current population, plus the new in-
dividuals generated. These new individuals are cre-
ated through crossover operators, where parent selec-
tion is done through the tournament method. Soon
after the parent’s choice, a new crossover operator is
selected randomly for the generation of a new indi-
vidual (child). For this the following three types are
available for selection:
• Uniform Operator: Each pixel of the image is
chosen randomly from one of the parents with
50% chance of the value chosen to be from either
parent.
• Operator of a Line Point: Randomly choose a
line of pixels in the image, then all the pixels
above it will come from one parent and the other
pixels that are below it will come from the other
parent.
• Operator of a Column Point: Approach similar
to the first, but the image is divided by a column
rather than a line.
Once created, the new individual can still be sub-
mitted by a local search operator, a process whose
purpose is to improve the final quality of the solu-
tion by means of transformations in the individual, in
this step, if the condition is satisfied that a real value
randomly selected within the range of 0 to 1 in the al-
gorithm is less than the local search rate chosen by the
user, it will pass through one of the artifact suppres-
sion operators already mentioned in the initial step:
BM4D, 3D Median Filter or 3D Ellipsoid Filter.
With the entire intermediate population com-
pleted, individuals are sorted according to fitness, so
the first individuals are selected to form the GAP pop-
ulation for the next stage of evolution, where the al-
gorithm checks if there are no changes in the best in-
dividual of the population during defined number of
evolutionary executions. If the best individual does
not change after a maximum number of iterations, that
population is restarted. A flowchart of the algorithm
execution is shown in Fig 4.
BIODEVICES 2019 - 12th International Conference on Biomedical Electronics and Devices
144
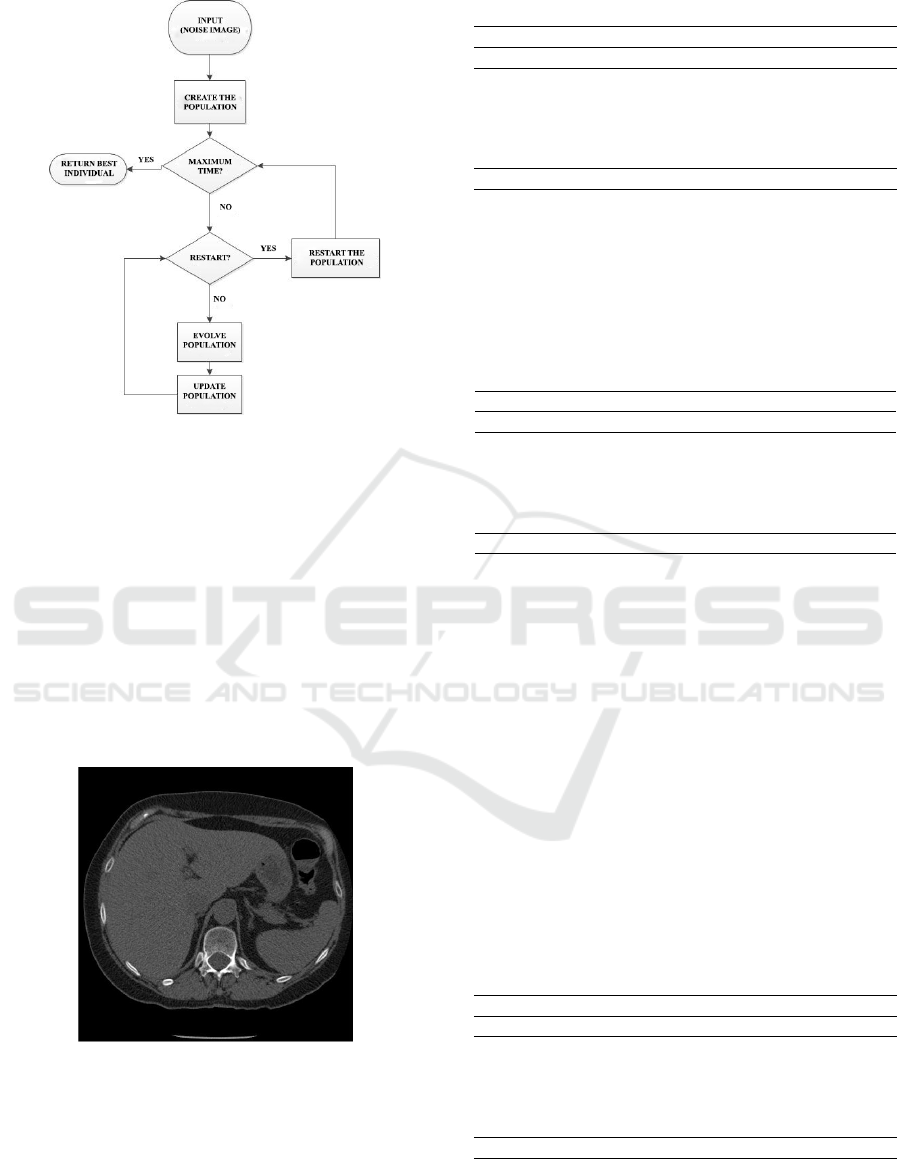
Figure 4: Flowchart of the algorithm execution.
5 EXPERIMENTAL RESULTS
In this chapter, the results of the statistical analysis
will be presented through the evaluation metrics. The
established comparison is related to two other meth-
ods of filtering medical images previously mentioned.
These methods are applied to a computerized to-
mography DICOM image available in the Repository
The Cancer Imaging Archive (TCIA) (Clark et al.,
2013). One of the images in the chosen DICOM is
shown in the figure 5.
Figure 5: DICOM image initial.
Table 1 refers to the amount of MSE for each im-
age after the filtering, establishing values. In the col-
umn 1 shows the percentage of image degradation, in
column 2 the noise mean, and columns 3, 4 and 5 the
respective MSE values obtained for the filters of the
median 3d, ellipsoid and the GAP.
The first analysis was made by the MSE metric,
Table 1: Evaluation of the result through MSE.
Gaussian additive noise
Noise (MSE) Median Ellipsoid GAP
1% (161.44) 46.03 118.16 28.73
2% (517.49) 107.39 159.96 52.73
3% (887.77) 184.06 218.41 77.65
4% (1193.96) 275.49 292.24 101.79
5% (1448.74) 382.22 374.82 126.63
Average 199.03 232.71 77.50
presented in all cases the filter type GAP as better, tak-
ing into account that the best results are those whose
values are the smallest. On the other hand, the MSE
has the level of confidence that is contested, making
it necessary to compare with new forms.
Table 2: Evaluation of the result through PSNR.
Gaussian additive noise
Noise (PSNR) Median Ellipsoid GAP
1% (26.06) 31.53 27.42 33.56
2% (21.05) 27.84 26.10 30.88
3% (18.64) 25.45 24.69 29.25
4% (17.41) 23.73 23.54 28.10
5% (16.53) 22.33 22.36 27.00
Average 26.17 24.82 29.75
In the table 2 is shown an evaluation using a better
metric, this metric demonstrates in numerical data an
approximation of the human perception of the quality
of reconstruction, where not necessarily, but in most
cases the larger PSNR values represent a better recon-
struction of the image.
When comparing the resulting values demon-
strated below, it is clear the superiority of the data re-
sulting from the proposed method. With efficiency in
100% of the cases tested in this approach, it is shown
in the table that in only one case the value was similar
to the GA model. Then we notice the difference in
the values resulting from the methods being distant,
in addition, it is also remarkable that the difference
between the average of the GAP and the means of the
other methods were somewhat close.
Table 3: Evaluation of the result through SSIM.
Gaussian additive noise
Noise (SSIM) Median Ellipsoid GAP
1% (0.94) 0.96 0.95 0.96
2% (0.90) 0.94 0.93 0.95
3% (0.89) 0.92 0.92 0.94
4% (0.88) 0.91 0.91 0.93
5% (0.87) 0.91 0.90 0.93
Average 0.92 0.92 0.94
Table 3 presents the analysis results using the most
accurate evaluative metric currently used, SSIM. This
metric improves traditional methods, that show incon-
Noise Attenuation using Genetic Algorithm in CT Image
145
sistent with human visual perception.
The results presented in the tables prove that the
combined method of various artifact removal tech-
niques is very favorable in most images, in addition,
the few limitations of the GAP provide a multitude of
options to change parameters and provide improve-
ments in results.
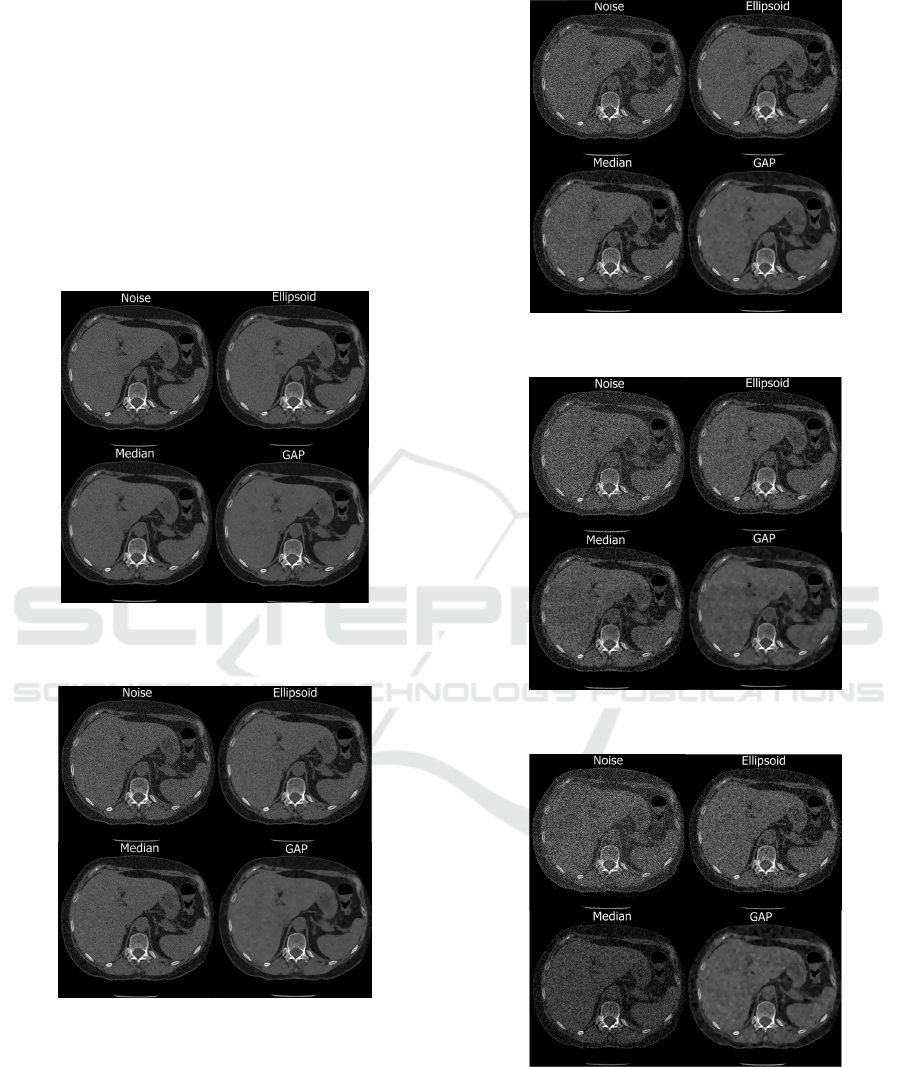
As a visual example of the obtained results, it is
shown in figures 6, 7, 8, 9 and 10. In each figure,
four images are observed, one referring to the slice
added with noise and another three are results of the
ellipsoid, median and GAP filtering.
Figure 6: Image corrupted with standard deviation = 1%
and filtering results.
Figure 7: Image corrupted with standard deviation = 2%
and filtering results.
In Fig 6 , the image was corrupted with gaussian
artifact and a standard deviation of 1%. In the other
figures (3-6) differ in the standard deviation of 2%,
3% , 4% and 5% respectively.
In Fig 6 it was observed that when applying the
noise with low deviation, 1%, the difference of the
GAP in relation to the others was already visually per-
ceptible. In addition, in the figures 7, 8, 9 and 10 the
Figure 8: Image corrupted with standard deviation = 3%
and filtering results.
Figure 9: Image corrupted with standard deviation = 4%
and filtering results.
Figure 10: Image corrupted with standard deviation = 5%
and filtering results.
difference between the proposed filter and the other
two filters that serve as the basis for the quality check.
In the figures 9, 10 it was observed that when ap-
plying high noise it was visually perceptible that the
GAP was able to recover good information from the
BIODEVICES 2019 - 12th International Conference on Biomedical Electronics and Devices
146

badly corrupted images if it excelled in relation to the
other competitors.
6 DISCUSSION
With the introduction of the filter it is evident that
there is an improvement of resolution in both images,
making them more interesting for the observation of
the image.
In Table 1, it was observed that in all items the
method demonstrated the most efficient filtration con-
dition and presented significant results in the percent-
age of degradation of DICOM images. However,
MSE may exhibit similarity failures.
Thus, the efficiency of the GAP method is demon-
strated when compared to the others exposed in tables
2 and 3, using PSNR and SSIM. Demonstrating the
final image after filtering that most closely resembles
the original image and provides an increase in quality.
7 CONCLUSION
There are several techniques for developing DICOM
image filtering, this study applies a hybrid method us-
ing a genetic algorithm, in which the method obtains
optimal filtering and minimizes artifacts.
The efficiency of the model adopted as a filter is
the result of the architecture that is distributed in a
selective and evolutionary way in two stages. The first
stage consists of the BM4D filtering, the 3d medium
filter and the ellipsoid filter.
The second stage is formed by the application of
operators of simple mutations in the previously recov-
ered image, for that was used: change of intensity,
gaussian filter and average filter.
As a comparison, the MSE, PSNR and SSIM were
used to estimate the filtering efficiency of the re-
stored images. It was observed experimentally that
the adopted filter is efficient and robust presenting
better indexes than the others in PSNR and SSIM.
With the study of the GAP can generate more ad-
vances and minimize the artifacts, resulting in a better
performance in the system. The disadvantage is the
limitations of techniques for random values, which
hamper the ideal value set in the filtering.
In order to apply more efficient methods of recon-
structing DICOM images, it is intended in future work
to approach methods with the application of new fil-
ters to increase efficiency. As an example, we have
artificial intelligence in one of the stages.
ACKNOWLEDGMENT
This work is financed by the National Funds through
the FCT - Fundac¸
˜
ao para a Ci
ˆ
encia e a Tecnologia
(Portuguese Foundation for Science and Technology)
as part of project UID/EEA/00760/2019.
REFERENCES
Badretale, S., Shaker, F., Babyn, P., and Alirezaie, J. (2017).
Fully convolutional architecture for low-dose ct image
noise reduction. In IOP Conference Series: Materials
Science and Engineering, volume 261, page 012012.
IOP Publishing.
Barca, P., Giannelli, M., Fantacci, M. E., and Caramella,
D. (2017). Evaluation of the imaging properties of
a ct scanner with the adaptive statistical iterative re-
construction algorithm. In Proceedings of the 10th In-
ternational Joint Conference on Biomedical Engineer-
ing Systems and Technologies - Volume 1: BIODE-
VICES, (BIOSTEC 2017), pages 200–206. INSTICC,
SciTePress.
Baselice, F., Ferraioli, G., and Pascazio, V. (2017a). A
3d mri denoising algorithm based on bayesian theory.
Biomedical engineering online, 16(1):25.
Baselice, F., Ferraioli, G., and Pascazio, V. (2017b). A
3d mri denoising algorithm based on bayesian theory.
Biomedical engineering online, 16(1):25.
Broughton, S. A. and Bryan, K. (2018). Discrete Fourier
analysis and wavelets: applications to signal and im-
age processing. John Wiley & Sons.
Clark, K., Vendt, B., Smith, K., Freymann, J., Kirby, J.,
Koppel, P., Moore, S., Phillips, S., Maffitt, D., Pringle,
M., et al. (2013). The cancer imaging archive (tcia):
maintaining and operating a public information repos-
itory. Journal of digital imaging, 26(6):1045–1057.
De Jong, K. (2012). Evolutionary computation: a unified
approach. In Proceedings of the 14th annual confer-
ence companion on Genetic and evolutionary compu-
tation, pages 737–750. ACM.
de Paiva, J. L., Toledo, C. F., and Pedrini, H. (2016). An
approach based on hybrid genetic algorithm applied
to image denoising problem. Applied Soft Computing,
46:778–791.
Dimililer, K., UGUR, B., and Yoney, K. (2017). Tumor
detection on ct lung images using image enhancement.
In International Science and Technology Conference
(ISTEC 2016).
Eiben, A. E., Smith, J. E., et al. (2003). Introduction to
evolutionary computing, volume 53. Springer.
Fajardo-Delgado, D., S
´
anchez, M. G., Molinar-Solis, J. E.,
Fernandez-Zepeda, J. A., Vidal, V., and Verdi
´
u, G.
(2016). A hybrid genetic algorithm for color image
denoising. In Evolutionary Computation (CEC), 2016
IEEE Congress on, pages 3879–3886. IEEE.
Fedorov, O. and Rodyhin, M. (2016). A referenceless psnr
estimator of compressed jpeg images. In Radioelek-
Noise Attenuation using Genetic Algorithm in CT Image
147

tronika (RADIOELEKTRONIKA), 2016 26th Interna-
tional Conference, pages 227–230. IEEE.
Goldberg, D. (1989). Genetic algorithms in optimization,
search and machine learning. Reading: Addison-
Wesley.
Hore, A. and Ziou, D. (2010). Image quality metrics: Psnr
vs. ssim. In Pattern recognition (icpr), 2010 20th in-
ternational conference on, pages 2366–2369. IEEE.
Jain, P. and Tyagi, V. (2016). A survey of edge-preserving
image denoising methods. Information Systems Fron-
tiers, 18(1):159–170.
Jiang, M. and Crookes, D. (2006). High-performance 3d
median filter architecture for medical image despeck-
ling. Electronics Letters, 42(24):1379–1380.
Khmag, A., Ramli, A. R., Al-haddad, S., Yusoff, S., and
Kamarudin, N. (2017). Denoising of natural images
through robust wavelet thresholding and genetic pro-
gramming. The Visual Computer, 33(9):1141–1154.
Khmag, A., Ramli, A. R., bin Hashim, S. J., and Al-Haddad,
S. A. R. (2016). Additive noise reduction in natu-
ral images using second-generation wavelet transform
hidden markov models. IEEJ Transactions on Electri-
cal and Electronic Engineering, 11(3):339–347.
Kiragu, H., Mwangi, E., and Kamucha, G. (2017a). A hy-
brid mri method based on denoised compressive sam-
pling and detection of dominant coefficients. In Digi-
tal Signal Processing (DSP), 2017 22nd International
Conference on, pages 1–5. IEEE.
Kiragu, H., Mwangi, E., and Kamucha, G. (2017b). A hy-
brid mri method based on denoised compressive sam-
pling and detection of dominant coefficients. In Digi-
tal Signal Processing (DSP), 2017 22nd International
Conference on, pages 1–5. IEEE.
Kubicek, J., Faure-Brac, B., Penhaker, M., Scurek, R.,
Cerny, M., Augustynek, M., and Oczka, D. (2018).
Modeling of blood alcohol content using multire-
gional segmentation from ir images. In Proceedings
of the 11th International Joint Conference on Biomed-
ical Engineering Systems and Technologies - Volume
1: BIODEVICES, (BIOSTEC 2018), pages 39–47. IN-
STICC, SciTePress.
Liu, Y. (2015). Image denoising method based on thresh-
old, wavelet transform and genetic algorithm. Interna-
tional Journal of Signal Processing, Image Processing
and Pattern Recognition, 8(2):29–40.
Maggioni, M., Katkovnik, V., Egiazarian, K., and Foi, A.
(2013). Nonlocal transform-domain filter for volumet-
ric data denoising and reconstruction. IEEE transac-
tions on image processing, 22(1):119–133.
Mahani, F., Mahanipour, A., and Mokhtari, A. (2017). Op-
timization of plasmonic color filters for cmos image
sensors by genetic algorithm. In Swarm Intelligence
and Evolutionary Computation (CSIEC), 2017 2nd
Conference on, pages 12–15. IEEE.
Momeni, M., Nezhad, Z. H., and Moghaddam, M. E.
(2017). Embryonic image enhancement based on ge-
netic algorithm and generic filter. In Frontiers of Sig-
nal Processing (ICFSP), 2017 3rd International Con-
ference on, pages 141–145. IEEE.
¨
Ozmen, G. and
¨
Ozs¸en, S. (2017). A new denoising method
for fmri based on weighted three-dimensional wavelet
transform. Neural Computing and Applications, pages
1–14.
¨
Ozmen, G. and
¨
Ozs¸en, S. (2018). A new denoising
method for fmri based on weighted three-dimensional
wavelet transform. Neural Computing and Applica-
tions, 29(8):263–276.
Santos, A. I. S. A. d. (2015). Desenvolvimento de um algo-
ritmo h
´
ıbrido para o escalonamento de exames numa
cl
´
ınica. PhD thesis.
Saraiva, A. A., Ferreira, N. F., and Valente, A. (2018).
New bioinspired filter of dicom images. In Engineer-
ing Systems and Technologies (BIOSTEC 2018), 2018
11th International Joint Conference on Biomedical.
Talbi, M., Ftima, S. B., and Cherif, A. (2015). Image
watermarking using data compression. In Computer
Networks and Information Security (WSCNIS), 2015
World Symposium on, pages 1–9. IEEE.
Tiwari, V., Bansod, P., and Kumar, A. (2015). Medi-
cal imaging in heterogeneous telemedicine network.
In Information, Communications and Signal Process-
ing (ICICS), 2015 10th International Conference on,
pages 1–5. IEEE.
Uzun, S. and Akg
¨
un, D. (2016). An analysis of genetic
algorithm with training of image filter kernel matrix.
In Electrical, Electronics and Biomedical Engineer-
ing (ELECO), 2016 National Conference on, pages
142–146. IEEE.
Yang, F., Zuo, W., Wang, K., and Zhang, H. (2008). 3d
cardiac mri data visualization based on volume data
preprocessing and transfer function design. In Com-
puters in Cardiology, 2008, pages 717–720. IEEE.
Zafari, M., Ahmadi-Kandjani, S., and Kheradmand, R.
(2017). Noise reduction in selective computational
ghost imaging using genetic algorithm. Optics Com-
munications, 387:182–187.
Zhang, K., Zuo, W., Chen, Y., Meng, D., and Zhang, L.
(2017). Beyond a gaussian denoiser: Residual learn-
ing of deep cnn for image denoising. IEEE Transac-
tions on Image Processing, 26(7):3142–3155.
BIODEVICES 2019 - 12th International Conference on Biomedical Electronics and Devices
148
