
Effect of Frequency Level on Vibro-tactile Sound Detection
Abdikadirova Banu
1
, Praliyev Nurgeldy
1
and Xydas Evagoras
2
1
Department of Mechanical and Aerospace Engineering, Nazarbayev University, Astana, Kazakhstan
2
IREROBOT LTD, Nicosia, Cyprus
Keywords: Vibrotactile, Audio-tactile Integration, Touch.
Abstract: It has been shown that vibrotactile stimuli elicits sound perception either on their own or by enhancing
otherwise inaudible sounds. For taking advantage of this phenomenon in the design of vibrotactile displays it
is important to identify its properties with respect to the level of the excitation frequency. In this work, the
effect of frequency levels on the ability of humans to perceive vibrotactile stimuli as sounds at the index
fingertip is investigated. Eight subjects participated in the study which included comparison of sound and
vibration versus sound only signals. It is shown that as hypothesized, there is a range of frequency in which
the phenomenon under study seems to be most intense with maximum occurrence at 300 Hz.
1 INTRODUCTION
It has been established that integration of auditory and
vibrotactile signals activates a larger volume of the
auditory cortex than the auditory stimulus alone
(Auer et al., 2007). This hypothesis is also
demonstrated in monkeys by Kayser et al., (2015)
who tested integration of auditory broad-band noise
and tactile stimulus. By using fMRI (functional
Magnetic Resonance Imaging) they detected that
audio-tactile signal activated the posterior and lateral
side of the auditory cortex of the animal. Given the
continuous technological leaps in information and
communication technology, interest in studying
audio-tactile integration is increased and there are
several works which demonstrate that human
auditory cortex is activated through vibrotactile
excitation at the hand. Schürmann et al. (2004) have
established that audio-tactile stimulation activates the
auditory cortical area in normal hearing participants.
In the experiment, participants were asked to adjust
the sound intensity at the same level as fixed-intensity
vibration. With the presence of vibration, the
participants perceived a higher intensity than the
actual sound intensity, which satisfies the hypothesis
that under certain circumstances vibration facilitates
hearing. Further, by using whole-scalp
magnetoencephalography (MEG) and analysing
results, authors concluded that human auditory cortex
can be activated by feeling fixed intensity vibration
of 200-Hz at the fingertips. Also, Caetano et al.,
(2006) extended this study and demonstrated auditory
cortex activation by vibrotactile stimulation alone.
Both research experiments were conducted at fixed-
frequency of 200-Hz vibrations, without providing
level of frequency or location effects on this
phenomenon. In another work researchers studied the
perceptual integration of 50, 250, and 500-Hz
vibrotactile and auditory tones in a detection
experiment as a function of the relative phases of
sound and vibration pulses (Ranjbar et al., 2016). The
results did not establish significance regarding the
effect of phase difference in sound detection
performance. However, combination of 250-Hz and
phase difference resulted significantly high scores in
sound detection in contrast to other fixed-frequencies
(e.g. 50-Hz and 500-Hz). The work suggests that
auditory and vibrotactile signals can be effectively
integrated without regard to phase difference and fine
structure regulation. Also, it can be speculated that
audio-tactile integration is more notable in some
frequencies than in others. For effective design of
vibrotactile interfaces it is important to establish
further understanding of the range of frequencies in
which audio-tactile integration is stronger. The main
hypothesis of this work is that there is a specific range
of vibration frequencies in which audio-tactile
integration is most intense. When it comes to
sensitivity to vibrotactile stimuli, it is known that the
fingertips and hand have greater density and more
sensitive regions compared to the rest of the body and
are more appropriate for receiving tactile information
than other regions (Bensmaïa, 2005; Kaczmarek et
Banu, A., Nurgeldy, P. and Evagoras, X.
Effect of Frequency Level on Vibro-tactile Sound Detection.
DOI: 10.5220/0007347100970102
In Proceedings of the 14th International Joint Conference on Computer Vision, Imaging and Computer Graphics Theory and Applications (VISIGRAPP 2019), pages 97-102
ISBN: 978-989-758-354-4
Copyright
c
2019 by SCITEPRESS – Science and Technology Publications, Lda. All rights reserved
97
al., 1991). Tactile sensation can be caused by
mechanical vibration of the skin at frequency ranges
between 10 and 500-Hz (Johansson and Löfvenberg,
1984). When it comes to ability for frequency
discrimination in vibrotactile stimuli, Mahns et al.,
(2006) have shown that at the fingertips the
discriminative increment or Just Noticeable
Difference (JND) for frequencies of 20, 50, 100 and
200-Hz are 0.32 ± 0.07%, 0.19 ± 0.07%, 0.21 ± 0.03%
and 0.14 ± 0.04%, respectively. However, another
work suggests that JND is constant across frequencies
with a discriminate increment of 22 % (Johansson and
Löfvenberg, 1984). This information is employed in
experimental design in this work, namely for
choosing the set of test frequencies shown in Table 2.
More specifically, for lower frequencies, JND of 50,
100 and 200 Hz were used to choose the frequencies
(Johansson and Löfvenberg, 1984; Mahns et al.,
2016), while higher frequencies were incremented by
22 %. (Mahns et al., 2016).
Overall, the work is organized as follows: first a
methods section describes the group of participants,
equipment and experimental procedure. This is
followed by the results sections and finally a
discussion and conclusion sections elaborate on the
results and investigation in general.
2 METHODS
2.1 Participants
Eight young adults participated in the experiments.
Their age ranged between 19 and 21 years (mean
19.9, standard deviation 0.60). One of the persons
participated in a similar experiment before, but he had
no information regarding the primary aim of the
investigation or details of the study. All other
participants did not have any knowledge about the
topic of the study and were not involved in
vibrotactile experiments before. All of them signed an
informed consent and were compensated for
participation.
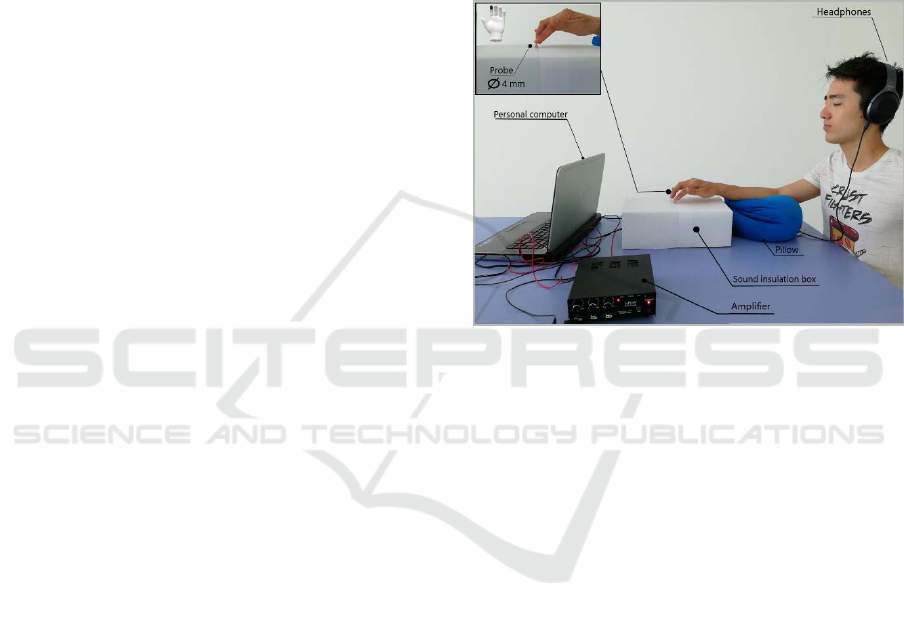
2.2 Experimental Setup
The vibrotactile testing apparatus consists of the
following equipment: 1. PC. 2. External sound card.
3. A pair of headphones with active ambient noise and
sound cancellation (Sony WH-1000XM2). These
include automatic performance optimization given
current environmental conditions. 4. A vibration
generator with a vibrating probe (Frederiksen
2185.00). 5. Amplifier (L-Frank Audio PAA30USB).
6. Custom-made sound insulation box. The vibration
generator was placed inside the insulation box with
only the vibrating probe protruding, so that sound
generated due to mechanical parts movement is
isolated to the maximum possible extent. A
cylindrical 4mm wooden interface with flat end is
inserted in the centertap as the probe endpoint (which
the user touches), so that it matches the dimensions
used in research which was conducted by Kayser et
al., (2005). The complete experimental setup is
presented in Figure 1.
Figure 1: Experimental setup.
MPU6050 Accelerometer and Arduino Software
are used to take sample acceleration measurements on
the forearm of the participant to make sure vibration
is not transferred through the body by conduction.
2.3 Experimental Procedure
At the beginning of the experiment, the participant
seated in a relaxed position with the headphones on
and the noise and ambient sound cancellation
activated. The participant had the headphones on,
throughout the duration of the experiment. The
experiment consisted out of three stages: 1. Vibration
intensity calibration. 2. Audio-tactile sensitivity test.
3. Control measurements. The third stage was
performed only by two participants mainly for testing
the sound shielding performance provided by the
headphones. All three stages were performed 13
times, one for each of the frequencies shown in Table
2. Furthermore, during each experiment, sample
sound and vibration frequency measurements were
performed to ensure that the correct signals are
delivered to the vibration generator. Also, sample
acceleration measurements were taken on the user’s
forearm to ensure that vibrations did not transfer to
the ears by conduction through the body.
HUCAPP 2019 - 3rd International Conference on Human Computer Interaction Theory and Applications
98

2.3.1 Vibration Intensity Measurement and
Calibration
The first stage of the procedure for each frequency
involves calibration of the vibration intensity. The
purpose is to achieve minimization of the audible
sound generated by the vibration generator, so that
only controlled sounds through the headphones are
delivered to the user. At this stage the user is not
touching the probe. Vibration signals are generated
and the user is asked to tap whenever he listens to a
tone. The vibration intensity is reduced after each
signal until the user does not respond to the tone. The
resulting sound intensity is used for the subsequent
stage of the study.
2.3.2 Audio-tactile Sensitivity Test
In the second part of the procedure, the participant
touched the probe with the index fingertip. The
participant was asked not to exert intense pressure on
the probe, rather just rest the centre of the fingertip on
the probe end. A pillow was placed under the
participant’s forearm to keep the wrist and arm
relaxed. Three types of sinusoidal signals were
generated at this stage. 1. Sound only (SO). 2. Sound
and vibration (SV). 3. Vibration only (VO).
Frequency steps were chosen by considering JND
suggested by literature as described in the
introduction.
In total, 25 tones were delivered to the user for
each of the test frequencies. 10 sound tones, 10 sound
and vibration tones (Sound through the headphones
and Vibration at the fingertip) and 5 vibration only
tones. All 25 tones were generated in a random order.
The amplitude of vibratory stimulation remained the
same in all 15 stimuli (5 vibration and 10 sound and
vibration). Auditory stimuli had 10 different
intensities and they contained both normally audible
and nonaudible tones which were calibrated based on
experiments with two young adults for each
frequency. As in the calibration stage, whenever the
user heard the tone, he tapped on the workbench. The
number of positive responses (taps) for each user in
each frequency are counted, then the median as well
as boxplots for all users in each frequency are
calculated. This is done for positive responses in
Sound only (SO) and Sound plus Vibration (SV)
signals. Also, a further criterion is considered for
testing the audio-tactile integration: If the user cannot
hear a specific sound intensity played on its own
(SO), but can hear it when it is combined with a
vibration (SV), then this is a valid case where it is
shown that vibration enhances hearing. All such cases
are counted and statistically analysed. This group of
results is termed SVS as it is a comparison between
Sound and Vibration versus Sound only. Vibration
only (VO) signals were generated for randomization
purposes of SV and SO signals. Providing a third
option (VO) alongside the signals that are under
investigation (SV and SO) reduces the possibility that
the user will become biased towards either SO or SV
signals. Only five VO signals are provided since
firstly this option does not presently involve any
investigation and secondly due to duration
limitations. They are not used in the analysis for the
test group. They are only considered in the analysis
when it comes to the control test.
As an example,
Table 1 illustrates sample results
of the experiment for one specific frequency, for a
specific participant. The last column of
Table 1 shows
the responses of users for vibration only stimuli.
Table 1: Sample results of specific participant.
Sound
loudness level
SVS
Test
result
VO
SV SO
1 Yes Yes Inconclusive No
2 Yes Yes Inconclusive No
3 Yes Yes Inconclusive No
4 Yes Yes Inconclusive Yes
5 Yes Yes Inconclusive No
6 Yes Yes Inconclusive
7 No No Inconclusive
8 Yes No Valid
9 No No Inconclusive
10 No No Inconclusive
2.3.3 Control Test
In contrast to sound tests, in vibrotactile tests it is
nearly impossible to completely isolate the user
acoustically from the vibration source. It is expected
that despite isolating the vibration generator in a box
and using specialized sound-cancelling headphones,
still some sounds coming from the vibration generator
will reach the participant. To get an idea for this
unwanted sound detection it was requested from two
of the participants to perform the whole experiment
again, but in this case, they were not touching the
vibration probe. They assumed the same posture and
had the headphones on as before. They were also
asked to tap whenever they heard a tone. The results
of these controlled tests were compared to the results
of the tests that included touch and are shown in the
results section. In this case the results are described
with the letters VONT (Vibration Only, No Touch)
and SVNT (Sound and Vibration, No Touch).
Effect of Frequency Level on Vibro-tactile Sound Detection
99
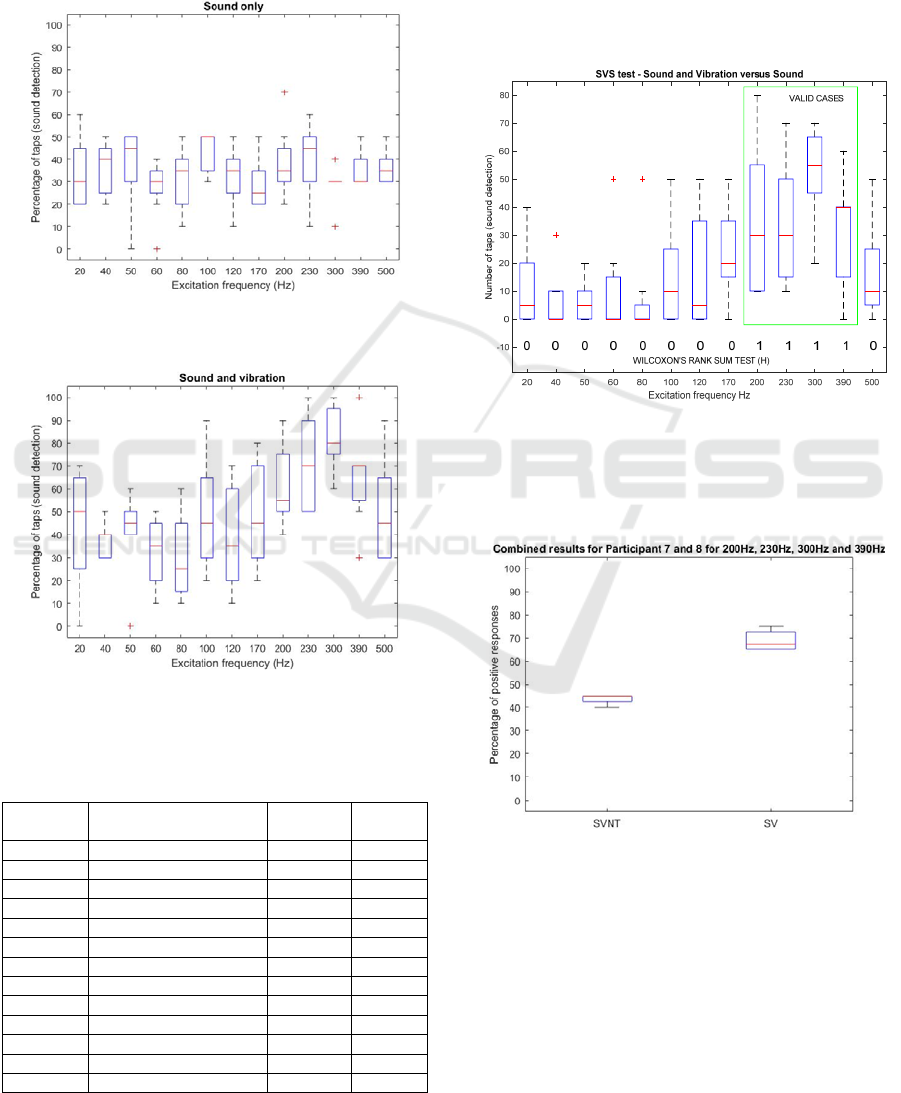
3 RESULTS
Figure 2 represents the percentage of positive
responses in sound only (SO) test. Figure 3
demonstrates similar data for sound and vibration
(SV) test.
Figure 2: Boxplots of positive responses in sound only test
(SO).
Figure 3: Boxplots of positive responses in sound and
vibration test (SV).
Table 2: Hypothesis testing for sound only versus sound
and vibration tones.
Test
Number
Test Frequency
(Hertz)
P-Value H/H0
1 20 0.3248 false
2 40 0.9902 false
3 50 0.6171 false
4 60 0.5496 false
5 80 0.8517 false
6 100 0.8455 false
7 120 0.6912 false
8 170 0.0716 false
9 200 0.0144 true
10 230 0.0095 true
11 300 0.0001 true
12 390 0.0047 true
13 500 0.2657 false
Table 3 shows the results of Hypothesis testing
between sound only and sound and vibration tests.
Figure 4 illustrates boxplots for all 13 frequencies,
comparing sound and vibration versus sound only
positive responses. The graph indicates the
percentage of valid cases. The blue boxes contain
50% of the cases and the red lines the medians. The
red crosses represent the outliers. Black dotted lines
include the rest of the results.
Figure 4: Boxplots of valid cases in SVS test.
Figure
5 shows boxplots of positive responses in
SVNT and SV tests for Participant 7 and 8 for 200
Hz, 230 Hz, 300 Hz and 390 Hz.
Figure 5: Boxplots of positive responses in SV and SVNT
tests.
Table 3 shows the results of Hypothesis Testing
for SVNT versus SV. Separate Hypothesis Testing
was performed for valid frequencies (200 Hz, 230 Hz,
300Hz and 390 Hz) and for the remaining
frequencies.
HUCAPP 2019 - 3rd International Conference on Human Computer Interaction Theory and Applications
100
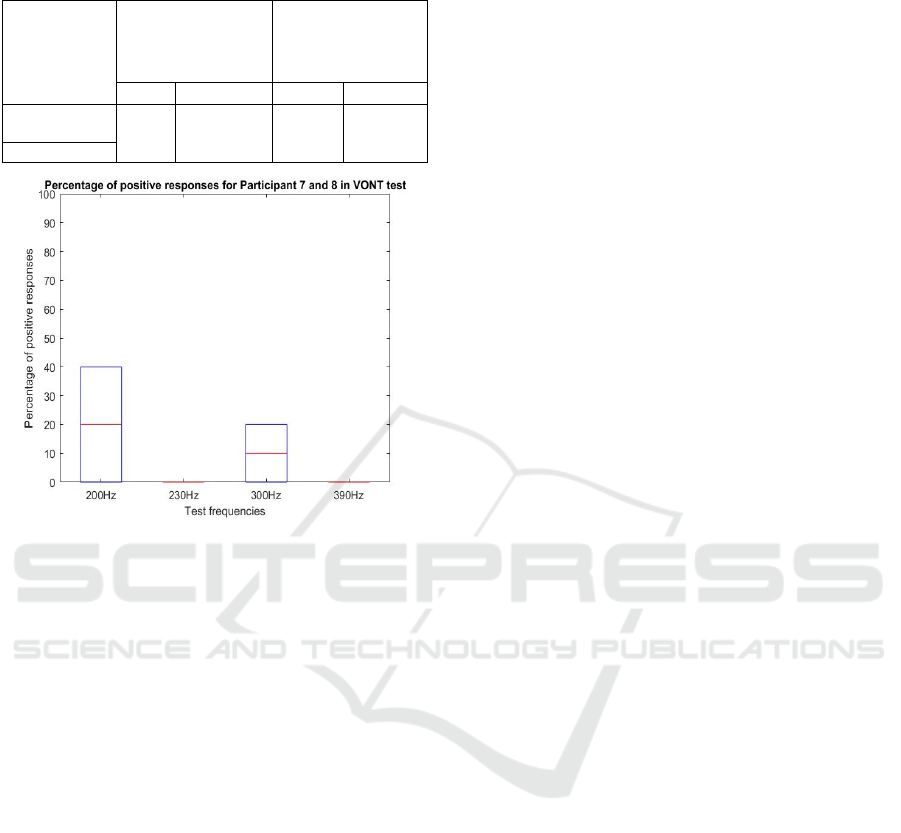
Table 3: Hypothesis testing for SV and SVNT for 8
frequencies.
Participants
7&8
Frequencies (Hz):
100, 120, 170, 500
(Non-valid)
Frequencies (Hz):
200, 230, 300, 390
(Valid)
H/H
0
p – value H/H
0
p - value
SVNT
false
0.6571
true
0.0286
SV
Figure 6: Number of positive responses in VONT test for
participants 7 & 8.
4 DISCUSSION
In Figure 2, it can be seen that the median percentage
of positive responses is roughly constant in SO test
among all frequencies. This is reasonable, since,
sound intensities were specifically chosen to have
half audible and half inaudible sounds. Figure 3
demonstrates that the median percentage of positive
responses is relatively low in SV test at frequencies
of 20-170 Hz. With further increase of frequency, the
percentage of sound detection increases, reaching its
peak at 300 Hz. There is a sharp decrease in sound
detection performance of users for frequencies higher
than 300 Hz. As it was reported by one of the
participants, the vibration was less sensible at 500 Hz,
as it was naturally expected. The calibration stage
might have contributed to this fact since the gradual
reduction of the vibration intensity (for sound
isolation purposes) might have led to undetectable
amplitudes in certain frequencies in which hearing is
more sensitive. This is believed to be the case in some
of the instances of 500 Hz generation.
Comparing the results of SO and SV tests, it is
seen that vibration has no significant effect on
enhancement of sound detection at 20-170 Hz, since
there is no significant difference in number of
positive responses. At higher frequencies starting
from 200 Hz, sound detection performance of
participants in SV test becomes significantly better
compared to their performance in the SO test. It can
be noticed in
Figure 2 and Figure 3 that the percentage
of positive responses is significantly higher in SV test
at 200 – 390 Hz. Also, according to the results of
statistical comparison between SO and SV in
Table 2,
the hypothesis is valid at test frequencies of 200Hz,
230Hz, 300Hz and 390Hz in contrast to the rest of the
frequencies. This shows that vibration can elicit
tactile sound perception or enhance inaudible sound
detection at this particular range of frequencies.
Besides that,
Table 2 shows that the biggest effect on
sound detection performance is at 300 Hz with
negligible p-value of 0.0001, and additionally, sound
detection is also high at 200 Hz, 230 Hz, 390 Hz with
p-values of 0.0144, 0.0095 and 0.0047, respectively.
Figure 4 shows a similar trend to SV results in Figure
3. This graph confirms previous claims and shows
that there is almost no audio-tactile exc~\\itation at
20-170 Hz. Starting from 200 Hz, the percentage of
tactile sound perception increases. As it was already
mentioned above, audio-tactile feedback is highest at
200-390 Hz having a peak at 300 Hz. This roughly
agrees with (Ranjbar et al., 2016), where the
respective frequency was 250 Hertz. Furthermore,
300 Hz coincides to the frequency at which maximum
tactile sensitivity with respect to amplitude of
excitation is located (Gescheider et al., 2002 cited in
Jones and Sarter, 2008).
Since, it is hard to completely isolate the sound
coming from the vibration generator, the results of SV
and SVNT tests need to be compared to ensure that
the leaked sound is significantly low. From the
statistical comparison between SV and SO, valid
frequencies are determined to be 200Hz, 230 Hz,
300Hz and 390 Hz. Thus, hypothesis testing of SV
versus SVNT was performed for the valid frequencies
and for the remaining frequencies separately. For
valid frequencies, as is seen from Figure 5, the
percentage of positive responses is relatively higher
in the SV test as compared to SVNT test. Therefore,
it can be safely concluded that the trend observed in
Figure 3 and Figure 4 is potentially a result of audio-
tactile excitation. Hypothesis testing results also
show the validity of tactile sound perception with p-
value of 0.0286. For the remaining 4 frequencies,
hypothesis testing result indicates that SV and SVNT
results are not significantly different with p – value of
0.6571.
Figure 6 further establishes that the trend shown in
Figure 3 and
Figure 4 is not a result of unwanted sound
Effect of Frequency Level on Vibro-tactile Sound Detection
101

detection (as a response to sound coming from the
vibration generator and reaching the user through the
headphones). Further it is noted that the sample
acceleration measurements did not detect transfer of
the generated vibration through conduction since
throughout the experiments the generated frequencies
were not present in the measured signals.
5 CONCLUSIONS
The results further support existing research
regarding perception of vibrotactile stimuli as sounds.
The hypothesis that there is a frequency range in
which the phenomenon under study is most intense,
is validated, with the optimal audio-tactile integration
frequency range being at 200-390 Hz. Given the
results presented in this work, further tests that
accurately address hardware issues, including
response curve of hardware to frequency, sound
isolation, absolute values of vibration and sound
intensities and other issues should be designed so that
a more precise understanding of the audio-tactile
integration is achieved.
REFERENCES
Auer Jr, E. T., Bernstein, L. E., Sungkarat, W., & Singh, M.
(2007). Vibrotactile activation of the auditory cortices
in deaf versus hearing adults. Neuroreport, 18(7), 645.
Bensmaïa, S., Hollins, M., & Yau, J. (2005). Vibrotactile
intensity and frequency information in the Pacinian
system: A Psychophysical Model. Perception &
psychophysics, 67(5), 828-841.
Caetano, G., Jousmäki, V. (2006). Evidence of vibrotactile
input to human auditory cortex. Neuroimage, 29(1), 15-
28.
Johansson, R. S & Löfvenberg, J., (1984). Regional
differences and interindividual variability in sensitivity
to vibration in the glabrous skin of the human hand.
Brain Res, 301(1), 65-72.
Kaczmarek, K. A., Webster, J. G., Bach-y-Rita, P., &
Tompkins, W. J. (1991). Electrotactile and vibrotactile
displays for sensory substitution systems. IEEE
Transactions on Biomedical Engineering, 38(1), 1-16.
Kayser, C., Petkov, C. I., Augath, M., & Logothetis, N. K.
(2005). Integration of touch and sound in auditory
cortex. Neuron, 48(2), 373-384.
Mahns, D. A., Perkins, N. M., Sahai, V., Robinson, L., &
Rowe, M. J. (2006). Vibrotactile frequency
discrimination in human hairy skin. Journal of
neurophysiology, 95(3), 1442-1450.
Ranjbar, P., Wilson, E. C., Reed, C. M., & Braida, L. D.
(2016). Auditory-Tactile integration: Effects of Phase
of Sinusoidal Stimulation at 50 and 250 Hz.
International Journal of Engineering Technology and
Scientific Innovation, 1(2), 209.
Schürmann, M., Caetano, G., Jousmäki, V., & Hari, R.
(2004). Hands help hearing: facilitatory audiotactile
interaction at low sound-intensity levels. The Journal of
the Acoustical Society of America, 115(2), 830-832.
Gescheider, G. A., Bolanowski, S. J., Pope, J. V., &
Verrillo, R. T. (2002). A four-channel analysis of the
tactile sensitivity of the fingertip: Frequency selectivity,
spatial summation, and temporal summation.
Somatosensory and Motor Research, 19, 114–124.
Jones, L. A., & Sarter, N. B. (2008). Tactile Displays:
Guidance for Their Design and Application. Human
Factors, 50(1), 90–111.
HUCAPP 2019 - 3rd International Conference on Human Computer Interaction Theory and Applications
102
