
Comparative Study of Compression Techniques Applied in Different
Biomedical Signals
A. A. Saraiva
2,3 a
, F. M. J. Castro
1 b
, Nator Junior C. Costa
1 c
, Jose Vigno M. Sousa
1 d
,
N. M. Fonseca Ferreira
4,5 e
, Antonio Valente
3,6 f
, Salviano Soares
7 g
1
UESPI-University of State Piaui, Piripiri, Brazil
3
School of Science and Technology, University of Tr
´
as-os-Montes and Alto Douro, Vila Real, Portugal
4
Department of Electrical Engineering, Institute of Engineering of Coimbra, Coimbra, Portugal
5
Knowledge Engineering and Decision-Support Research Center (GECAD) of the Institute of Engineering,
Polytechnic Institute of Porto, Portugal
6
NESC-TEC Technology and Science, Campus da FEUP, Rua Dr. Roberto Frias, 378,4200 - 465 Porto, Portugal
7
IEETA – UA and University of Tras-os-Montes and Alto Douro, Vila Real, Portugal
Keywords:
Compression and Signal and Electrooculography and Algorithms.
Abstract:
This paper aims to compare the compression of electro-oculographic signals, based on the (EOG) from MIT
/ BIH database, and the electromyographic signals, based on the (EMG) from MIT / BIH database, for that
purpose, two compression techniques that can be used in electro-oculograms and electromyograms was ap-
proached, the two techniques mentioned above, were, the discrete cosine transform and Fast Walsh Hadamard
Transform. For statistic the methods used was, the Mean squared error, mean absolute error, signal-to-noise
ratio and peak signal-to-noise ratio as well, and for results, the techniques and they performance on each tested
signal.
1 INTRODUCTION
With the constant development of computing, the
amount of information needed for humans inevitably
grows.
The volume of information carriers and the ca-
pacity of communication channels increase, but the
amount of information grows faster.
In this way the compression and decompression
procedure is a solution for a more rational use of the
storage and data transfer devices.
One of the medical applications is related to the
bio-medical signs, among them the ocular ones from
the electrooculography (EOG), and the muscular ones
from the electromyography (EMG).
a
https://orcid.org/0000-0002-3960-697X
b
https://orcid.org/0000-0002-7751-9455
c
https://orcid.org/0000-0001-5636-424X
d
https://orcid.org/0000-0002-5164-360X
e
https://orcid.org/0000-0002-2204-6339
f
https://orcid.org/0000-0002-5798-1298
g
https://orcid.org/0000-0001-5862-5706
Most modern EMG systems for algorithms for
data compression, capabilities for storing and trans-
mitting large data equipment via GSM / GPRS, Inter-
net and other communication channels for complete
telemedicine systems.
The problems about expansion of the signal
storage resources are being solved at the present mo-
ment, mainly due to the use of the technique of ”com-
pression” with losses. At the same time, the ability
to analyze data in ”full report” mode, which is acces-
sible to analog methods and in some cases important
information about rhythm disturbances and changes
not recognized by the microprocessor are lost.
Data compression is the process of detecting and
eliminating redundancies of a data set. In terms of
signal compression techniques, direct or transformed
methods were found in most of the literature. They
are characterized by not reaching the highest level of
compression, have no control over the quality of the
recovered signal.
In this paper, the efficiency of two compression
and decompression methods will be studied from
132
Saraiva, A., Castro, F., Costa, N., Sousa, J., Ferreira, N., Valente, A. and Soares, S.
Comparative Study of Compression Techniques Applied in Different Biomedical Signals.
DOI: 10.5220/0007350401320138
In Proceedings of the 12th International Joint Conference on Biomedical Engineering Systems and Technologies (BIOSTEC 2019), pages 132-138
ISBN: 978-989-758-353-7
Copyright
c
2019 by SCITEPRESS – Science and Technology Publications, Lda. All rights reserved

EOG, and EMG signs: FWHT and DCT. The data are
analyzed in terms of signal quality and compression
level and they come from the MIT/BIH database.
The document is divided into 7 sections, in which
section 2 and 3 is characterized by explanation of met-
hods used, followed by section 4 in which it shows the
metric comparison of the method. It follows the for-
mulation of the central algorithm applied in section 5
and the statistical method to verify reliability. The re-
sults after application of the proposal are presented in
section 6 and the conclusion in section 7.
2 ELECTROOCULOGRAPHY
Electrooculography (EOG) is a technique for measu-
ring the corneo-retinal standing potential that exists
between the front and the back of the human eye. The
resulting signal is called the electrooculogram. Pri-
mary applications are in ophthalmological diagnosis
and in recording eye movements. Unlike the electr-
oretinogram, the EOG does not measure response to
individual visual stimuli.
To measure eye movement, pairs of electrodes are
typically placed either above and below the eye or to
the left and right of the eye. If the eye moves from
center position toward one of the two electrodes, this
electrode ”sees” the positive side of the retina and the
opposite electrode ”sees” the negative side of the re-
tina. Consequently, a potential difference occurs bet-
ween the electrodes. Assuming that the resting poten-
tial is constant, the recorded potential is a measure of
the eye’s position (Brown et al., 2006).
Electro-oculography is used to record eye mo-
vements during electronystagmographic testing. It
is based on the corneoretinal potential (difference in
electrical charge between the cornea and the retina),
with the long axis of the eye acting as a dipole. Mo-
vements of the eye relative to the surface electrodes
placed around the eye produce an electrical signal that
corresponds to eye position. Recordings of eye mo-
vement are accurate to about 0.5 degree, but it is still
less sensitive than visual inspection, which can per-
ceive movements of about 0.1 degree. Therefore, vi-
sual inspection with Frenzel lenses is sometimes still
necessary to document nystagmus of low amplitude.
Another limitation of electro-oculography is that tor-
sional eye movements cannot be monitored. Again,
visual inspection with Frenzel lenses is sometimes
necessary to document torsional nystagmus(Saraiva
et al., 2018b).
Fortunately, new techniques have been developed
to provide greater accuracy and breadth for oculo-
motor testing. The most clinically useful technique
that has been developed is the infrared video elec-
tronystagmographic system. Here, the patient wears
goggles that illuminate the eyes with infrared light
(invisible to the patient), allowing a small video ca-
mera to pick up and project an image of the eyes onto
a monitor. This can also assess eye movement in ho-
rizontal, vertical, and torsional directions and is more
accurate than electro-oculography(das Chagas Fonte-
nele Marques Junior et al., 2018) (Schapira, 2006).
3 ELECTROMYOGRAPHY
The EMG is the process by which an examiner puts a
needle into a particular muscle and study the electrical
activity of that muscle, this electrical activities come
from the muscle itself no shocks are used to stimulate
the muscle, by that is possible to find a muscle who
present a particular problem or disease(Weiss et al.,
2015).
The excitability of a muscle fibers through neural
control represents a major factor in muscle physio-
logy, for that the EMG is a technique concerned with
the development recording and analysis of myoeletric
signals, the signals taken by this process are formed
by physiological variations in the state of muscle fi-
ber membranes, by that some diseases and problems
can be detected if the variation don’t follow the nor-
mal patterns under minor exceptions(Konrad, 2005),
there’s another way to measure the EMG,is the neu-
rological EMG, by this way electrical shocks are used
to stimuli the muscle, but on this work, the kinesio-
logic EMG will be approached, on this type only the
natural response of the muscle are taken as object of
study then for that are used to take the signal.
4 DCT - DISCRETE COSINE
TRANSFORM
The DCT is very related to the Discrete Fourier Trans-
form (DFT), it can often reconstruct a precise se-
quence of only a few DCT coefficients, this property
is very useful for applications that require data re-
duction, precisely the purpose of this work, to ex-
plore the reduction of data use in electrocardiogram,
(Nguyen et al., 2017). The DCT has four standard va-
riants, for an x-signal of size N and with the kronecker
δ, the transformations are defined by the equations1,
2, 3 and 4 respectively.
y(k)=
√
2
N
∑
N
N−1
x(n)
1
√
1+ delta
n1
+δ
nN
1
√
1+δ
k1
δ
kN
cos
(
π
N−1
(n−1)(k−1)
)
(1)
y(k)=
q
2
N
∑
N
n−1
x(n)
1
√
1=δ
k1
cos
(
π
2N
(2n−1)(k−1)
)
(2)
Comparative Study of Compression Techniques Applied in Different Biomedical Signals
133

y(k)=
q
2
N
∑
N
n−1
x(n)
1
√
1+δ
n1
cos
(
π
2N
(n−1)(2k−1)
)
(3)
y(k) =
r
2
N
N
∑
n=1
x(n)cos
π
4N
(2n −1)(2k −1)
(4)
The series are indexed with n = 1 and k = 1 instead
of the usual n = 0 and k = 0.
On the equations, x is meaning the input array, y
are the DCT itself and n is equal to the length of the
transform, a positive integer scalar, with x and y being
vectors (they can be matrices), (Nguyen et al., 2017).
In his work, Swarnkar using the standlet transform
achieved better results compared to DCT and Wave-
let transform, being able to illustrate well its results
using data like SNR, also used in this work, CR and
Price Related Differential (PRD), (A.Swarnkar et al.,
2017).
A DCT expresses a series of finitely many data
points in terms of a sum of cosine functions. Oscil-
late at different frequencies. DCT has the applicati-
ons of solving partial differential equations, Chebys-
hev approximation, audio compression, (Raj and Ray,
2017).
5 FWHT- FAST WALSH
HADAMARD TRANSFORM
The WHT is a non-sinusoidal, orthogonal transfor-
mation technique that decomposes the signal into a
series of base functions, these base functions are cal-
led Walsh functions, which are rectangular and square
waves with values of -1 and 1. They are also known
as Hadamard, Walsh, or Walsh Fourier transform.
They are very useful in reducing the requirements
of storage, bandwidth and spectrum analysis. Like
Fast Fourier Transform (FFT) the WHT has a faster
version to Fast Walsh Hadamard Transform (FWHT),
which compared to FFT requires less storage space
and is faster to calculate, since it uses only real additi-
ons and subtractions, whereas the FFT uses complex
values.
Both the FWHT and the Inverse Fast Hadamard
Transform (IFWHT) are symmetric to each other and
use identical calculation processes (Saka et al., 2016).
For a signal x(t) of size N the FWHT and IFWHT
are defined as follows:
y =
1
N
n−1
∑
i=0
xWAL(n, i) (5)
x =
n−1
∑
i=0
yWAL(n, i) (6)
Where i=0,1...,N-1 and WAL(n,i) are the Walsh
functions. Similar to the Cooley-Tukey algorithm for
the FFT, the N elements are decomposed into two sets
of N/2 elements, which are then combined using a
butterfly structure to form the FWHT, (Saka et al.,
2016).
6 STATISTICS
For the achievement of the quality of compressed and
reconstructed signal classification, compared with the
original signal was used the Mean Squared Error
(MSE), MAE, SNR, PSNR.
6.1 MSE
The MSE is a signal fidelity meter. The purpose of a
fidelity meter is to compare two signals and provide
a quantitative score that describes the degree of simi-
larity or fidelity and the level of error or distortion
between them, assuming that one of the signals is pri-
mitive and error-free while the other is distorted and
contaminated by errors (Saraiva et al., 2018c). The
MSE can be calculated as the equation 7, shows.
MSE =
1
mn
m−1
∑
x=0
n−1
∑
y=0
I −K
2
(7)
Taking I, as a n predictions vector and K, as a vec-
tor of observed values of the variable being predicted.
6.2 MAE
The MAE is a ”scaled” measure, in this, it expresses
a precise prediction model of errors in units of the
variable of interest, as well as the MSE, the smaller
the value, the greater the fidelity signal.
MAE =
1
n
n
∑
i=1
|e
i
| (8)
Reconstructed to the original signal, the MAE can be
calculated assuming that there are n sample model er-
rors e calculated as (e
i
,i=1,2,...,n), (Willmott and Mat-
suura, 2008).
6.3 SNR
SNR is the rate between signal and noise, in engi-
neering and science the SNR is the measurement that
compares the level of the desired signal with the back-
ground noise level.
Mathematically the SNR is the intensity quotient
of a signal measured in a Region of Interest (ROI) and
BIOSIGNALS 2019 - 12th International Conference on Bio-inspired Systems and Signal Processing
134
the standard deviation of the signal intensity in an area
outside the imaged object’s anatomy.
SNR = Log
∑
N
n=0
V
2
R
(n)
∑
N
n=0
S
2
R
(n)
(9)
The SNR can be calculated assuming V
R
(n) as the re-
constructed signal, V (n) as the original Signal and the
S
R
(n) as the deformation of the reconstructed Signal,
(Princy et al., 2015).
6.4 PSNR
The PSNR is a parameter used to quantify the signal
quality, it is also used as a benchmark, of the level
of similarity between the reconstructed signal and the
original signal.
The higher the PSNR value, the better the signal
quality. And can be calculated as the Equation 10,
shows.
PSNR = 10 log
MAX
2
MSE
= 20 log
MAX
MSE
1
2
(10)
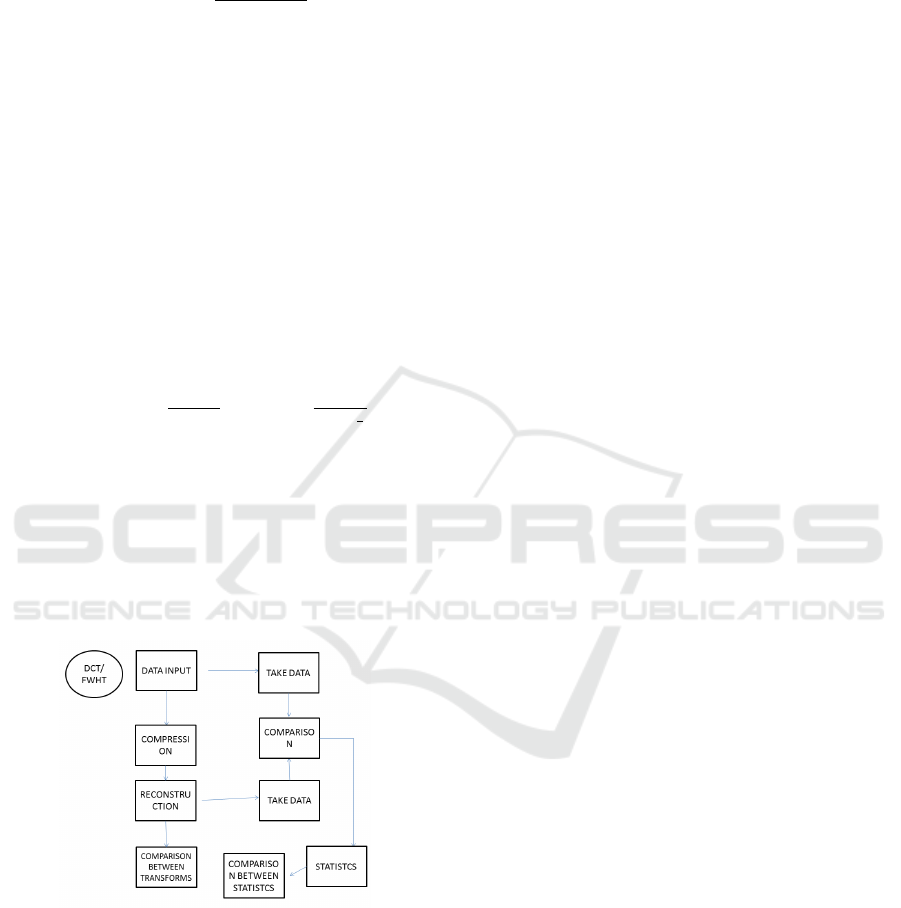
7 METHODOLOGY
In the Fig.1, was exemplified the step by step of this
work in a simple block diagram, the example shows
the process of comparison between the two compres-
sion techniques, FWHT and DCT.
Figure 1: Methodology Block diagram.
First, the signal is taken from a source in this case
the MIT-Database Chosen from the database of EOG
and EMG signal, sometimes the signal taken has noise
so the filtering was necessary, then, the signal who
was input is loaded to the software , then the data is
taken from it the data will be used to a comparison
later, before that, the compression technique is app-
lied to the signal, if the FWHT is applied, the signal
is repeated 8 times, and then random noise is added
before the compression, on the DCT case it won’t be
necessary to repeat the signal.
After compressed the signal, we get the data from
the input signal, and for that the inverse transform
of the respective compression technique is added,
getting with that, a reconstructed signal, the recon-
structed signals may vary depending of the compres-
sion technique, in this case, the FWHT has as the re-
constructed signal 8x bigger than DCT reconstructed
signal because of the repetition used early.
Before that, the data of the reconstructed signal
was compared to the size of the original signal of the
respective technique, then after the comparison bet-
ween the original and the reconstructed signal in mind
that the FWHT reconstructed signal must be compa-
red with the 8x repeated Original signal because of it
size, and the DCT reconstructed signal must be com-
pared with the original signal as well because of it
size keeping in mind that the signal behave on dif-
ferent ways according to the compression and recon-
struction technique(Saraiva et al., 2018d).
To do so, the statistic used are the MSE, MAE,
SNR and PSNR with them, the signal quality and
similarity can be tested, according to the results gi-
ven by the mentioned statistic methods the MSE and
MAE statistic methods, test the signal fidelity of the
reconstructed signal compared to the original signal
for both FWHT or DCT keeping in mind that each
technique has its own size of original and recon-
structed signal, on the FWHT the signal was 8 times
repeated to get the coefficients WHT, also the PSNR
and the SNR test the quality of the reconstructed sig-
nal compared to the original signal having as well the
cautions to each Technique used on this work as men-
tioned above (Saraiva et al., 2018a) (Saraiva et al., ).
8 RESULTS
After the methodology used the signals were graphi-
cally represented to increase the understanding of this
work the next images will show the comparison of the
reconstructed signals and the original ones then show
the statistic results to discuss the work before the con-
clusion.
In the Fig 2(a), are showed a 8x repeated EOG
and the WHT coefficients of it, with that its possible
to obtains the Walsh functions using the FWHT, each
sample uses on the EOG example, was taken from the
right eye readings the same is shown on the Fig 2(b),
but with the EMG, also is showed its WHT coeffi-
cients.
In the Fig 3(c) and Fig 3(d), is showed graphi-
cally the original and the reconstructed by IDCT sig-
Comparative Study of Compression Techniques Applied in Different Biomedical Signals
135
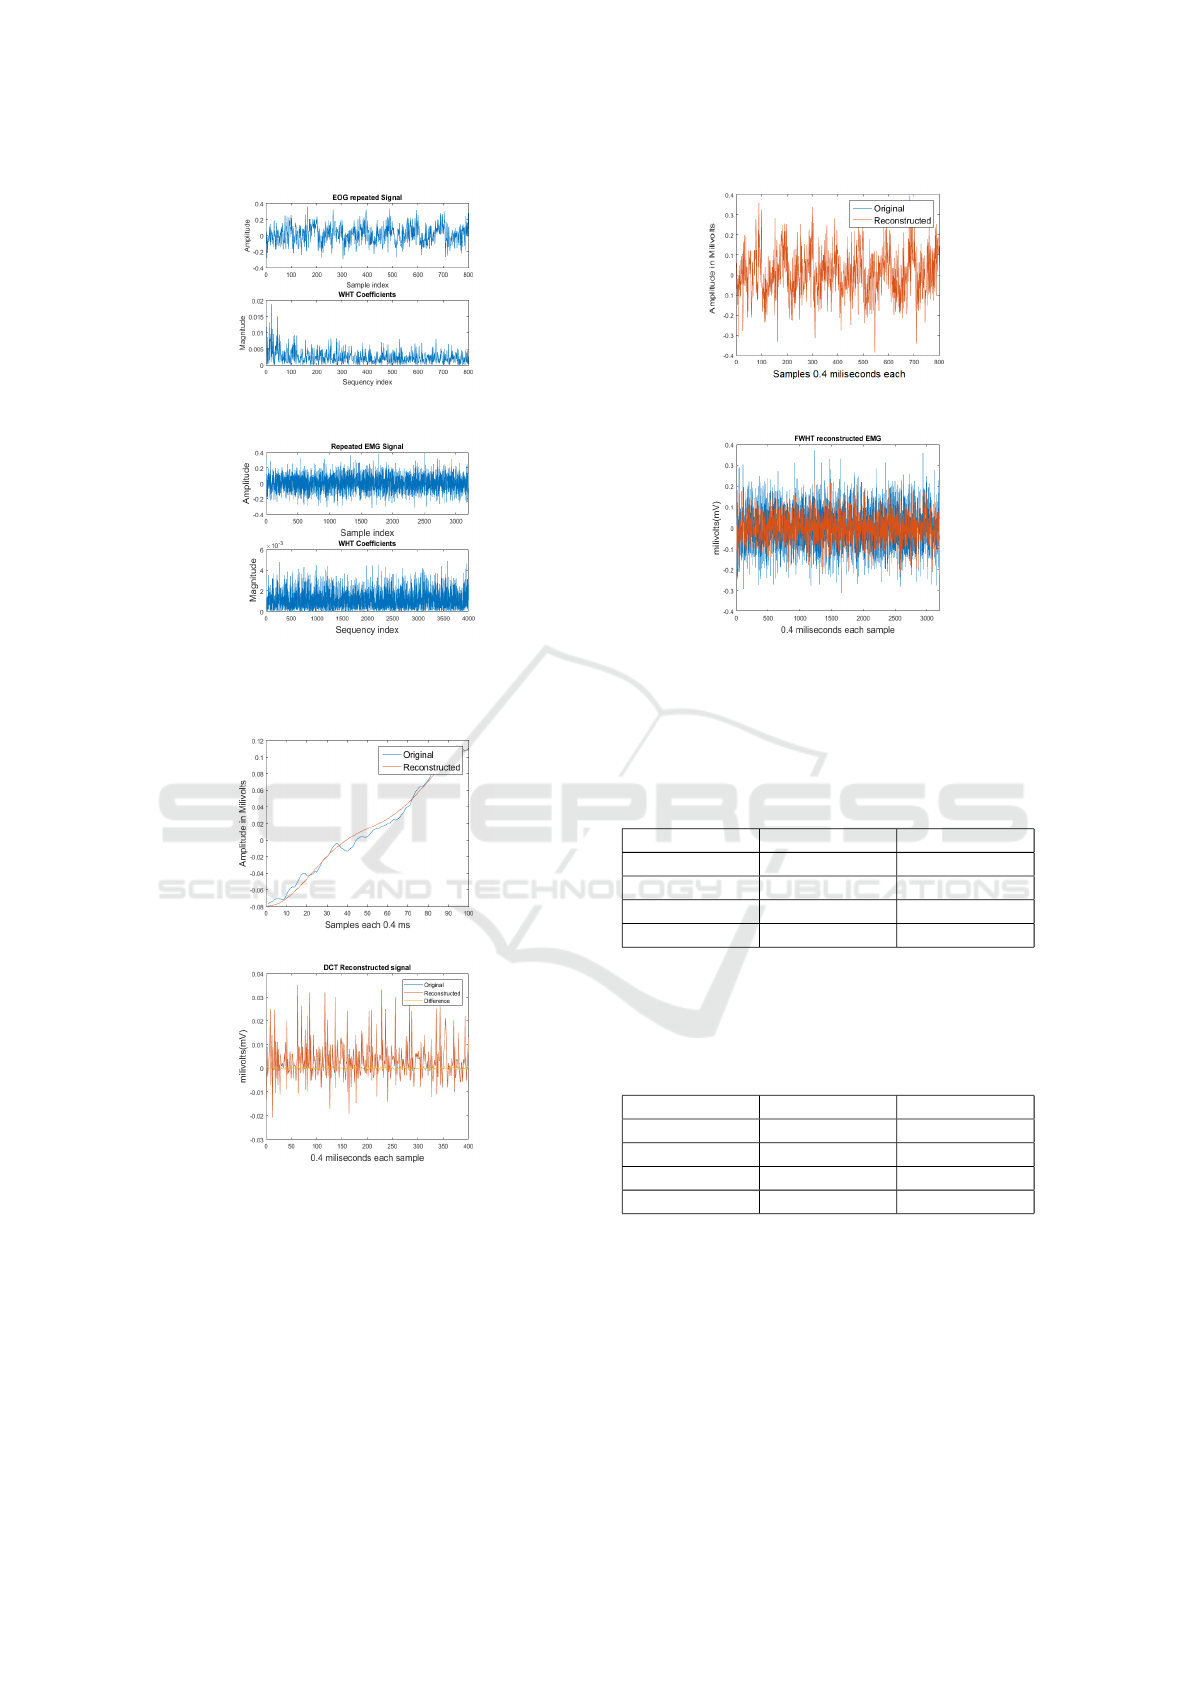
(a) Repeated EOG and WHT coeffi-
cients
(b) Repeated EMG and WHT coeffi-
cients
Figure 2.
(c) IDCT reconstructed EOG signal
(d) IDCT reconstructed EMG signal
Figure 3.
nals, showed in the graphic in different colors, exem-
plified on the legend each sample the original EOG,
original EMG and the reconstructed are nearly simi-
lar, of course, taking the graphic as basis, that occurs
because the DCT have a small loss rate, keeping in
mind, the low difference seen in the graphic above.
In the Fig 4(e) and Fig 4(f), are showed the result
obtained after the signals passes through the FWHT,
being converted into WHT coefficients, or Walsh
(e) IFWHT reconstructed EOG sig-
nal
(f) IFWHT reconstructed EOG sig-
nal
Figure 4.
functions, with that its possible to use the IFWHT to
obtain the reconstructed signals.
Table 1: Discrete cosine Transform.
Transform Test Value
DCT PSNR 24.876553
DCT SNR 19.1117
DCT MAE 0.005583
DCT MSE 0.000043
On the table 1, are exemplified the results of the
statistic methods applied on the DCT EOG recon-
structed signal.
Table 2: Fast Walsh Hadamard Transform.
Transform Test Value
FWHT PSNR 13.90701
FWHT SNR -4.374118
FWHT MAE 0.078406
FWHT MSE 0.009601
On the table 2, are showed the results of the sta-
tistic methods applied on IFWHT EMG reconstructed
signal.
On the table 1, are exemplified the results of the
statistic methods applied on the DCT reconstructed
EMG signal.
On the table 2, are showed the results of the sta-
tistic methods applied on IFWHT EMG reconstructed
signal.
BIOSIGNALS 2019 - 12th International Conference on Bio-inspired Systems and Signal Processing
136

Table 3: Discrete cosine Transform.
Transform Test Value
DCT PSNR 39.214499
DCT SNR 27.158767
DCT MAE 0.000299
DCT MSE 0.000000
Table 4: Fast Walsh Hadamard Transform.
Transform Test Value
FWHT PSNR -5.723057
FWHT SNR -17.778790
FWHT MAE 0.052583
FWHT MSE 0.004576
9 CONCLUSION
In a direct comparison between the above-mentioned
transforms, the FWHT obtained advantage because
the reconstructed signal approached the original sig-
nal and its compression was much more efficient.
DCT has proven itself to be effective with a very
precise reconstruction of the compressed EOG in ad-
dition to the need for signal repetition. as seen in the
images above, the graph of the DCT is relatively close
to that of the original EOG taking as example the er-
rors that were the lowest compared to the FWHT.
The DCT was proven itself most effective on a di-
rect comparison in the EMG case for that the DCT is
the best transform between the analyzed ones to EMG
With greater advantage than on the EOG.
keeping in mind the results obtained, we see that
the compression techniques discussed have their dis-
tinct particulars in certain aspects, therefore, we must
always take into account that in some cases the results
may not be identical.
for future work, it is interesting to classify a lar-
ger variety of transforms and their performances as
the DWT (Discrete Wavelet Transform) into a wider
range of medical signals, such as ECG (Electrocardi-
ogram) and EEG (Electroencephalogram).
ACKNOWLEDGMENTS
This work is financed by National Funds through the
FCT - Fundac¸
˜
ao para a Ci
ˆ
encia e a Tecnologia (Por-
tuguese Foundation for Science and Technology) as
part of project UID/EEA/00760/2019.
REFERENCES
A.Swarnkar, Kumar, R., Kumar, A., and Khanna, P. (2017).
Performance of different threshold function for ecg
compression using slantlet transform. in signal pro-
cessing and integrated networks (spin). volume 37,
pages 375–379.
Brown, M., Marmor, M., Zrenner, E., Brigell, M., Bach,
M., et al. (2006). Iscev standard for clinical electro-
oculography (eog) 2006. Documenta ophthalmolo-
gica, 113(3):205–212.
das Chagas Fontenele Marques Junior, F., Saraiva, A. A.,
Sousa, J. V. M., Ferreira, N. F., and Valente, A. (2018).
Manipulation of bioinspiration robot with gesture re-
cognition through fractional calculus. In IEEE LARS
2018 – 15th Latin American Robotics Symposium,
SBR 2018 – 6th Brazilian Robotics Symposium, 2018.
IEEE.
Konrad, P. (2005). The abc of emg. A practical introduction
to kinesiological electromyography, 1:30–35.
Nguyen, B., Nguyen, D., Ma, W., and Tran, D. (2017). In-
vestigating the possibility of applying eeg lossy com-
pression to eeg-based user authentication. In Neural
Networks (IJCNN), 2017 International Joint Confe-
rence on, pages 79–85. IEEE.
Princy, R., Thamarai, P., and Karthik, B. (2015). Denoi-
sing eeg signal using wavelet transform. International
Journal of Advanced Research in Computer Engineer-
ing & Technology, 3.
Raj, S. and Ray, K. C. (2017). Ecg signal analysis using dct-
based dost and pso optimized svm. volume 66, pages
470–478.
Saka, K., Aydemir,
¨
O., and
¨
Ozt
¨
urk, M. (2016). Classifi-
cation of eeg signals recorded during right/left hand
movement imagery using fast walsh hadamard trans-
form based features. In Telecommunications and Sig-
nal Processing (TSP), 2016 39th International Confe-
rence on, pages 413–416. IEEE.
Saraiva, A. A., Castro, F. M. J., Sousa, J. V. M., Valente,
A., and N M Fonseca, F. (2018a). Comparative study
between the walsh hadamard transform and discrete
cosine transform. In 7th International Conference on
Advanced Technologies.
Saraiva, A. A., Costa, N. J. C., Sousa, J. M., Araujo, T. P. D.,
Ferreira, N. M. F., and Valente, A. (2018b). Scalable
task cleanup assignment for multi-agents. Memorias
de Congresos UTP, 1(1):439–446.
Saraiva, A. A., Ferreira, N. M. F., Soares, S. F., Reis, M.
J. C. S., and Valente, A. Filtering of cardiac sig-
nals with mathematical morphology for qrs detection.
In Proceedings of ICAT’18, 7th International Confe-
rence on Advanced Technologies, pp. 1008-1017, 28
April-1 May, Antalya, Turkey, ISBN 978-605-68537-
1-5, 2018. IEEE.
Saraiva, A. A., Ferreira, N. M. F., and Valente, A. (2018c).
New bioinspired filter of dicom images. In Procee-
dings of the 11th International Joint Conference on
Biomedical Engineering Systems and Technologies -
Volume 1: BIODEVICES,, pages 258–265. INSTICC,
SciTePress.
Comparative Study of Compression Techniques Applied in Different Biomedical Signals
137

Saraiva, A. A., Nogueira, A. T., Ferreira, N. F., and Valente,
A. (2018d). Application of virtual reality for the tre-
atment of strabismus and amblyopia. In 2018 IEEE
6th International Conference on Serious Games and
Applications for Health (SeGAH), pages 1–7. IEEE.
Schapira, A. H. (2006). Neurology and clinical neuros-
cience, volume 1. Elsevier Health Sciences.
Weiss, L. D., Weiss, J. M., and Silver, J. K. (2015). Easy
EMG E-Book: A Guide to Performing Nerve Con-
duction Studies and Electromyography. Elsevier He-
alth Sciences.
Willmott, C. J. and Matsuura, K. (2008). Advantages of the
mean absolute error (mae) over the root mean square
error (rmse) in assessing average model performance.
In Climate research. JSTOR.
BIOSIGNALS 2019 - 12th International Conference on Bio-inspired Systems and Signal Processing
138
