
Heart Rate Variability and Electrodermal Activity in Mental Stress
Aloud: Predicting the Outcome
Rodrigo Lima
1,2
, Daniel Os
´
orio
1,3
and Hugo Gamboa
1,2,3
1
Plux-Wireless Biosignals S.A, Avenida 5 de Outubro 70, 1050-59, Lisboa, Portugal
2
Department of Physics, Faculdade de Ci
ˆ
encias e Tecnologia da Universidade Nova de Lisboa,
Monte de Caparica, 2892-516, Caparica, Portugal
3
Laborat
´
orio de Instrumentac¸
˜
ao, Engenharia Biom
´
edica e F
´
ısica da Radiac¸
˜
ao (LIBPhys-UNL),
Faculdade de Ci
ˆ
encias e Tecnologia da Universidade Nova de Lisboa, Monte de Caparica, 2892-516, Caparica, Portugal
Keywords:
Heart Rate Variability, Electrodermal Activity, Photoplethysmography, Autonomous Nervous System,
Wearable Device, Biosignals, Machine-Learning, Classification.
Abstract:
The assessment of changes in the autonomous nervous system (ANS), have important prognostic and diag-
nostic value, and can be used to assess stress levels. There are many approaches to directly measure the
sympathetic and parasympathetic nervous system, although, most of them are invasive and unable to provide
continuous monitoring. Heart rate variability (HRV) and Electrodermal activity (EDA) are noninvasive meth-
ods to assess the autonomous nervous system, by computing the spectral analysis of both HRV and EDA
biosignals. In order to provide continuous monitoring, a wearable device is used, obtaining HRV features with
photoplethysmography signals from the wrist and EDA from the fingers. The extraction of the HRV and EDA
features, were obtained by submitting the subjects to a mental arithmetic stress test. The distinct response
to stress was then classified using machine-learning techniques. The constructed models have the ability to
predict how the subjects will respond, with an accuracy of approximately 80% in terms of HRV features in
baseline and an accuracy of approximately 77% in terms of HRV and EDA simultaneous baseline features,
when submitted to a situation of stress.
1 INTRODUCTION
The assessment of the changes in the autonomous ner-
vous system (ANS) activity related with certain dis-
eases and pathologies, such as myocardial infarction,
cardiac transplantation, myocardial dysfunction, di-
abetic neuropathy and depression, has been demon-
strated to have important prognostic and diagnostic
value (Posada-Quintero et al., 2016a).
In recent times, cardiovascular research has
played an important role in studying the activity of
the ANS, so delineating the role of autonomous car-
diac reactivity is important to prevent these serious
health diseases (Posada-Quintero et al., 2016a).
The ANS is regulated by the central autonomous
network in the brain, comprised of multiple neu-
roanatomical structures. These brain related struc-
tures influence heart activity, responding and adapt-
ing to environmental challenges, through the adjust-
ment of physiological arousal by transmitting output
to the sinoatrial node of the heart (Hamilton and Al-
loy, 2016).
The autonomous signals are transmitted to
the body through two branches of the ANS:
the sympathetic nervous system (SNS) and the
parasympathetic nervous system (PNS). The sympa-
thetic and parasympathetic nerve fibers secrete two
synaptic transmitter substances: acetylcholine and
epinephrine. The terminal nerve endings of the PNS
secrete acetylcholine, also called cholinergic fibers,
thus its influence on heart rate is mediated via re-
lease of acetylcholine by the vagus nerve, decreasing
the strength of contraction and consequent heart rate
(Hamilton and Alloy, 2016). The terminal endings
of the SNS secrete epinephrine, also called adren-
ergic fibers, a term derived from adrenalin, thus its
influence on the heart is mediated via release of
epinephrine, increasing the force of contraction and
consequent heart rate (Guyton and Hall, 2011). In a
situation of stress, usually, vagal activity withdrawals,
decreasing the control and influence on the heart by
the vagus nerve, facilitating the activation of the SNS,
with excitatory influences to the heart.
There are many approaches to directly measure
the PNS and SNS activity, although, most of them are
invasive and unable to provide continuous monitor-
42
Lima, R., Osório, D. and Gamboa, H.
Heart Rate Variability and Electrodermal Activity in Mental Stress Aloud: Predicting the Outcome.
DOI: 10.5220/0007355200420051
In Proceedings of the 12th International Joint Conference on Biomedical Engineering Systems and Technologies (BIOSTEC 2019), pages 42-51
ISBN: 978-989-758-353-7
Copyright
c
2019 by SCITEPRESS – Science and Technology Publications, Lda. All rights reserved

ing, leading to an inaccurate assessment of the ANS
dynamics (Posada-quintero and Hall, 2016). A non-
invasive method to assess the ANS activity, is to com-
pute the power spectral analysis of Heart Rate Vari-
ability (HRV) (Posada-Quintero et al., 2016a; Posada-
Quintero et al., 2016b; Bansal et al., 2009).
HRV is a measure of the time series of beat-to-
beat intervals from an electrocardiogram (ECG) be-
tween consecutive heart beats (Zoltan, 2013). HRV
can also be computed by acquiring photoplethysmog-
raphy (PPG) signals.
PPG is an optical measurement technique, used
to detect blood volume changes in the microvascu-
lar bed of tissue, with widespread clinical application,
such as ambulatory patient monitoring (Allen, 2007;
Bolanos et al., 2006). PPG signals are a source of
HRV information due to the synchronization between
heart beats in the ECG and the systolic peak in the
PPG waveform.
In order to monitor the effects of neural mecha-
nisms to the heart, the spectral analysis of HRV has
been performed to asses the level of unbalance of the
ANS. The PNS is a major contributor to the high fre-
quency (HF) component (0.15-0.4 Hz), while the low
frequency (LF) component (0.04-0.15 Hz) is consid-
ered to be a marker of the sympathetic modulation,
despite being influenced by both the PNS and the
SNS (Zoltan, 2013; Bussmann, 1998; Miranda Dan-
tas et al., 2012). The ratio LF/HF reflects the balance
between the sympathetic and parasympathetic activ-
ity, so it has not been fully accepted as an accurate
measure of the ANS, since the LF component is also
influenced by the parasympathetic system (Posada-
Quintero et al., 2016a).
Electrodermal Activity (EDA) is an alternative
method to directly assess the SNS (Kleckner et al.,
2017). The human skin is innervated by numer-
ous efferent fibers, including sympathetic fibers, such
as eccrine sweat glands, which produce sweat when
the acetylcholine transmitter passes from sudomotor
fibers to these glands, changing the skin’s electri-
cal characteristics (Boucsein, 2012). Eccrine glands
are mostly involved in emotional responses to exter-
nal stimulus and reflect only activity from the SNS,
because there is no innervation of the PNS in these
glands (Posada-quintero et al., 2016).
EDA signals can be divided into two different
components: phasic component (SCR - Skin Conduc-
tance Response) and the tonic component (SCL - Skin
Conductance Level) (Gamboa and Fred, 2008). The
phasic component is the result of the activation of the
SNS, after a stimuli presentation, being usually over-
lapped by the tonic component, which is not directly
related to an external stimuli, because it is a slow
changing signal (Benedek and Kaernbach, 2010).
To establish a connection between both tech-
niques, each subject was submitted to a mental arith-
metic stress test, the Paced Visual Serial Addition Test
(PVSAT). The PVSAT is the visual version of the
PASAT, a test where the participants are presented
with a series of digits that must be summed in a
narrow time interval. The participants must respond
aloud the correct answer, prior to the presentation of
the next digit (Tombaugh, 2006; Royan et al., 2004;
Parsons and Courtney, 2014), triggering a state of
anxiety and stress among the participants, increasing
heart rate and electrodermal activity, making it eas-
ier to detect changes in the SNS and PNS, during the
situation of stress compared to baseline.
This paper is divided in 4 sessions. In the next
session the materials and methods are presented, with
the description of the population, materials and pro-
tocol of the stress test performed. The methods used
to analyze the data are also described in this session,
with details of the algorithms used to compute HRV
and EDA features. Additionally, a statistical analysis
and machine-learning algorithms are also presented.
Then, the results obtained are presented in session 3,
with the classification and construction of the models
to predict the outcome. Finally, the results obtained
are discussed in session 4.
2 MATERIALS AND METHODS
2.1 Study Population
Data was acquired from a group of volunteer subjects.
Fifteen participants (9 females and 6 males) of ages
from 21 to 55 years old (31 ± 11), height from 1.57
to 1.85 meters (1.73 ± 0.09) and weight from 52 to
94 kilograms (72 ± 13) signed an informed consent.
Table 1 gives the statistics for the study population.
Table 1: Study population statistics.
Mean SE Min Max
Age (years) 31 11 21 55
Height (m) 1.72 0.09 1.57 1.85
Weight (kg) 72 13 52 94
SE - Standard Error
2.2 Materials
The acquisition of the biosignals was made with a
BITalino wearable wrist device prototype composed
of six different sensors: EDA wrist, PPG, Spare sen-
sor, Total Volatile Organic Compounds (TVOC), Car-
Heart Rate Variability and Electrodermal Activity in Mental Stress Aloud: Predicting the Outcome
43
bon Dioxide (CO2) and Temperature (TEMP), devel-
oped by Plux Wireless Biosignals (see Table 2). For
this experiment only the PPG (Channel 2) and the
EDA spare sensor (Channel 3) were used. Both the
PPG and EDA signals were acquired, simultaneously,
with a sampling rate of 1000 Hz and 10-bit resolution.
The PPG sensor is a green LED with a photodetector
in reflection mode while the EDA sensor uses gelled
electrodes.
Table 2: Wearable Wrist Device Specifications.
Sensor Channel Resolution (bits) Sampling Rate
EDA wrist 1 10
10 Hz
100 Hz
1000 Hz
PPG 2 10
Spare 3 10
TVOC 4 10
CO2 5 6
TEMP 6 6
2.3 Protocol
The experiment was performed in a quiet room, in or-
der to avoid interference that would distract the par-
ticipants, due to the fact that, in order to perform the
PVSAT several cognitive functions are required, such
as attention and working memory. The duration of the
experiment was 12 minutes (6-min baseline + 6-min
stress). The stress status is defined by the changes
in physiological parameters derived by the complex-
ity and difficulty of the PVSAT, in comparison with
the baseline status. The subjects were asked to sit in a
comfortable chair and avoid any movement during the
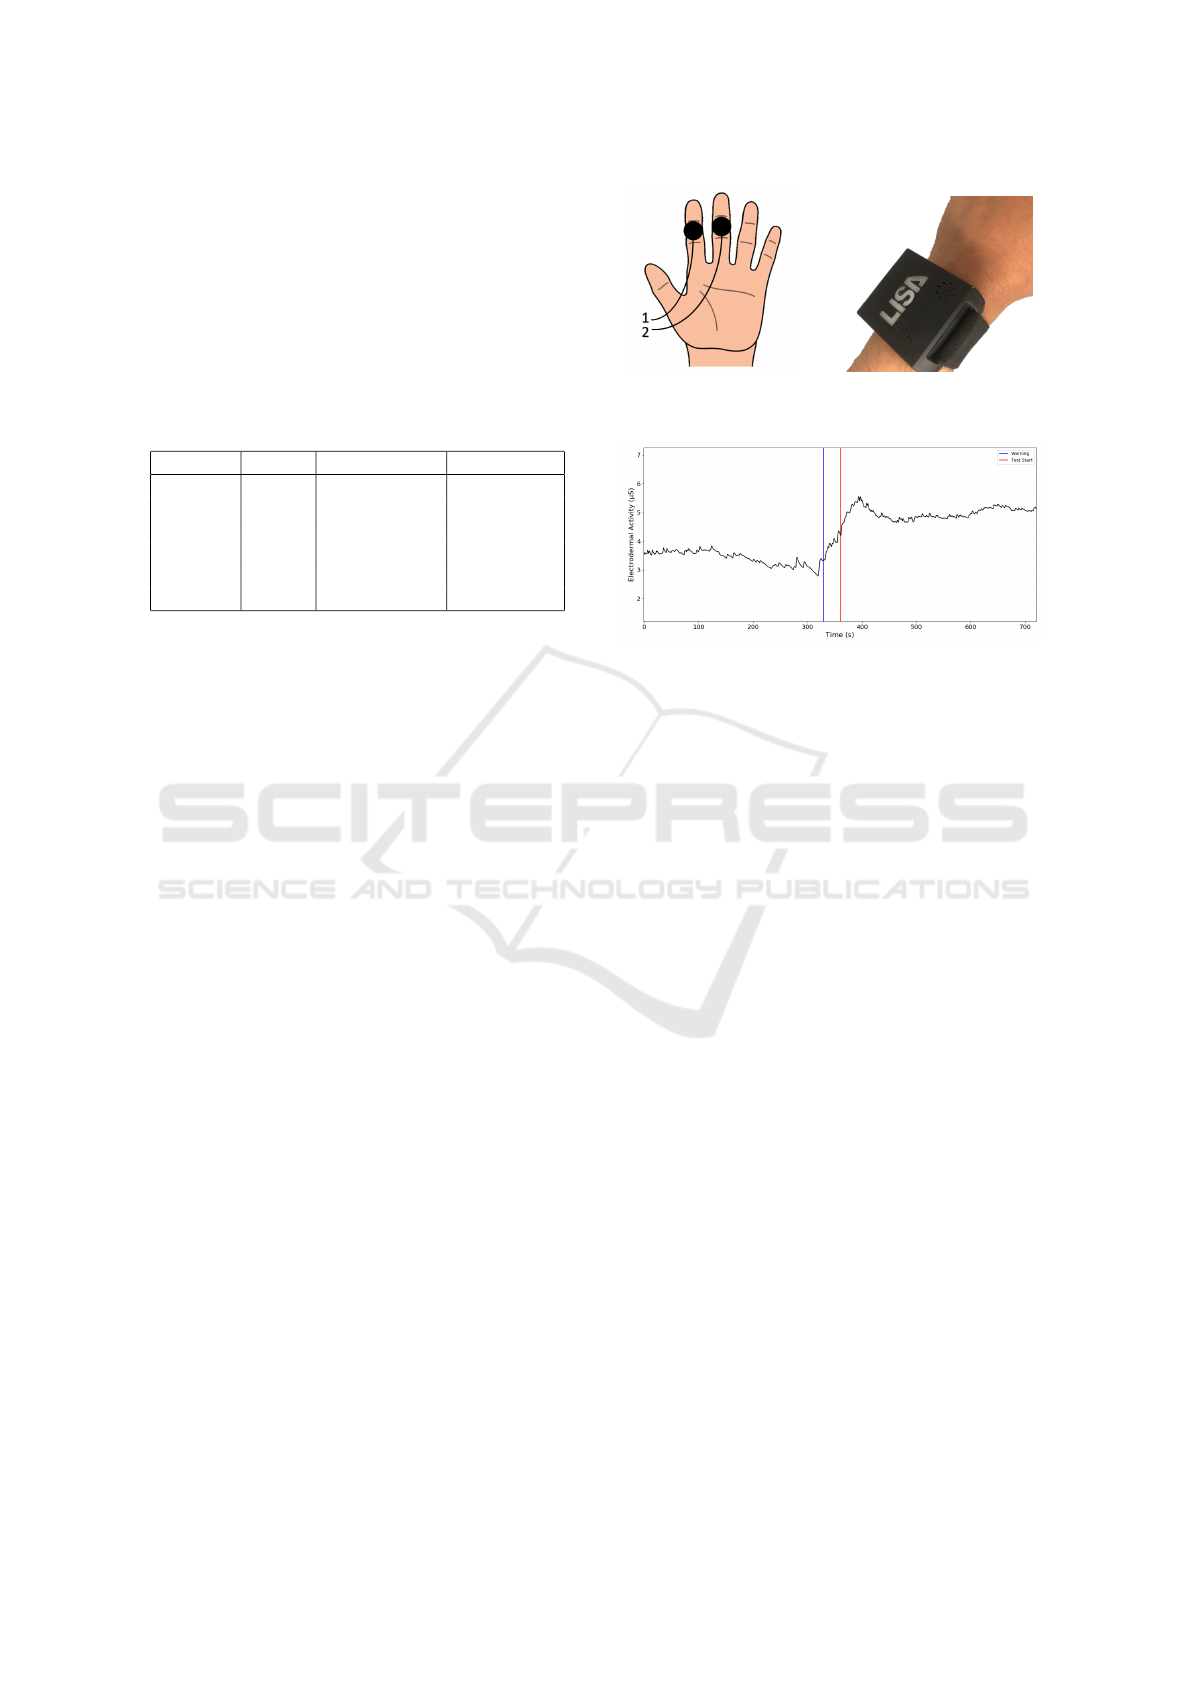
entire experiment, specially in the left arm. PPG and
EDA signals were recorded simultaneously using the
wearable device described in section 2.2. The EDA
signals were recorded attaching the electrodes to the
anterior middle phalanges of the 2nd finger (Position
1 in Fig.1(a) ) and 3rd finger (Position 2 in Fig.1(a) )
of the left hand. The PPG signal was recorded on the
posterior distal left wrist, as shown in Fig.1(b).
After placing the wearable device and the EDA
spare sensor, the PVSAT test was explained to the
subjects. The PVSAT was presented to induce stress
in the last 6-min, in a 12.2” tablet with white single
numbers from 1 to 9, on a black screen. The digits
were presented with a 3s rate for the first 2min, de-
creasing half a second every two minutes (2.5s and
2s). The subjects had to respond prior to the presenta-
tion of the next digit, and speak aloud each response.
A warning 30s before the beginning of the PVSAT
was given to all participants (Blue line in Fig.2). In
baseline status, the subjects were asked not to speak.
(a) EDA. (b) PPG.
Figure 1: Recording sites for the biosignals.
Figure 2: Representation of the warning and start of the
PVSAT. EDA signal increases at the warning 30s before the
PVSAT starts (Blue line). The start of the PVSAT is repre-
sented by the Red line (Brennan et al., 2001).
2.4 Data Processing
2.4.1 PPG Peak Detection
HRV features were acquired with PPG signals. In or-
der to detect the systolic peaks in the PPG, the al-
gorithm implemented is based on the work perfomed
by (Kuntamalla et al., 2014). This algorithm applies
a 2nd order lowpass Butterworth filter at 2 Hz, fol-
lowed by a 2nd order highpass Butterworth filter at
0.1 Hz. Then it detects the peaks and valleys of the
PPG wave, and computes the difference in amplitude
between the peaks and the valleys. After calculating
this difference, the algorithm will search for the dif-
ferences that are greater than 50% of a 5-point win-
dow moving average, discarding the peaks that do not
satisfy this criteria. This process is then repeated un-
til the number of peaks between two consecutive it-
erations is the same. The systolic peaks detected are
shown in Fig.3.
2.4.2 Heart Rate Computation
Heart rate is obtained by calculating the interval be-
tween two consecutive systolic peaks, detected with
the algorithm in section 2.4.1. In order to remove arti-
facts influence or errors in the detection of the peaks,
RR intervals lower than 380 ms were removed due
to physiological conditioning, as a normal heart cy-
cle lasts at least 380 ms. The instantaneous heart rate
BIOSIGNALS 2019 - 12th International Conference on Bio-inspired Systems and Signal Processing
44
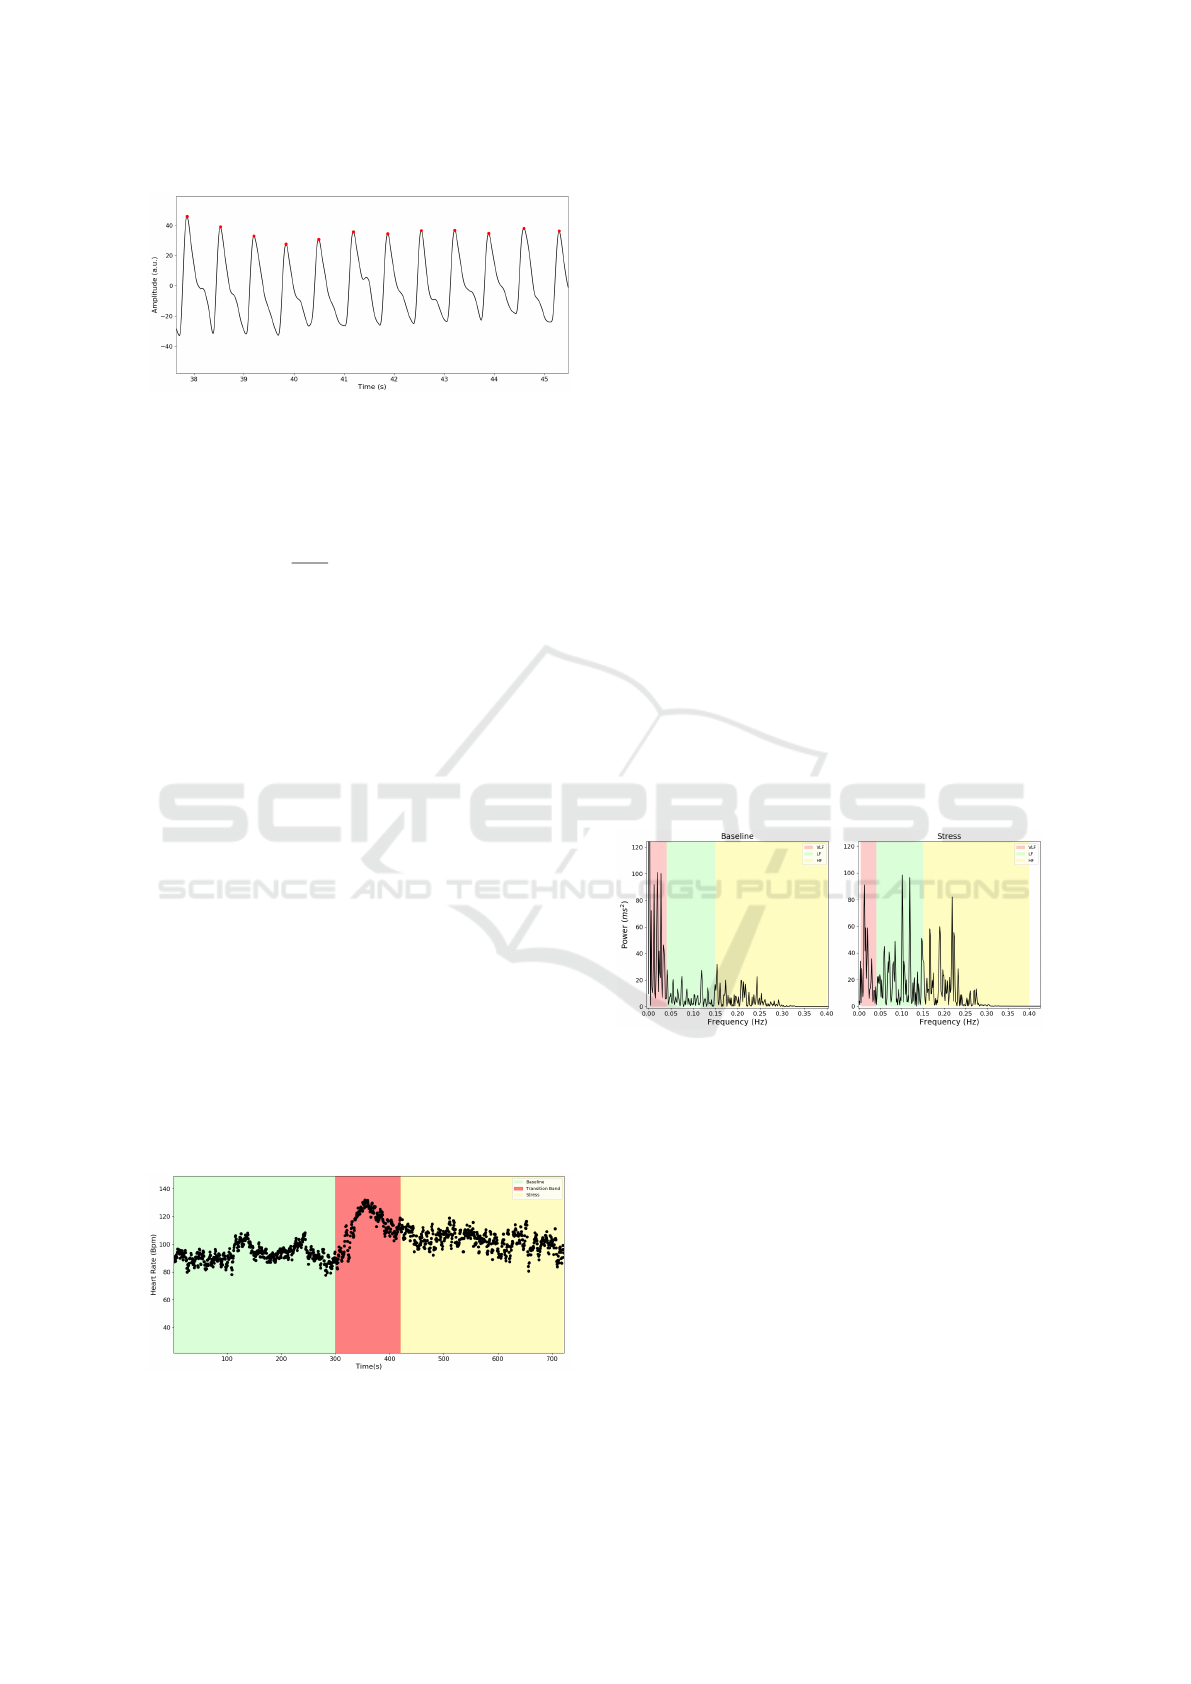
Figure 3: Peaks Detected (Red dots) with the algorithm im-
plemented.
(IHR) in beats per minute (Bpm) is given by equation
1.
IHR (Bpm) =
60
∆RR
; ∆RR = RR
i
− RR
i−1
; (1)
2.4.3 RR-interval Series Filtering
RR-interval series recorded from a wearable device
PPG sensor are subject to different kinds of artifacts
(Jang et al., 2014), as the most common are motion ar-
tifact, breathing artifact and ectopic beats, leading to
a wrong detection of the R-peak (Logier et al., 2004).
To correct the miscalculated peak, a 7-point mov-
ing average window was computed. If a RR-interval
differs more than 20% of the moving average, or if
the RR
i+1
is smaller than 75% of the value RR
i−1
,
those points are considered as a wrong detection (Lo-
gier et al., 2004). Then, a linear interpolation is com-
puted to replace each interval considered as a wrong
detection.
2.4.4 HRV Features
Time-domain features and frequency-domain were
calculated to quantify HRV, in 5-min segments for
baseline and stress. The time between the 5th and
7th minute, was considered to be the transition band,
where heart rate changes significantly from baseline
to stress (Fig.4).
Figure 4: HRV data division in 5-min segments. Baseline
status - 0-min to 5-min (Green band), Stress status - 7-min
to 12-min (Yellow band). The Red band corresponds to the
excluded Transition band.
Statistical features related to the variance of
RR-intervals, such as SDNN, RMSSD, NN50
and pNN50, were computed for 5-min recordings
(Vollmer, 2015; Guidelines, 1996).
The 5-min Poincar
´
e plot represents the diagram in
which each RR interval is plotted against the previous
RR interval. From the Poincar
´
e plot it is possible to
extract non-linear variables, such as SD1, SD2 and
SD2/SD1 ratio, that reflects the balance between the
SNS and PNS (Hsu et al., 2012).
Frequency-domain features were also computed.
The RR-interval series are an irregularly time-
sampled series, though it is necessary to resample the
series, to avoid the appearance of additional harmonic
components in the power spectrum. Resampling was
performed at a frequency of 10 Hz.
The power spectrum for baseline status (at rest)
and stress status (perfoming the PVSAT) (Fig.5), was
computed using a periodogram, applying to each seg-
ment, a Hanning window. Then, the Fast Fourier
Transform (FFT) was calculated for each windowed
segment. Very-low (VLF), low (LF), high (HF) fre-
quency components and total power were obtained by
integrating the power in each frequency band. The
normalized frequency components were calculated by
dividing the LF and HF power, by the total power mi-
nus the power of the VLF band (Guidelines, 1996).
Figure 5: HRV power spectrum. The left spectrum corre-
sponds to a Baseline status and the rigth spectrum corre-
sponds to the Stress status. VLF (0.0033-0.04 Hz) - Red
band, LF (0.04-0.15 Hz) - Green band, HF (0.15-0.4 Hz) -
Yellow band.
2.4.5 EDA Features
In terms of EDA recordings, time-domain features
were computed, by dividing the data into four seg-
ments: two bands of 2-min each in baseline (Baseline
1, Baseline 2) and in stress (Stress 1, Stress 2). The
Red band in Fig.6, 4th to 6th minute, was considered
the transition band, where EDA level changes signif-
icantly, due to the warning of the start of the PVSAT
test, 30s before the start.
Time-domain features were extracted by applying
a 4th order lowpass Butterworth filter at 1 Hz. Then
Heart Rate Variability and Electrodermal Activity in Mental Stress Aloud: Predicting the Outcome
45
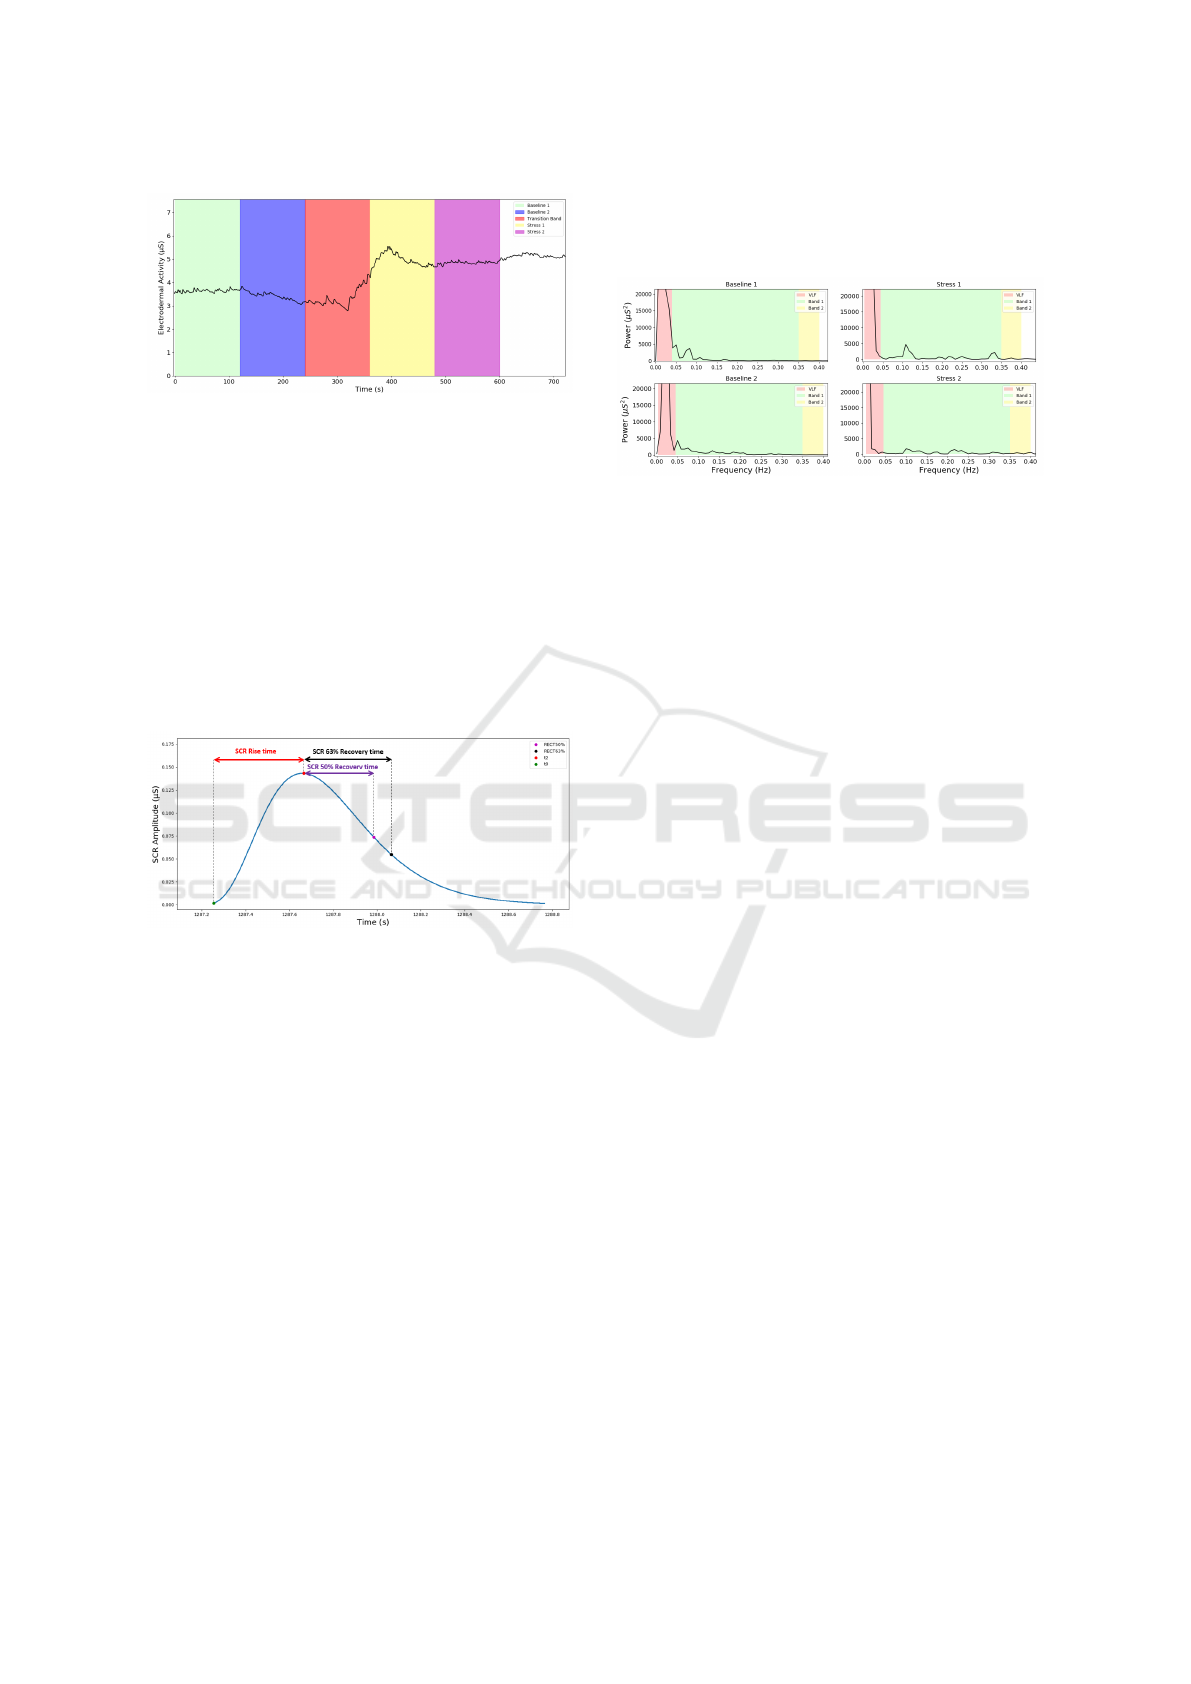
Figure 6: EDA data division in 2-min segments. Baseline
1 - 0-min to 2-min (Green Band), Baseline 2 - 2-min to 4-
min (Blue band), Stress 1 - 6-min to 8min (Yellow band),
Stress 2 - 8-min to 10-min (Purple band). The Red band
corresponds to the Transition band.
the model proposed by (Gamboa and Fred, 2008),
computed the SCR component. From the SCR wave-
form, time domain features such as SCR amplitude,
Rise time, Recovery Time 50% (Rec.t 50%) and Re-
covery Time 63% (Rec.t 63%), were obtained as
shown in Fig.7. A threshold of 0.005 µS was applied.
The SCL component was obtained by subtracting the
total EDA signal by the SCR component.
Figure 7: SCR features. The green mark corresponds to
1% of the maximum value (t0), the red mark corresponds
to the maximum value of the peak (t2), the purple and the
black mark correspond to the values in which the amplitude
decreases, respectively, 50% and 63%.
Frequency-domain analysis was also performed
(Posada-Quintero et al., 2018). After filtering the
EDA signal, the signals was downsampled. Down-
sampling from 1000 Hz to 1 Hz was performed in
three steps using consecutive factors of 1/10. Then
the signals was highpass filtered with a 8th order But-
terworth filter at 0.01 Hz, to remove any trend.
The power spectrum was computed using a peri-
odogram, applying to each segment, a Blackman win-
dow. Then, the FFT was calculated for each win-
dowed segment. The frequency band to assess the
activity of the SNS through EDA used by Posada-
Quintero et al., was modified to the frequency band
of 0.04-0.35 Hz. Finally, the power for Band 1 (0.04-
0.35 Hz) and Band 2 (0.35-0.50 Hz). The normal-
ized frequency components were calculated by divid-
ing Band 1 and Band 2 power, by the total power,
to verify if there was an increase in power on Band
1 during the stress situation, in order to confirm the
stimulation of the SNS (Fig.8).
Figure 8: EDA power spectrum. VLF (0-0.045 Hz) - Red
band, Band 1 (0.045-0.35 Hz) - Green band, Band 2 (0.35-
0.5 Hz) - Yellow band.
2.5 Statistical Analysis
Statistical tests analysis were performed in order to
assess the significance of the results obtained, be-
tween the baseline and stress features.
Kruskal-Wallis test is a non-parametric test, so
it means that is does not assume the normality of
data nor the homoscedaticity (standard deviation are
equal). The H-test uses ranked values, so the values
observed are converted to their ranks. The Kruskal-
Wallis null-hypothesis is that the mean ranks of the
different groups are the same (McDonald, 2014).
Probabilities lower than the significance level of 5%
(p-value< 0.05) were considered significant, con-
cluding that the null hypothesis may not adequately
explain the observation - there is in fact variation be-
tween the ranked means of the groups.
Chi-square test χ
2
was also applied to test the
goodness of fit in section 3.2. This test is applied to
determine whether a categorical variable from a sin-
gle population is consistent with a hypothesized dis-
tribution. The null hypothesis is that the categorical
data has the given frequencies (Cochran, 2013). In
the context of this paper, the χ
2
test will be applied
to determine the goodness of the fit of the linear re-
gression line performed, by comparing the values ob-
served calculated using the regression line obtained,
with the expected values. Probabilities higher than the
significance level of 5% (p-value< 0.05) lets us con-
clude that the difference between the observed values
and the expected values is minimized, so the linear
regression is a good fit.
2.6 Machine-Learning
Machine-learning algorithms were applied in order to
classify the data.
BIOSIGNALS 2019 - 12th International Conference on Bio-inspired Systems and Signal Processing
46
Support Vector Machines (SVM) algorithms for
learning two-class discriminant functions from a set
of training examples were applied, in order to find a
suitable boundary (hyperplane), in data space to sep-
arate two classes. The basis of this boundary is the
concept of margin, which is the minimal distance be-
tween the hyperplane separating the two classes and
the closest points to it, defined as the support vectors.
In linearly separable data, the kernel of SVM used is
the maximal margin classifier or hard margin SVM
(Vapnik, 1999).
Random Forest classifiers are based on the Deci-
sion Tree algorithm. Decision Trees are a supervised
method of classification in machine learning, using
pre-classified data. The division of the data is based
on the values of features of the given data, by de-
ciding which features, best divide ir, creating a set
of rules for the values of each feature. The Random
Forest classifier is a combination of multiple decision
trees, where each decision tree is made by randomly
selecting portions of the data, reducing the correla-
tion between trees, improving the prediction power
and results with a higher efficiency (Breiman, 2001;
Donges, 2018).
3 RESULTS
The results obtained showed that the PVSAT induced
stress to the subjects, reflected by the increase in heart
rate and in EDA features, such as SCR and SCL, dur-
ing stress.
Frequency analysis of EDA, also confirmed the
activation of the sympathetic nervous system with an
increase in Band 1 power in stress.
For HRV, the results obtained for spectral mea-
sures were opposite to the expected. It was expected
to verify an increase in LF(nu) and LF/HF ratio dur-
ing stress, but no significant result was found for
frequency-domain features.
Despite no significance was obtained in
frequency-domain features for HRV, a thorough
analysis of these spectral characteristics, revealed
that in some subjects the LF(nu) decreased in stress,
while in other subjects there was an increase in
stress. Actually, within the 15 subjects that were
analyzed, there was a division of 8 subjects in which
LF(nu) decreased during stress, and 7 subjects that
LF(nu) increased during stress. So, when analyzing
the group as a whole, it is possible that the opposite
responses cancels out the LF(nu) results. Therefore,
two distinct groups were formed: group 1 consisted
of subjects which LF(nu) decreased during stress,
and group 2 consisted of subjects which LF(nu)
increased during stress. Then, all features for HRV
were analyzed for each group.
For group 1, the results showed a significant in-
crease in HF(nu) power, LF(nu) power and LF/HF ra-
tio. For group 2, the results showed significant effect
only for Bpm and RR interval .
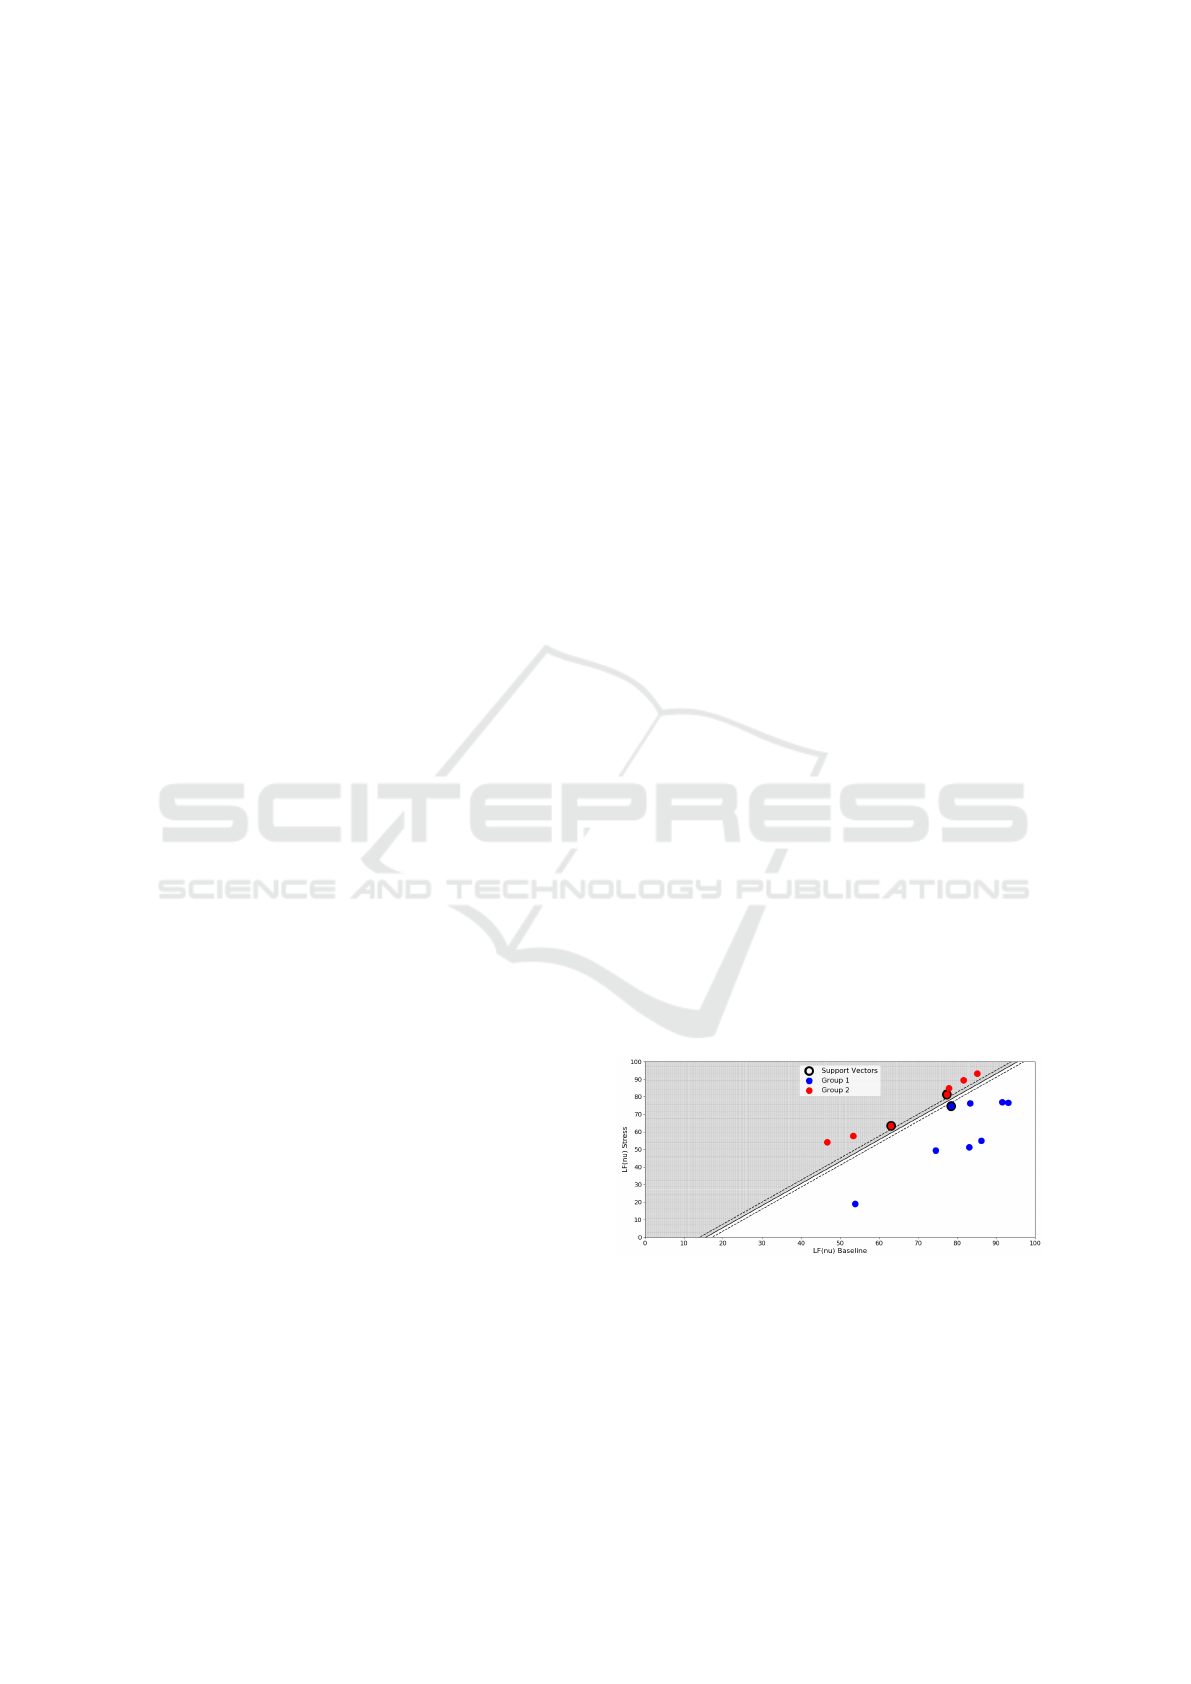
3.1 Support Vector Machines
In this section, SVM were applied to try separate by a
hyperplane the two different responses of the subjects
to stress: decrease in LF(nu) and increase in LF(nu)
(see Fig.9). This separation is based on the work of
Vuksanovic et al. (Vuksanovi
´
c and Gal, 2007), that
verified this distinct response to stress, but in respect
to HF power.
First, a binary classification of each group was ap-
plied: Group 1 - Decrease in LF(nu) was classified as
Y = −1 and Group 2 - Increase in LF(nu) was classi-
fied as Y = 1. The decision function obtained to sep-
arate the two groups is given by equation 2, where
w
1
and w
2
represents, respectively, the weights for
groups 1 and 2, ~x
1
and ~x
2
represents, respectively, a
point for group 1 (Blue circles in Fig.9) and group 2
(Red circles in Fig.9).
w
1
.~x
1
+ w
2
.~x
2
+ b = 0 (2)
The results obtained for the weights and the b
parameter were: w
1
= −0.31, w
2
= 0.25 and b =
4.85. The number of support vectors for each
group were: Group 1 - 1 support vector, Group
2 - 2 support vectors. The coordinates ([LF(nu)
Baseline, LF(nu) Stress]) of the support vectors
(Black not filled circles in Fig.9) for each group
were: Group 1 - [78.48,74.64] and in Group 2 -
[77.35,81.25];[63.08,63.41].
Figure 9: SVM Group Separation by the hyperplane:
−0.31.~x
1
+0.25.~x
2
+4.85 = 0. Blue circles - Group 1. Red
circles - Group 2. The support vectors are the points with
black border.
Heart Rate Variability and Electrodermal Activity in Mental Stress Aloud: Predicting the Outcome
47
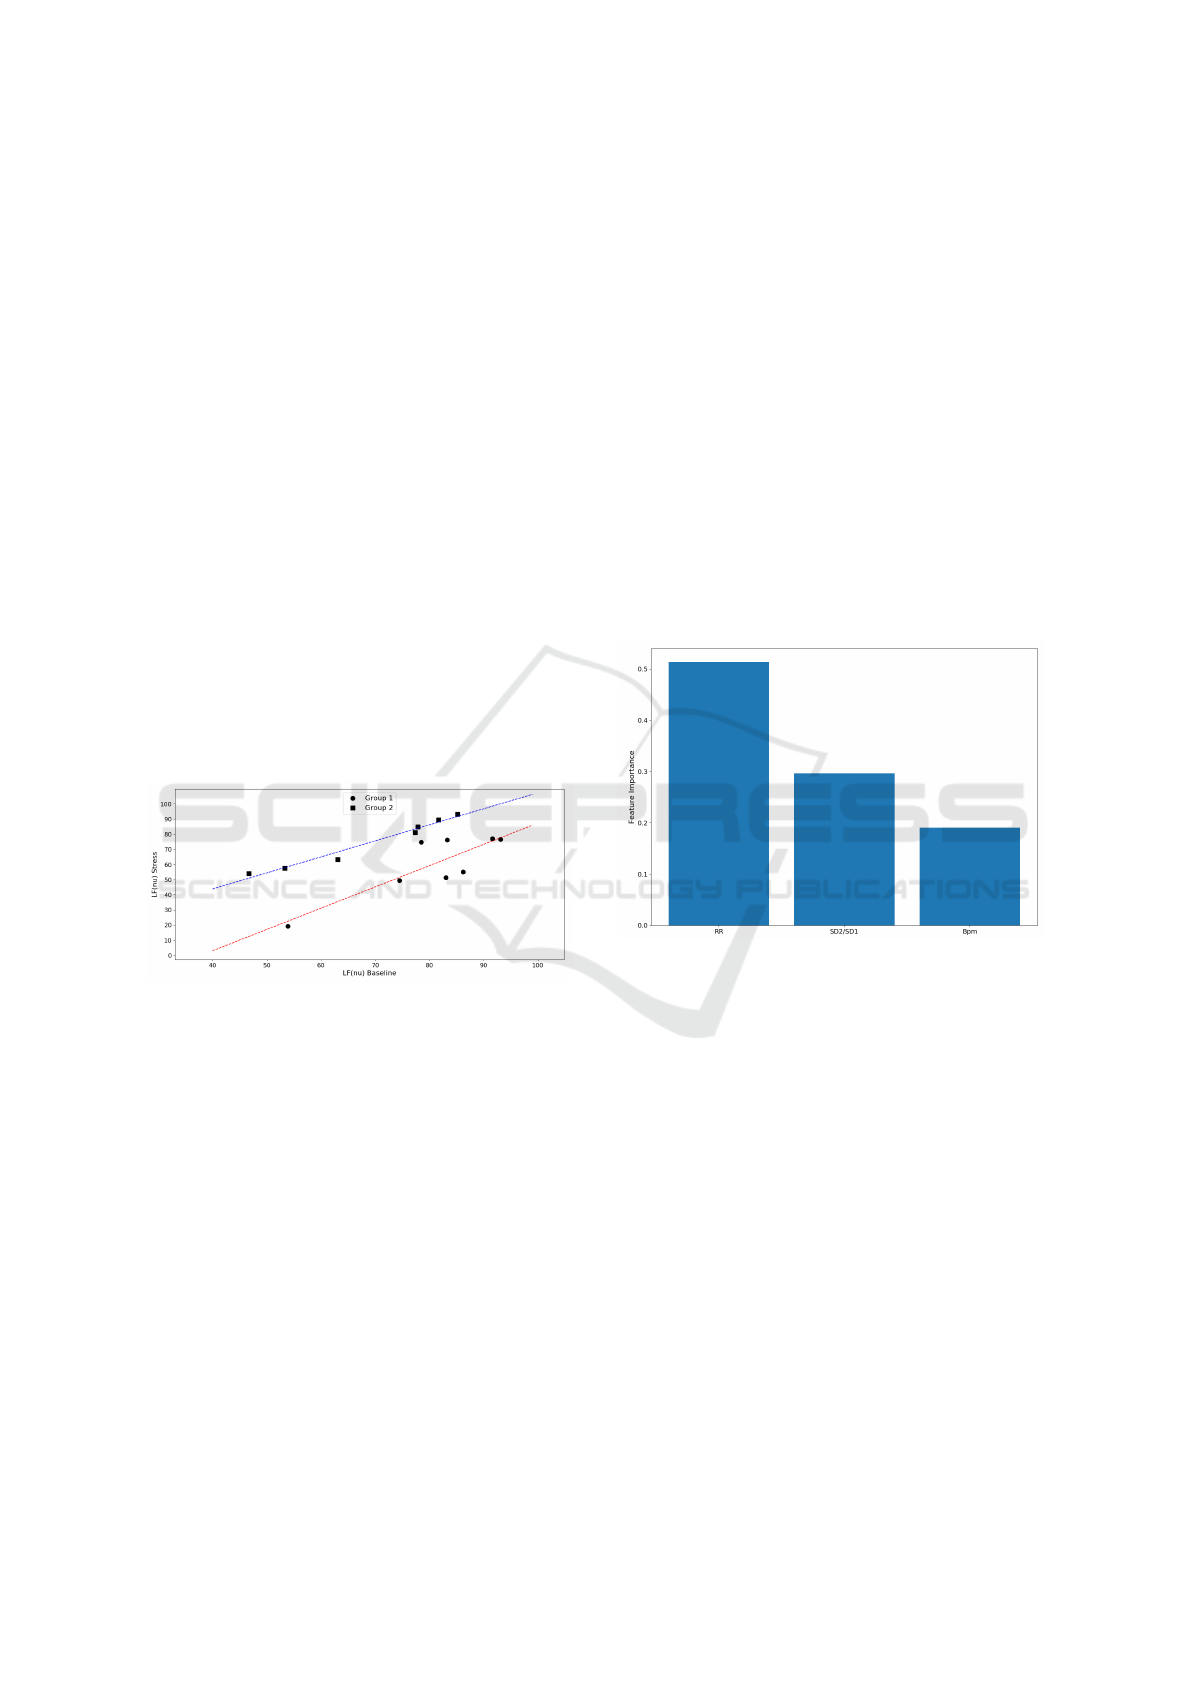
3.2 Linear Regression
In session 3.1, the results showed that the responses of
the groups were parallel, so it was possible to predict
the LF (nu) values during stress based on the base-
line values for each group separately. A linear regres-
sion was then computed for each group (Fig.10). For
Group 1 regression (Red line in Fig.10), the following
regression line was obtained: LF(nu) Stress = 1.40 ×
LF(nu) Baseline − 53.15,r
2
= 0.728. For Group 2 re-
gression (Blue line in Fig.10), the regression line ob-
tained was LF(nu) Stress = 1.06 × LF(nu) Baseline +
1.48,r
2
= 0.972.
Finally, a chi-squared test for goodness of fit was
applied to the regression lines, comparing the ex-
pected values with the observed values using the re-
gression line obtained. For group 1 the chi-square re-
sult was χ
2
(6) = 12.785; p = 0.047 and for group 2
was χ
2
(5) = 0.674; p = 0.984. With the results ob-
tained for the χ
2
statistic, it is possible to reject at a
significance level of 5%, the null hypothesis for group
1, concluding that the fit of the regression line is not
adequate, while for group 2, with a p-value=0.984 it
is possible to accept the null hypothesis, concluding
that the fit of the regression line is suitable.
Figure 10: Linear Regression for each group. Group
1 regression line (Red line): LF(nu) Stress = 1.40 ×
LF(nu) Baseline − 53.15, r
2
= 0.728; Group 2 regression
line (Blue line): LF(nu) Stress = 1.06 × LF(nu) Baseline +
1.48,r
2
= 0.972.
3.3 Random Forest Classifier
In section 3.1, it was possible to separate the subjects
into two groups, by evaluating their response to stress,
with an increase or a decrease in LF(nu) during stress.
As this separation is based on a frequency-domain
feature, requiring the recording of the data for at least
10 minutes (5-min in baseline, 5-min in stress), in or-
der to predict the subject’s response to a situation of
stress in a shorter recording time, a classification of
the subjects using only time-domain features for both
HRV and EDA, was performed, to classify the sub-
jects into the two different groups obtained in the pre-
vious section.
This classification was performed with a random
forest classifier, with 10 decision trees, and a Gini
criteria to assess the impurity and the quality of the
split. Training of the classifier was performed with
a cross validation method, using 6 different random
splits and a test sample of 30% of the subjects. This
process was repeated 100 times, so that it was possi-
ble to choose the model that best classifies the data,
that is, the model with a higher accuracy score for the
cross validation training method.
First, a random forest classifier using only the
following time-domain features for HRV was per-
formed: Bpm, RR-interval and SD2/SD1 ratio. Then,
the importance of each feature is plotted in figure 11.
From this figure, we verify that RR-interval is the
most important feature in this model, followed by the
SD2/SD1 ratio and the Bpm. The accuracy score for
this model to classify correctly each subject to the cor-
responding group was approximately 80%.
Figure 11: Feature Importance for HRV features obtained
with the random forest classifier.
In order to obtain a better visualization of the re-
gions defined by the random forest classifier, the fea-
tures boundaries are shown in a 3D graph (Fig. 12).
A subject with features coordinates that belong to the
blue region will be assigned to group 1 - decrease in
LF(nu), and subjects that belong to the red region will
be assigned to group 2 - Increase in LF(nu).
Information related to EDA was added to the classi-
fier. Similarly to the previous classifier, in order to
reduce the recording time, only time-domain features
for EDA were added to the classifier. The following
features for EDA were selected: SCR, SCL and Rise
Time. The more accurate estimators were selected,
with the corresponding decision trees. The impor-
tance of each feature in plotted in figure 13. The ac-
curacy score for this model was approximately 77%.
BIOSIGNALS 2019 - 12th International Conference on Bio-inspired Systems and Signal Processing
48
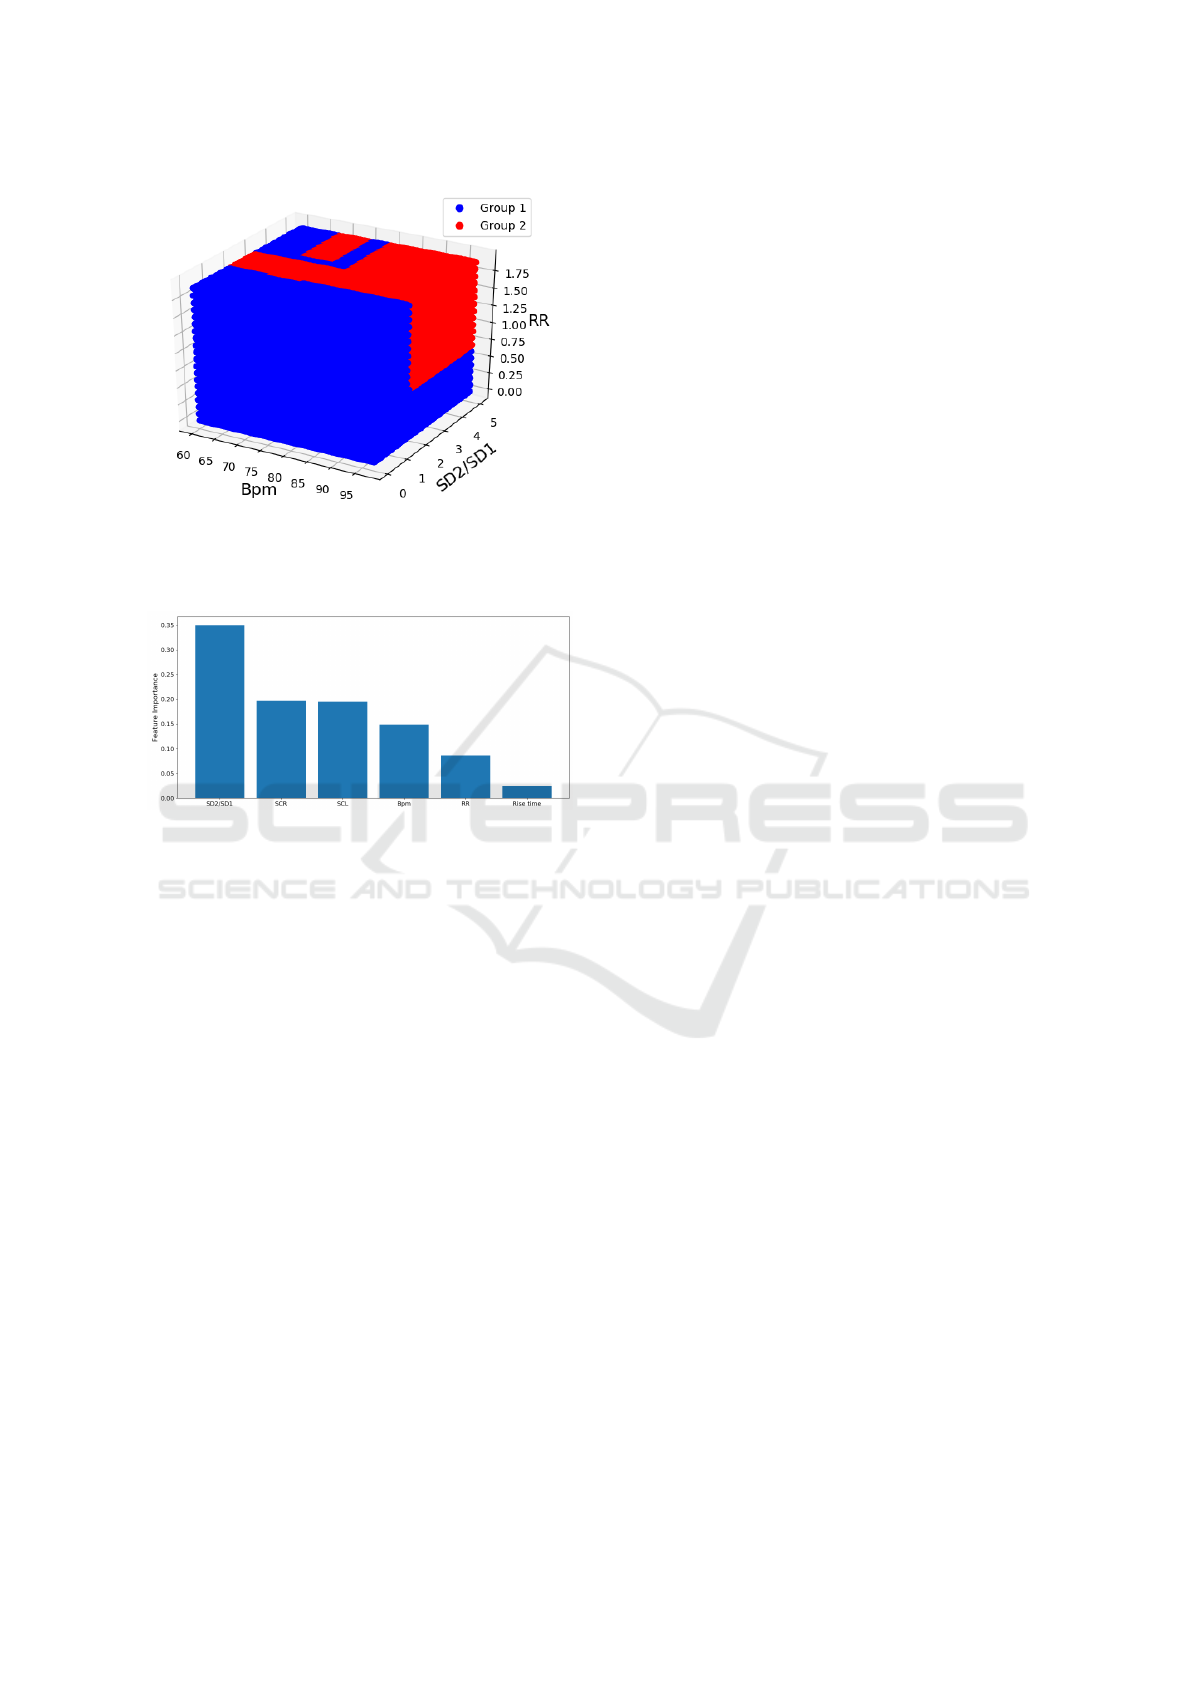
Figure 12: 3D Decision Surface for the Random Forest
Classifier. Features selected: Bpm, SD2/SD1 and RR-
interval (s). Blue region - Group 1 and Red region - Group
2.
Figure 13: Feature Importance for HRV and EDA features
obtained with the random forest classifier.
4 DISCUSSION
This was a pilot study to see the influence of stress
induction on the autonomous nervous system, by pro-
cessing HRV and EDA from a wearable device.
The results obtained in section 3, showed that the
arithmetic test (PVSAT) induced stress to the sub-
jects, reflected by the increase in heart rate (Bpm)
and in EDA features, such as, SCR and SCL, during
stress.
For EDA features, SCR, SCL, Rise time, Rec.t
50% and Rec.t 63%, revealed to be good markers of
stress, with the increase of values during all the seg-
ments studied during stress compared to the baseline
segments. In section 2.4.5, the frequency analysis of
EDA signals was performed to confirm the activation
of the sympathetic nervous system with an increase
in power for low frequency bands. The results ob-
tained showed that there was a significant increase in
Band 1 power. This confirms that the dynamics of
the sympathetic nervous system are confined to low
frequencies, in agreement with the work performed
by Posada et al., although in this paper the frequency
band studied was extended more 0.10 Hz, the increase
in power was also verified, making frequency analysis
of EDA a potential marker of quantitative assessment
of the level of stress and sympathetic nervous system
impairments (Posada-Quintero et al., 2016a).
For HRV, the results obtained for spectral mea-
sures were opposite to the expected. The inducement
of stress in subjects was expected to increase LF(nu)
and LF/HF ratio (Visnovcova et al., 2013; Hjortskov
et al., 2004; Vuksanovi
´
c and Gal, 2007). Contrarily
to the expectation, the results obtained showed that
there was a decrease in LF(nu) and LF/HF ratio dur-
ing stress, results also reported by (Tharion et al.,
2009; Vuksanovi
´
c and Gal, 2007; Hjortskov et al.,
2004). Vuksanovic et al. reported that vocalization
of the answers, assigned to parasympathetic activity,
during the PVSAT interfered with the spectral anal-
ysis and concealed out the changes in spectral mea-
sures of HRV (Vuksanovi
´
c and Gal, 2007). Lange-
witz et al. showed that the breathing pattern for some
subjects during vocalization affects the low frequency
band power, as the breathing frequency falls in the
0.1 Hz frequency band, the resonance phenomenon
will not increase the power in the LF band (Lange-
witz and Ruddel, 1989), concluding that the fact sub-
jects answered the PVSAT aloud might have influ-
enced the spectral measures of HRV. These facts also
show that the LF band does not reflect purely the car-
diac response to the activation of the sympathetic ner-
vous system, but a mixture of the sympathetic and
parasympathetic systems, with counteracting effects
of activation of the sympathetic system and with-
drawal of the parasympathetic system (Sloan et al.,
1991). From the point of view of humoral mecha-
nisms, these results can be explained, as, during a
situation of stress, the sympathetic nervous system
affects the heart through release of catecholamines
(Terkelsen et al., 2005), such as epinephrine, lead-
ing to an increase in heart rate without changing heart
rate variability measures, as the release of epinephrine
does not affect spectral measures (Ahmed et al.,
1994).
In section 3.1, despite the results for HRV were
concealed out when analyzing the subjects as a whole,
it was possible to verify significant changes in spec-
tral measures for HRV after separating the subjects
into the two different groups, based on the work per-
formed by Vuksanovic et al., and as an exploratory
method in order to find a pattern, taking into account
that subjects can exhibit distinct response when sub-
mitted to stress. From figure 10, it is possible to see
that the slopes for each group do not intercept with
one another, so the two responses are parallel. For
group 2, the results obtained were in agreement with
Heart Rate Variability and Electrodermal Activity in Mental Stress Aloud: Predicting the Outcome
49

the expectations that during stress, the LF(nu) and
the LF/HF ratio increased with a small decrease in
HF(nu) power with no significance. This group re-
sponds to stress with the withdrawal of the parasym-
pathetic nervous system and the activation of the sym-
pathetic nervous system. For group 1, the results
showed significant decrease in LF(nu) and LF/HF ra-
tio during stress and significant increase in HF(nu)
power. The simultaneous increase in HF(nu) and
heart rate is more difficult to explain, although it could
be an influence of complex respiratory pattern (Vuk-
sanovi
´
c and Gal, 2007), or it could be the effect of
different co-activation humoral mechanims, caused
by compensatory sympatho-adrenal activation with
catecholamine release into the circulation (Terkelsen
et al., 2005).
In terms of EDA, both groups showed an increase
in Band 1 power, although significance was only
found in group 2 between baseline 2 and stress 1 seg-
ments. It is possible to conclude that even if there is
a distinct response to stress in terms of HRV, there is
activation of the sympathetic nervous system during
the stress situation, due to the fact that the sympa-
thetic nervous system influences the heart and sweat
through distinct hormones, respectively, epinephrine
and acetylcholine.
Finally, the classification model implemented in
section 3.3, showed that it was possible to predict the
type of response for each subject during stress, using
only their baseline features for both HRV and EDA
features, making it possible to classify the subjects
into the two different groups, with an accuracy of ap-
proximately 80% for HRV features in baseline and an
accuracy of approximately 77% for HRV and EDA
simultaneous features. This model assumes to be a
good asset for future assessment of the type of re-
sponse when the subjects are under a stress situation.
REFERENCES
Ahmed, M. W., Kadish, A. H., Parker, M. A., and Gold-
berger, J. J. (1994). Effect of physiologic and pharma-
cologic adrenergic stimulation on heart rate variabil-
ity. Journal of the American College of Cardiology,
24(4):1082–1090.
Allen, J. (2007). Photoplethysmography and its application
in clinical physiological measurement. Physiological
Measurement, 28(3).
Bansal, D., Khan, M., and Salhan, A. (2009). A Review of
Measurement and Analysis of Heart Rate Variability.
In 2009 International Conference on Computer and
Automation Engineering, pages 243–246.
Benedek, M. and Kaernbach, C. (2010). A continuous mea-
sure of phasic electrodermal activity. Journal of Neu-
roscience Methods, 190(1):80–91.
Bolanos, M., Nazeran, H., and Haltiwanger, E. (2006).
Comparison of heart rate variability signal features de-
rived from electrocardiography and photoplethysmog-
raphy in healthy individuals. In Annual International
Conference of the IEEE Engineering in Medicine and
Biology - Proceedings, pages 4289–4294.
Boucsein, W. (2012). Electodermal Activity. Second edi
edition.
Breiman, L. (2001). Random forests. Machine Learning,
45(1):5–32.
Brennan, M., Palaniswami, M., and Kamen, P. (2001).
Do existing measures of Poincare
´
e plot geome-
try reflect nonlinear features of heart rate variabil-
ity? IEEE Transactions on Biomedical Engineering,
48(11):1342–1347.
Bussmann, B. (1998). Differentiation of autonomic nervous
activity in different stages of coma displayed by power
spectrum analysis of heart rate variability. pages 46–
52.
Cochran, W. G. (2013). The χ2 Test of Goodness of Fit. The
Annals of Mathematical Statistics, 23(3):315–345.
Donges, N. (2018). The Random Forest Algorithm.
Gamboa, H. and Fred, A. (2008). Electrodermal Activity
Model. Psychophysiology, (April):30.
Guidelines (1996). Guidelines Heart rate variability. Euro-
pean Heart Journal, 17:354–381.
Guyton, A. C. and Hall, J. E. (2011). Textbook of Medical
Physiology.
Hamilton, J. L. and Alloy, L. B. (2016). Atypical reactivity
of heart rate variability to stress and depression across
development: Systematic review of the literature and
directions for future research.
Hjortskov, N., Riss
´
en, D., Blangsted, A. K., Fallentin, N.,
Lundberg, U., and Søgaard, K. (2004). The effect of
mental stress on heart rate variability and blood pres-
sure during computer work. European Journal of Ap-
plied Physiology, 92(1-2):84–89.
Hsu, C. H., Tsai, M. Y., Huang, G. S., Lin, T. C., Chen,
K. P., Ho, S. T., Shyu, L. Y., and Li, C. Y. (2012).
Poincar
´
e plot indexes of heart rate variability detect
dynamic autonomic modulation during general anes-
thesia induction. Acta Anaesthesiologica Taiwanica,
50(1):12–18.
Jang, D.-G., Park, S., Hahn, M., and Park, S.-H. (2014).
A Real-Time Pulse Peak Detection Algorithm for the
Photoplethysmogram. International Journal of Elec-
tronics and Electrical Engineering, 2(1):45–49.
Kleckner, I. R., Jones, R. M., Wilder-Smith, O., Worm-
wood, J. B., Akcakaya, M., Quigley, K. S., Lord, C.,
and Goodwin, M. S. (2017). Simple, Transparent, and
Flexible Automated Quality Assessment Procedures
for Ambulatory Electrodermal Activity Data.
Kuntamalla, S., Ram, L., and Reddy, G. (2014). An Ef-
ficient and Automatic Systolic Peak Detection Algo-
rithm for Photoplethysmographic Signals. Interna-
tional Journal of Computer Applications, 97(19):975–
8887.
Langewitz, W. and Ruddel, H. (1989). Spectral analysis of
heart rate variability under mental stress. J Hypertens
Suppl, 7(6):S32—-3.
BIOSIGNALS 2019 - 12th International Conference on Bio-inspired Systems and Signal Processing
50

Logier, R., De Jonckheere, J., and Dassonneville, A. (2004).
An efficient algorithm for R-R intervals series filter-
ing. Conference proceedings : ... Annual International
Conference of the IEEE Engineering in Medicine and
Biology Society. IEEE Engineering in Medicine and
Biology Society. Conference, 6:3937–3940.
McDonald, J. H. (2014). Kruskal–Wallis test - Handbook
of Biological Statistics.
Miranda Dantas, E., Lima Sant’Anna, M., Varej
˜
ao Andre
˜
ao,
R., Pereira Gonc¸alves, C., Aguiar Morra, E., Perim
Baldo, M., Lam
ˆ
cgo Rodrigues, S., and Geraldo Mill,
J. (2012). Spectral analysis of heart rate variabil-
ity with the autoregressive method: What model or-
der to choose? Computers in Biology and Medicine,
42(2):164–170.
Parsons, T. D. and Courtney, C. G. (2014). An initial val-
idation of the Virtual Reality Paced Auditory Serial
Addition Test in a college sample. Journal of Neuro-
science Methods, 222:15–23.
Posada-Quintero, H., Florian, J., Orjuela-Ca
˜
n
´
on, A., and
Chon, K. (2018). Electrodermal activity is sensitive
to cognitive stress under water. Frontiers in Physiol-
ogy, 8(JAN):1–8.
Posada-Quintero, H. F., Florian, J. P., Orjuela-Ca
˜
n
´
on, A. D.,
Aljama-Corrales, T., Charleston-Villalobos, S., and
Chon, K. H. (2016a). Power Spectral Density Anal-
ysis of Electrodermal Activity for Sympathetic Func-
tion Assessment. Annals of Biomedical Engineering,
44(10):3124–3135.
Posada-Quintero, H. F., Florian, J. P., Orjuela-Ca
˜
n
´
on,
´
A. D.,
and Chon, K. H. (2016b). Highly sensitive index of
sympathetic activity based on time-frequency spectral
analysis of electrodermal activity. American Journal
of Physiology - Regulatory, Integrative and Compara-
tive Physiology, 311(3):R582–R591.
Posada-quintero, H. F. and Hall, S. (2016). Electrodermal
Activity : What it can contribute to the Assessment of
the Autonomic Nervous System. page 24.
Posada-quintero, H. F., Member, S., Chon, K. H., and Mem-
ber, S. (2016). Frequency - Domain Electrodermal
Activity Index of Sympathetic Function. pages 497–
500.
Royan, J., Tombaugh, T. N., Rees, L., and Francis, M.
(2004). The Adjusting-Paced Serial Addition Test
(Adjusting-PSAT): Thresholds for speed of informa-
tion processing as a function of stimulus modality and
problem complexity. Archives of Clinical Neuropsy-
chology, 19(1):131–143.
Sloan, R. P., Korten, J. B., and Myers, M. M. (1991). Com-
ponents of heart rate reactivity during mental arith-
metic with and without speaking. Physiology and Be-
havior, 50(5):1039–1045.
Terkelsen, A. J., Mølgaard, H., Hansen, J., Andersen, O. K.,
and Jensen, T. S. (2005). Acute pain increases heart
rate: Differential mechanisms during rest and mental
stress. Autonomic Neuroscience: Basic and Clinical,
121(1-2):101–109.
Tharion, E., Parthasarathy, S., and Neelakantan, N. (2009).
Short-term heart rate variability measures in students
during examinations. National Medical Journal of In-
dia, 22(2):63–66.
Tombaugh, T. N. (2006). A comprehensive review of
the Paced Auditory Serial Addition Test (PASAT).
Archives of Clinical Neuropsychology, 21(1):53–76.
Vapnik, V. N. (1999). An overview of statistical learn-
ing theory. IEEE transactions on neural networks /
a publication of the IEEE Neural Networks Council,
10(5):988–99.
Visnovcova, Z., Calkovska, A., and Tonhajzerova, I. (2013).
Heart Rate Variability and Electrodermal Activity As
Noninvasive Indices of Sympathovagal Balance in Re-
sponse To Stress. Acta Medica Martiniana, 13(1):5–
13.
Vollmer, M. (2015). A robust, simple and reliable mea-
sure of heart rate variability using relative RR inter-
vals. Computing in Cardiology, 42(6):609–612.
Vuksanovi
´
c, V. and Gal, V. (2007). Heart rate variabil-
ity in mental stress aloud. Medical Engineering and
Physics, 29(3):344–349.
Zoltan, G.-S. (2013). Wavelet transform based HRV analy-
sis. The 7th International Conference Interdisciplinar-
ity in Engineering (INTER-ENG 2013), 12:105–111.
Heart Rate Variability and Electrodermal Activity in Mental Stress Aloud: Predicting the Outcome
51
