
Comparing Parkinson’s Disease Dysarthria and Aging Speech using
Articulation Kinematics
A. Gómez-Rodellar
1
, D. Palacios-Alonso
2
, J. Mekyska
3
, A. Álvarez-Marquina
1
and
P. Gómez-Vilda
1
1
Neuromorphic Speech Processing Lab, Center for Biomedical Technology, Universidad Politécnica de Madrid,
Campus de Montegancedo, 28223 Pozuelo de Alarcón, Madrid, Spain
2
Escuela Técnica Superior de Ingeniería Informática, Universidad Rey Juan Carlos, Campus de Móstoles, Tulipán,
s/n, 28933 Móstoles, Madrid, Spain
3
Department of Telecommunications, Brno University of Technology, Technicka 10, 61600 Brno, Czech Republic
Keywords: Parkinson’s Disease, Neuromorphic Speech Processing, Neurotechnology, Aging Speech, e-Health.
Abstract: Speech is being considered a pervasive and costless means to detect and monitor neurodegenerative disease
progression. Many different approaches have been reported to differentiate normative subject speech from
neurodegenerative patient speech. Most of them are focussed on statistical pattern recognition approaches to
improve detection results on a baseline, considering only patient speech and normative controls. The
definition of a normative control is not well established in itself, usually being subjects free of any pathology
aligned in the same age range as patients. But one question which is not taken into account is the effects of
aging in healthy controls, as usually neurodegenerative diseases may include mostly patients affected by
certain effects, as dysphonia or dysarthria, as a consequence of aging. The present research introduces a
methodology based on information theory to compare the effects produced by aging dysarthria with those due
to Parkinson’s Disease, using the statistical distribution of speech articulation kinematics as a marker. On the
one hand, it may be concluded that articulation kinematics is substantially different for PD and HC with
respect to normative subjects. On the other hand, this does not seem to be the case between PD and HC
subjects, as these subsets may share some dysarthric features which may be contributed more by aging than
by neuromotor degeneration. This differentiation problem needs to be evaluated as well in the case of
phonation features, otherwise there will not be full guarantee in using phonation features to assess neuromotor
degeneration. In this sense new methodologies have to be designed to distinguish neurodegenerative from
aging speech granting better guarantees.
1 INTRODUCTION
Neurodegenerative diseases have a clear effect on
speech, both in phonation, articulation, prosody and
fluency. Parkinson’s Disease (PD) is among the most
prevalent neurodegenerative diseases, affecting
around 5 million people over age 50 in the 15 world
most populated countries in 2005, doubling by 2030
(Dorsey et al., 2007). Typical symptoms associated to
PD are bradykinesia, rigidity, freezing of gait, frozen
facial mask (hypomimia), postural sway, and distal
limb resting tremor, among others (Dauer and
Przedborski, 2003, Jankovic, 2008; Sapir, 2014;
Anizah et al., 2018). It is well known that speech is
strongly related to axial symptoms (Gobermann,
2005; Cantiniaux et al., 2010; Ricciardi et al. 2016).
Phonation, articulation, prosody and fluency are
speech characteristics strongly affected by PD.
Phonation symptoms (musculus vocalis hypotonia),
vocal fold unbalance and tremor (altered neuromotor
feedback) are some ways in which the
neurodegeneration manifests. Articulatory instability
is observed mainly as reduced vowel space and vowel
centralization distortion (Sapir et al., 2010).
Dysprosody and dysfluency are also common
symptoms having received attention (Goberman,
Blomgren and Metzger, 2010; Martens, et al., 2015).
A view of the most comprehensive studies in the field
can be found in Tsanas et al. (2010), Rusz et al.
(2013), Mekyska et al. (2015), and Brabenec et al.
(2017). The objective of this study is to compare
articulation in PD patients and aging healthy controls
against a normative population, using kinematic
features estimated from formants, relying on
Information Theory to determine if the steady jaw
control necessary to maintain a vowel in its precise
articulation place is similarly affected by aging voice
52
Gómez-Rodellar, A., Palacios-Alonso, D., Mekyska, J., Álvarez-Marquina, A. and Gómez-Vilda, P.
Comparing Parkinson’s Disease Dysarthria and Aging Speech using Articulation Kinematics.
DOI: 10.5220/0007355700520061
In Proceedings of the 12th International Joint Conference on Biomedical Engineering Systems and Technologies (BIOSTEC 2019), pages 52-61
ISBN: 978-989-758-353-7
Copyright
c
2019 by SCITEPRESS – Science and Technology Publications, Lda. All rights reserved
than by PD or not and quantify in thus wat the
divergence of pathological and aging articulation
with respect to normative subjects, to pinpoint
differences and similarities. Recent studies have
shown that a relationship can be established between
formant-based articulation features and jaw-tongue
kinematic activity. This relationship allows to
estimate the jaw-tongue kinematics from formant
dynamics. The mutual information contents from
probability density functions of jaw-tongue kinematic
activity estimated from formant-based articulation
features may be used as dysarthria markers when
comparing PD speech with normative speech
(Gómez, P. et al., 2018). The neuromotor character of
these markers has been validated by facial surface
electromyography and accelerometry (sEMG and
3DAcc), as shown in (Gomez, A. et al., 2018).
Building on this relationship, the purpose of the
present work is to explore if these dysarthria markers
are affected differently in presbyphonic dysarthria
(characteristic of aging speech) than in PD dysarthria.
The structure of the paper is as follows: Section 2 is
devoted to explain the foundations of the jaw-tongue
kinematics related with speech articulation
modelling, the distributions describing the statistical
behaviour of the kinematic variables associated with
articulation, and the validation of the kinematic
correlates. Section 3 describes the databases of
normative, healthy controls and patients, used in the
differentiation experiments, and the mutual
information estimation methods. Section 4 gives a
complete description and discussion of the results
produced by the differentiation experiments, both as
tables and as figures representing the proximity or
distance of each sample to the average of the
reference sets (nominally, normative and healthy
controls). Finally, section 5 is devoted to highlight the
conclusions derived from the presented results.
2 ARTICULATION KINEMATICS
2.1 Jaw-Tongue Biomechanical Model
Speech articulation depends on the position and shape
of vocal tract structures, such as the jaw, tongue, lips
and velo-pharynx, among others (Buchaillard, Perrier
and Payan, 2009). These structures are controlled by
different muscles, which are activated by neuromotor
pathways from cranial nerves (Jürgens 2002). The
acoustical characteristics of speech sounds depends
on the positions of these structures and on their
dynamic displacement. In the present paper, the role
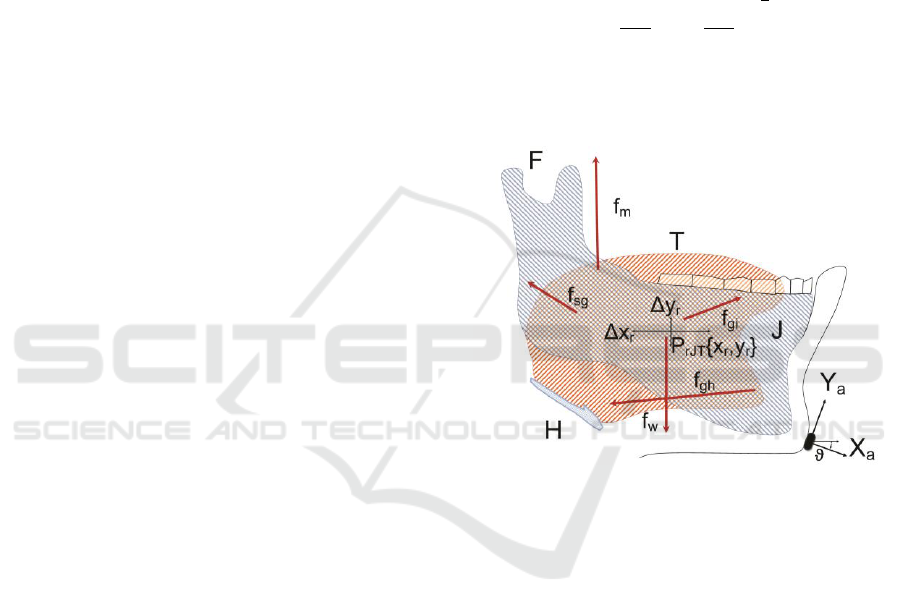
of the jaw-tongue system, as depicted in Figure 1 will
be studied when affected by neuromotor degeneration
induced by PD. The jaw-tongue biomechanical
system is considered to be a third-order lever with
lumped mass load concentrated in the reference point
P
rJT
{x
r
, y
r
} (Hannam et al., 2008). Harmonic
oscillation {Δx
r
, Δy
r
} around the fulcrum (F:
attachment to the skull) is assumed under forces
acting on this system. A very relevant kinematic
correlate of the jaw-tongue neuromotor activity is the
Absolute Kinematic Velocity (AKV) of the reference
point PrJT:
(1)
The statistical distribution of the AKV will
contribute valuable information in characterizing
unstable articulation, as explained in the sequel.
Figure 1: Jaw-Tongue Model. F: Fulcrum; T: Tongue; J:
Jaw bone; H: Hyoid bone; f
sg
: stylo-glossus force; f
m
:
masseter force; f
gi
: glosso-intrinsic forces; f
gh
: genio-hyoid
force; f
w
: gravity; X
a
,
Y
a
: accelerometer normal and
tangential; Δx
r
, Δy
r
: horizontal and vertical displacements
of the reference point (P
rJT
) in the sagittal plane.
2.2 A Kinematic Articulation Correlate
The methodology of this research is based on
representing speech articulation kinematics
(positions, speeds, forces and accelerations) by means
of acoustically-derived information (speech
formants; Dromey, Jang and Hollis, 2013). An
important question on the use of kinematic features
derived from acoustic correlates (the first and second
formants: F
1
and F
2
) is to which extent formant
dynamics can be related to articulation kinematics
(positions and velocities of the jaw-tongue centre of
masses). The assessment of the AKV as a reliable
kinematic correlate of articulation is carried on the
multi-signal recording framework described in
Comparing Parkinson’s Disease Dysarthria and Aging Speech using Articulation Kinematics
53
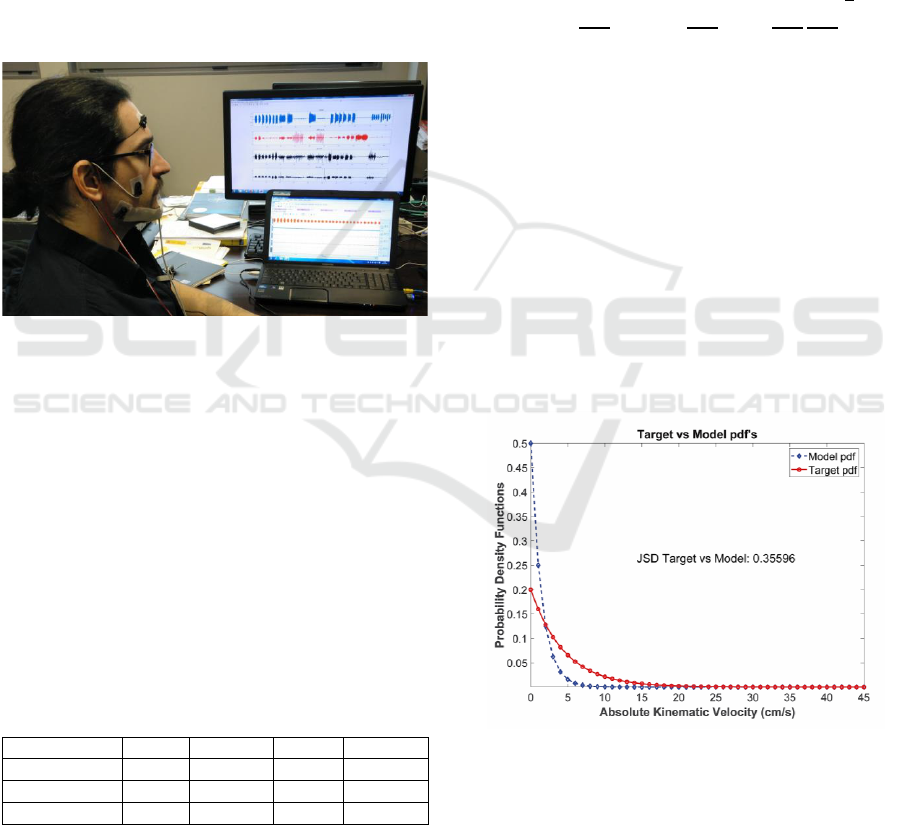
Figure 2. The experimental validation of using
acoustic information (formant-based dynamics) to
represent articulation kinematics was based on a
diadochokinetic exercise, consisting in the fast and
continuous repetition of the diphthong [aj:], at a rate
of 2-3 repetitions per second. Inverse adaptive
filtering was used to estimate the vocal tract transfer
function from running speech in real time (Deller,
Proakis and Hansen, 1993). F
1
and F
2
are evaluated
from the vocal tract transfer function obtained from
inverse filtering. Surface electromyography on the
masseter (sEMG) and three-channel accelerometry
(3DAcc) were recorded synchronously with speech.
Sampling rates of sEMG and 3DAcc were equalized
to 500 Hz, as well as formant estimates.
Figure 2: Recording set-up for Signal acquisition of speech,
accelerometry and surface electromyography (sEMG).
The validation of formant dynamics to represent
kinematic variables was based on linear regression
according to the following relational chain: surface
electromyography (sEMG) is related to the force on
the masseter (f
m
), which on its turn is related to
vertical acceleration (yAcc), resulting in vertical
displacement (Δy
r
), changing the vertical articulation
position, which induces changes in the first two
formants (ΔF
1
, ΔF
2
). The results of regression studies
among the different dynamic variables are given in
Table 1.
Table 1: Regression results for the diadochokinetic
validation exercise. r: correlation coefficient; p: p-value; S:
Spearman’s coefficient; P: Pearson’s coefficient.
Correlation
r (S)
p (S)
r (P)
p (P)
Δy
r
vs f
m
0.83
<0.001
0.81
<0.001
ΔF
1
vs Δy
r
-0.89
<0.001
-0.89
<0.001
ΔF
2
vs Δy
r
0.78
<0.001
0.79
<0.001
The correlation between the masseter force
estimate from sEMG (f
m
) and the vertical
displacement of the reference point (Δy
r
) is high and
statistically relevant (0.83/0.81), showing that a
strong relationship exists between neuromotor
activity and movement, as expected. The correlation
between vertical displacement (Δy
r
) and formant
changes are also high and relevant, stronger and
counter-related with respect to ΔF
1
(-0.89), than with
respect to ΔF
2
(0.78/0.79). These results are aligned
with the relationship between the variable controlling
the phonation opening (Δy
r
) and the variation of the
first formant (ΔF
1
). Once the relationship between
kinematics and acoustics has been established and
validated, the displacement of the reference point of
the jaw-tongue system when observed over time
could be described from an estimate of (1) as:
(2)
where F
1
and F
2
are the first two formants, and B
1
, B
2
and B
12
are quadratic scaling factors relating
movement and acoustics (Gómez, A., et al., 2018).
The distribution of the AKV values as a probability
density function (AKV pdf) gives a full statistical
description of the jaw-tongue kinematics, and of the
kinetic energy which is involved in speech
production. The shape of the AKV probability density
function will be that of a χ
2
(Chi-square) distribution
with two degrees of freedom, which is typically
associated with thermodynamic processes, justifying
the use of the term “low articulation temperature”
associated to hypokinetic dysarthria, an example of
these distributions shown in Figure 3.
Figure 3: Two ideal probability density functions associated
to the AKV in terms of their respective “temperatures”. The
model distribution would be associated to the AKV pdf of
a maintained vowel from an idealized normative speaker,
whereas the target distribution is the typical behaviour of a
vowel from a PD patient.
It must be considered that the behaviour of the
AKV pdf is quite different according to the kinematic
study being carried on. When steady vowels are
BIOSIGNALS 2019 - 12th International Conference on Bio-inspired Systems and Signal Processing
54
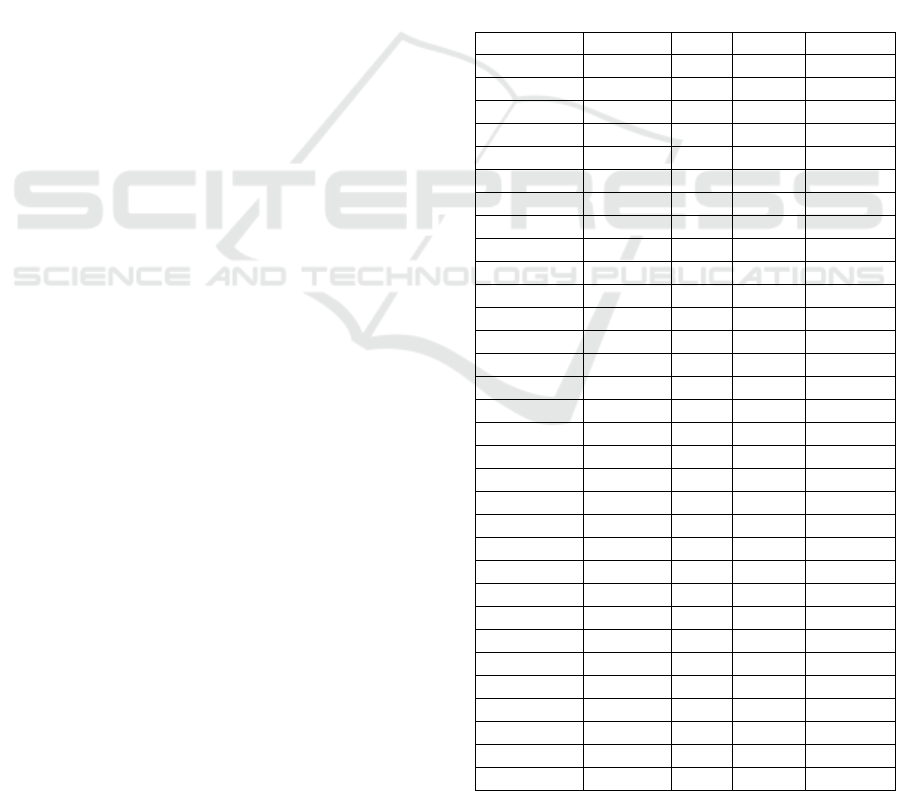
produced, as in single maintained vowel exercises, it
is expected that a normative speaker would keep a
highly stable jaw-tongue position (low temperature)
with most of the absolute velocities under a given
value (dash-diamond curve), whereas the PD patient
will produce unstable oscillations of the articulation
point (high temperature) extending along the
horizontal axis (full-bullet curve). The situation in
running speech, where wide oscillations of the
reference point will be expected is to be the opposite:
the normative speaker will produce wider and faster
oscillations (higher temperature) than the PD patient
affected by hypokinetic dysarthria (lower
temperature). This fact points to a complete different
strategy in testing sustained vowels than in running
speech or dyadochokinetic exercises.
3 MATERIALS AND METHODS
3.1 Patient Data Sets
In the present study the articulation stability in
maintained vowels has been used to assess the
capability of these tests in differentiating the
behaviour of PD patients from healthy controls within
the same age range, when compared with a normative
reference set considered the golden rule in maintained
vowel phonation. For such, a three band study has
been conducted in terms of the mutual information
between AKV pdf’s from PD patients and paired
healthy controls, and with respect to normative
speakers, using correlation results from confronting
the three sets of speakers among themselves in terms
of Jensen-Shannon Distance (JSD). Estimates of the
AKV pdf have been used to evaluate the JSD between
two different distributions. Vowel utterances [a:, i:,
u:] from 8 male and 8 female PD patients randomly
selected from male and female databases within an
age range of 66.3±8.6 and 69±7.7 years (respectively)
have been processed and statistically modelled to
produce a PD database (MPD from male subjects, and
FPD for female ones). Similar vowel utterances from
another set of 8 male and 8 female control subjects
randomly selected from male and female databases
within an age of 65.6±8.9 and 61.8±9.1 years old
(respectively) have also been processed and
statistically modelled to produce a healthy control
database (MHC from male subjects and FHC from
female ones). Recordings were taken at 16 kHz and
16 bits. The database (PARCZ) was collected at St.
Anne’s University Hospital in Brno (Czech
Republic), including also demographic and clinical
information from each patient as gender, age, time
since first diagnosis, scores of the Unified
Parkinson’s Disease Rating Scale, part III (UPDRS-
III: motor examination), and part IV (UPDRS-IV:
complications of therapy), freezing of gait
questionnaire (FOG-Q), non-motor symptoms scale
(NMSS), REM sleep disorders (RBDSQ), mini-
mental state examination (MMSE), Addenbrooke’s
cognitive evaluation revised (ACE-R), Beck
depression inventory (BDI), faciokinesis and
phonorespiratory competence. All patients signed an
informed consent form that was approved by the local
ethics committee. The speakers extracted from the
PARCZ database are PD patients with code P1xxx
(females) and P2xxx (males), and paired healthy
controls with code K1xxx (females) and K2xxx
(males), as described in Table 2.
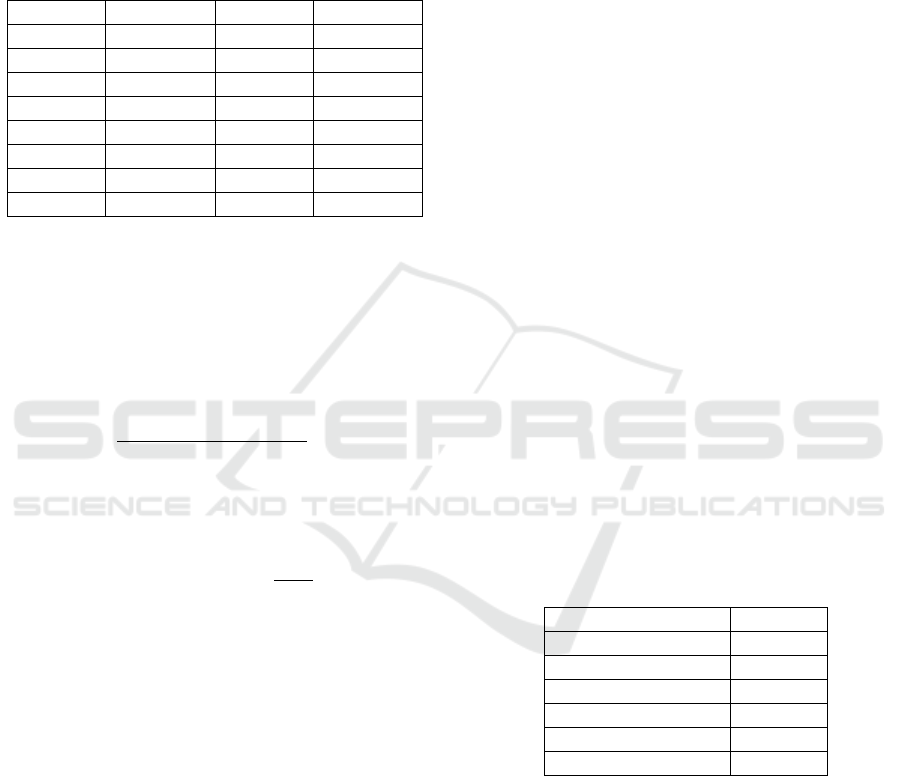
Table 2: PD patient and HC subject set lists (PD: PD patient
subject; HC: healthy control subject; UPDRS: Evaluation
according to UPDRS-III scale).
Code
Gender
Age
Cond
UPDRS
K1003-aiu
F
63
HC
-
K1004-aiu
F
65
HC
-
K1005-aiu
F
59
HC
-
K1006-aiu
F
64
HC
-
K1007-aiu
F
59
HC
-
K1012-aiu
F
67
HC
-
K1017-aiu
F
61
HC
-
K1018-aiu
F
45
HC
-
K2001-aiu
M
59
HC
-
K2002-aiu
M
68
HC
-
K2009-aiu
M
68
HC
-
K2010-aiu
M
83
HC
-
K2011-aiu
M
55
HC
-
K2013-aiu
M
54
HC
-
K2014-aiu
M
62
HC
-
K2015-aiu
M
76
HC
-
P1006-aiu
F
59
PD
24
P1007-aiu
F
76
PD
55
P1008-aiu
F
78
PD
23
P1020-aiu
F
64
PD
8
P1021-aiu
F
65
PD
5
P1022-aiu
F
72
PD
6
P1025-aiu
F
64
PD
8
P1026-aiu
F
76
PD
12
P2005-aiu
M
46
PD
25
P2009-aiu
M
66
PD
14
P2010-aiu
M
66
PD
39
P2012-aiu
M
71
PD
35
P2017-aiu
M
63
PD
19
P2018-aiu
M
63
PD
32
P2019-aiu
M
73
PD
12
P2023-aiu
M
73
PD
13
Comparing Parkinson’s Disease Dysarthria and Aging Speech using Articulation Kinematics
55
Finally, 8 male and 8 female subjects have been
randomly selected from a normative database
recorded at Hospital Gregorio Marañón, of Madrid,
Spain, within an age range of 3412.95 and 3713.37
(years) respectively. The list of subjects is given in
table 3.
Table 3: Normative subject set (NS).
Code
Gender/Age
Code
Gender/Age
N1004-aiu
M/23
N1105-aiu
F/43
N1005-aiu
M/21
N1108-aiu
F/22
N1008-aiu
M/45
N1112-aiu
F/20
N1009-aiu
M/33
N1116-aiu
F/45
N1011-aiu
M/49
N1117-aiu
F/25
N1018-aiu
M/29
N1120-aiu
F/33
N1020-aiu
M/35
N1121-aiu
F/57
N1026-aiu
M/39
N1125-aiu
F/38
3.2 Data Processing
The methodology proposed in the present study is
based on the mutual information between two given
probability density functions, p(x) and q(x) estimated
as a Jensen-Shannon Divergence (Endres and
Schindelin, 2003):
(3)
where DKL is a modified version of Kulback-
Leibler’s Divergence (Salicrú et al., 1994; Georgiou
and Lindquist, 2003) expressed as:
(4)
and m(x) is the average of p(x) and q(x). In the present
case, the probability functions p(x) and q(x) are
defined in the positive part of the real axis (x0).
Jensen-Shannon’s Divergence is symmetrical with
respect to p(x) and q(x), and it is normalized to the
interval [0, 1], a feature which is very helpful in
implementing clustering and classification. The
following procedure is used to estimate the JSD’s
between the PD set, the HC set and the NS set using
their AKV pdf’s:
• Recordings of the vowel set [a:, i:, u:] were
downsampled to 8 kHz.
• The vocal tract transfer function of the speech
segment was evaluated by an 8-pole adaptive
inverse lattice-ladder filter (Deller, Proakis and
Hansen, 1993) with a low-memory adaptive step
to grasp fine time variations. A complete
description of the adaptive filtering details can be
found in Gómez et al. (2009).
• The first two formants were estimated by
evaluating the maxima and slenderness of the
vocal tract transfer function (LP spectrogram).
The formant estimation resolution used was 2
Hz. Formants were estimated every 2 ms.
• The derivatives of the first two formants were
used to estimate the AKV following (2).
• The probability density function of the AKV was
estimated from the normalized histogram of
counts on the definition interval of the AKV (in
this case 0≤|v
r
|≤45 cm/s).
• The histograms were used to estimate probability
density functions by Kolmogorov-Smirnov
approximations (Webb, 2003).
• The average pdf for each subset was estimated. It
may be shown that the average of a set of pdf’s
shares the same properties of individual pdf’s.
Six average pdf’s were estimated: avMNS,
avFNS, avMHC, avFHC, avMPD and avFPD,
for the respective male and female normative,
controls and PD subsets.
• The Jensen-Shannon Divergence between each
patient’s histogram-derived distribution vs that
of the control subject were estimated as by (3)
4 RESULTS AND DISCUSSION
JSD’s between avMNS, avMHC and avMPD on one
side, and avFNS, avFHC and avFPD were estimated.
The divergences of the MPD vs MNS averages are
shown in table 4.
Table 4: JSD between male and female subset averages.
Datasets
JSD
avMPD vs avMNS
0.226
avMHC vs avMNS
0.244
avMPD vs avMHC
0.083
avFPD vs avFNS
0.311
avFHC vs avFNS
0.329
avFPD vs avFHC
0.092
The top template in Figure 4 shows the actual
appearance of the PD male sample AKV pdf’s in
dash-red, whereas the NS male AKV pdf’s are given
in full-blue. It may be easily seen that the NS set is
more concentrated towards the vertical axis, most of
the distributions having decayed on the interval
between 5-10 cm.s
-1
, whereas the PD set is more
spread over, with some activity still seen between 10-
30 cm.s
-1
and even beyond. The upper-right legend
gives the codes of the speaker samples included in the
tests. The bottom template in Figure 4 gives the
BIOSIGNALS 2019 - 12th International Conference on Bio-inspired Systems and Signal Processing
56
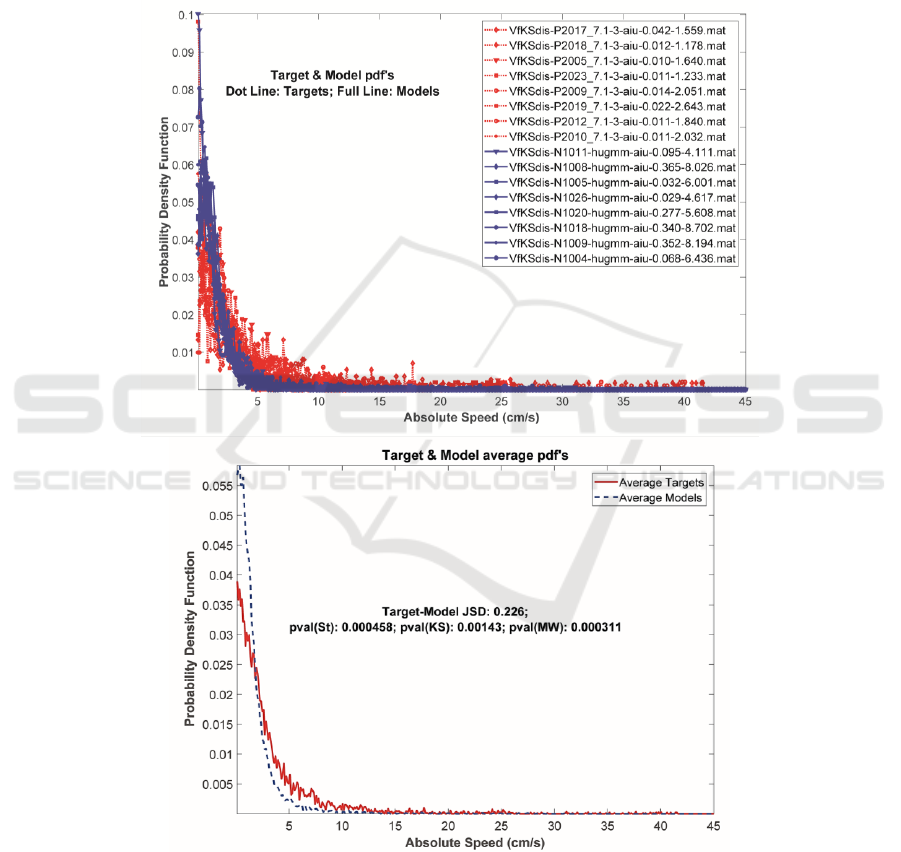
average pdf’s of the samples in the top template. The
different spreads of both average pdf’s may be clearly
seen now. The central legend gives the JSD between
both sets, as well as the results of the p-values after
Student’s, Kolmogorov-Smirnov’s, and Mann-
Whitney’s tests on Target and Model sets rejecting
the null hypothesis of equal means. The AKV pdf’s
from samples in the male and female subsets have
been obtained to be compared against the respective
normative and control subset averages (avMNS,
avMHC, for male samples, and avFNS and avFHC,
for female samples). Table 5 gives the JSD for each
sample. It may be seen that the divergence of the male
PD and HC average pdf’s with respect to the
normative one (MPD vs MNS and MHC vs MNS) is
quite similar and larger than when comparing PD and
HC (MPD vs MHC).
Figure 4: Top: AKV pdf’s of the PD male subset (dash-red lines) and the NS male subset (full-blue lines). The normative
subset is confined to lower absolute values than the PD subset. Bottom: Averages of normative (dash-blue) and PD (full-
red) pdf’s, showing the same behaviour. The JSD divergence between avMPD and av1MNS (0.226), and the p-values
rejecting the equal mean hypothesis by t-Student, Kolmogorov-Smirnov and Mann-Whitney tests are given in the middle.
Comparing Parkinson’s Disease Dysarthria and Aging Speech using Articulation Kinematics
57
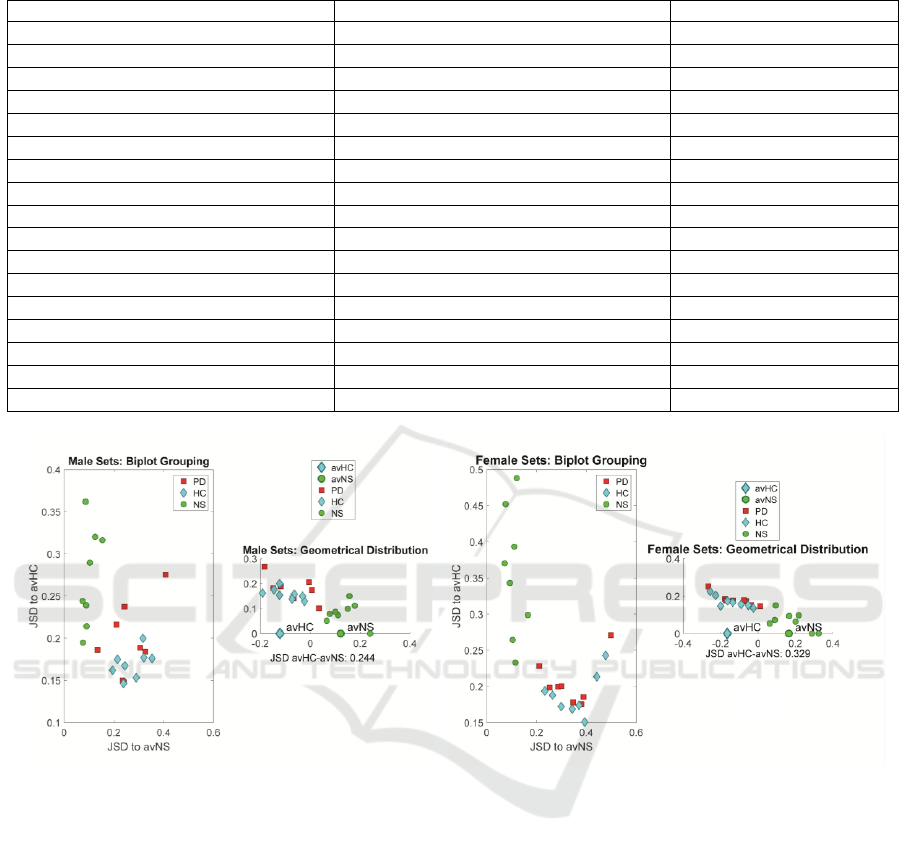
Table 5: JSD’s between PD, healthy control and normative sets with respect to normative and control averages.
MPD
avMNS
avMHC
MHC
avMNS
avMHC
MNS
avMNS
P2005-aiu
0.30570
0.18871
K2001-aiu
0.24403
0.16737
N1004-aiu
0.074096
P2009-aiu
0.23901
0.14816
K2002-aiu
0.28961
0.15321
N1005-aiu
0.103380
P2010-aiu
0.13407
0.18628
K2009-aiu
0.32015
0.17684
N1008-aiu
0.124710
P2012-aiu
0.20950
0.21612
K2010-aiu
0.19482
0.16206
N1009-aiu
0.075808
P2017-aiu
0.40723
0.27555
K2011-aiu
0.31634
0.19989
N1011-aiu
0.153810
P2018-aiu
0.32686
0.18397
K2013-aiu
0.35297
0.17601
N1018-aiu
0.086608
P2019-aiu
0.23515
0.14976
K2014-aiu
0.23895
0.14632
N1020-aiu
0.088998
P2023-aiu
0.24250
0.23716
K2015-aiu
0.21416
0.17490
N1026-aiu
0.090407
FPD
avFNS
avFHC
FHC
avFNS
avFHC
FNS
avFNS
P1006-aiu
0.38868
0.18533
K1003-aiu
0.37033
0.17377
N1105-aiu
0.072714
P1007-aiu
0.25251
0.19843
K1004-aiu
0.34321
0.16863
N1108-aiu
0.093113
P1008-aiu
0.49834
0.27077
K1005-aiu
0.23298
0.19368
N1112-aiu
0.115570
P1020-aiu
0.21117
0.22827
K1006-aiu
0.47693
0.24286
N1116-aiu
0.120860
P1021-aiu
0.37974
0.17551
K1007-aiu
0.39329
0.15067
N1117-aiu
0.110290
P1022-aiu
0.28630
0.19981
K1012-aiu
0.26424
0.18785
N1120-aiu
0.104500
P1025-aiu
0.34688
0.17790
K1017-aiu
0.29882
0.17209
N1121-aiu
0.165080
P1026-aiu
0.29915
0.20053
K1018-aiu
0.44165
0.21344
N1125-aiu
0.076065
Figure 5: Distribution of each male sample with respect to the male HC and NS averages. a) Bi-plot in terms of JSD respect
to the mormative and healthy control sets (males). b) Geometrical distribution with respect to the centroids avHC and avNH.
c) and d) Similar representations for the female sets. Red squares: PD samples. Blue diamonds: HC samples. Green bullets:
NS samples.
This is a first advancement on the difficulty of
separating subsets which are much closer themselves
than with respect to a golden rule set as NS. The same
observation may be derived for the female subset,
where FPD vs FNS and FHC vs FNS are much more
divergent than between themselves (FPD vs FHC). It
may be seen that the divergences of the PD subsets
with respect to the normative set averages are much
larger than their divergences with respect to the
healthy controls. The divergences of healthy controls
with respect to the normative subsets are almost as
large than those ones from PD subsets. This
observation may indicate that the healthy controls are
farther away from normative sets than expected in
terms of articulation kinematics. On the other hand,
the normative samples are closer to their average, as
expected. These results show that PD samples are
clearly diverging from normatives, and to some
extent from healthy controls. The question now is if
this divergence is statistically significant to assume
different information contents among pathologic,
control and normative subsets. The graphical
representation of the divergence among the different
subsets may help in understanding better the
relationships involved. The divergence between each
sample in the study and the normative and control
subset averages (avMNS and avMHC) is represented
graphically in the plots shown in Figure 5.
d)
c)
b)
a)
BIOSIGNALS 2019 - 12th International Conference on Bio-inspired Systems and Signal Processing
58
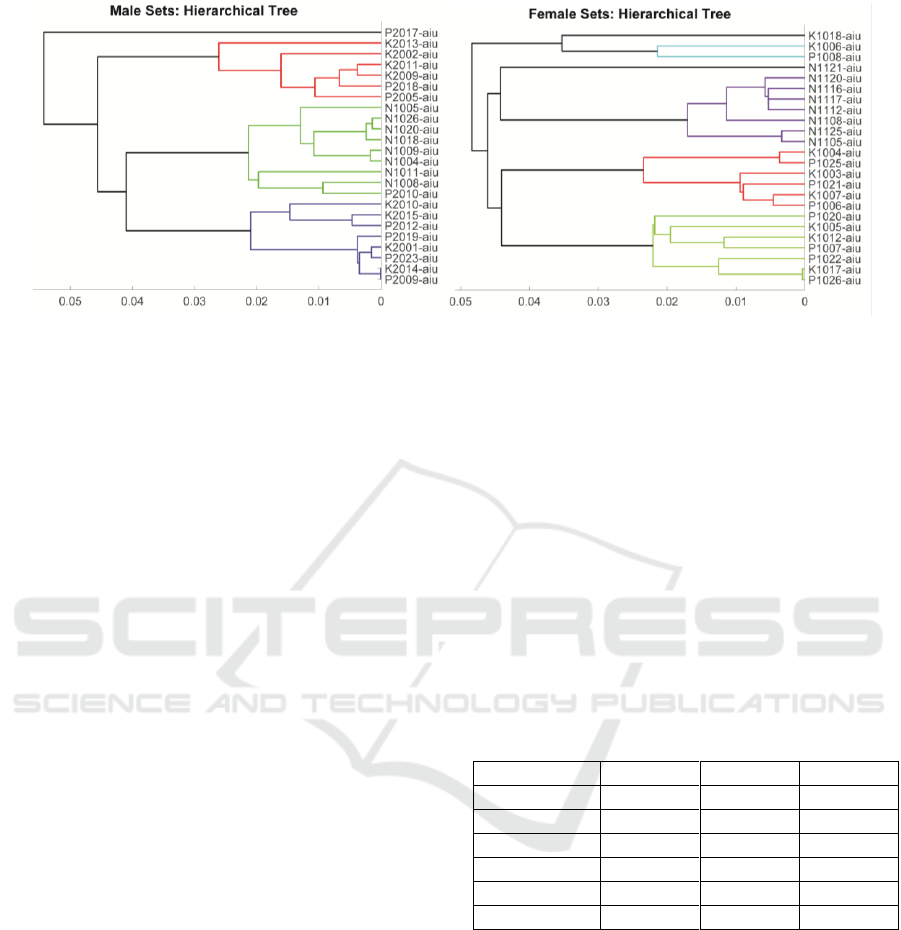
Figure 6: Hierarchical clustering of speaker samples by JSD to their respective average normative distribution. Left: Male
subsets. Right: Female subsets.
It may be seen that the distance of the normative set
NS with respect to its centroid avNS is small, but it is
significantly larger with respect to the healthy control
centroid avHC, both for male and female samples. On
its turn, the situation of samples from healthy controls
and PD patients is the reverse, they are far from the
normative centroid avNS, but at short distance from
the healthy control average avHC. This reflects the
difficulty in separating both sets of samples as far as
vowel sustained dysarthria is concerned. This
situation is also illustrated by hierarchical clustering
in terms of each sample JSD with respect to their
respective average normative sets (avMNS and
avFNS), as reflected in figure 6.
The male set is separated into four main clusters,
one including a single sample, the second one
including six ones in which healthy controls are a
majority of 4/2 (in red), the third one grouping
normative samples and a PD sample (in green), and a
fourth one integrated by healthy controls and PD
samples in equal proportion of 4/4 (in blue). The
situation for the female subsets is a bit more complex.
There are also four main clusters, the first one
composed of three samples, two healthy controls and
a PD sample (black and cyan), the second one
integrated by the whole normative subset (one in
black and seven in purple), a third one integrated by
three healthy controls and three PD samples (in red),
and a fourth one including three healthy controls and
four PD samples. Again, the similarity between
healthy controls and PD patients is manifested in
sustained vowel dysarthria. This situation is
confirmed by t-Student, Kolmogorov-Smirnov and
Mann-Whitney tests considering equal-means null
hypothesis conditions. As it may be seen in 0, the tests
including healthy controls and PD samples vs the
normative set reject the null hypothesis, both for
males and females, pointing to strong differences
with respect to normative speakers as far as vowel
dysarthria is concerned. But the situation is
completely different when PD sets are compared with
healthy controls. Whereas for male sets t-Student and
Kolmogorov-Smirnov tests reject the null hypothesis,
Mann-Whitney fails in doing so. In the case of female
sets, all the mentioned tests fail in rejecting the null
hypothesis, pointing to more similarities than
expected between healthy controls and PD patients.
Aging voice could be behind the problem.
Table 6: Estimated p-values from inter-subset tests. t-St: t-
Student; KS: Kolmogorov-Smirnov; MW: Mann-Whitney.
The cases where the null hypothesis is not fulfilled under a
5% level are printed in bold.
Datasets
t-St
KS
MW
MPD vs MNS
0.000458
0.001430
0.000311
MHC vs MNS
0.000017
0.000156
0.000155
MPD vs MHC
0.0229
0.0497
0.1300
FPD vs FNS
0.000249
0.000156
0.000155
FHC vs FNS
0.000062
0.000156
0.000155
FPD vs FHC
0.366
0.188
0.195
These results show that PD datasets are clearly
separable from normative and healthy controls at
highly significant levels, both in the case of male and
female subsets. HC are also significantly different
than normative sets. But separability between PD and
age-paired HC is not granted under acceptable
standards, possibly due to the aging characteristics of
HC articulation kinematics. This is not clear in the
male set, where two tests (t-Student and Kolmogorov-
Smirnov) avail separability whereas MW does not.
But in the female case, the three tests fail in rejecting
the null hypothesis, pointing to the difficulty in
distinguishing both sets on the basis of articulation
Comparing Parkinson’s Disease Dysarthria and Aging Speech using Articulation Kinematics
59

kinematics, a fact which is also observable in figure
6. HC shows a closer kinematic nature with respect to
PD, which results in some confusion and separation
difficulties. It may be observed that this similarity is
of aging nature, i.e., healthiness of healthy controls
cannot be assimilated to normative articulation. Age-
paired HC show certain similarities with PD patients
due to the effects of aging in articulation, although
this assumption must be proven. A comparison of PD
datasets with respect to normative sets may be not
resolving enough, as anticipated by the kinematic
analysis of PD and presbyphonic voice. It may be
argued that articulation kinematics is not sharp
enough to establish this differentiation, but it must be
taken into account that articulation instability is quite
well modelled by AKV pdf (Gómez, P., et al., 2017).
On the other hand, studies based on phonation
features, whether linear or non-linear, should be
subject to the same three-band tests to ensure that they
are sensitive to this separability problem. These
considerations raise immediate methodological
concerns regarding tests including PD patients and
healthy controls paired in age. It is unclear if this
separability problem is due to aging voice in healthy
controls, and in that case, if distortions found in PD
samples could be due also to aging, and not only to
pathology. The conclusion is that more tests with
larger number of samples should be conducted to
confirm or reject this observation, and that sharper
methods should be designed, both for the study of
vowel and speech dysarthria, as well as for studies
involving phonation, classically based on distortion
correlates as jitter, shimmer, signal-to-noise and non-
linear features. Especial care on this respect should be
observed regarding MFCC’s (mel-frequency cepstral
coefficients), as these features are known to be
sensitive both to dysphonia and to dysarthria. In this
sense, resolutive features are to be sought and tested
using three-band benchmarks in the way shown in the
present study.
5 CONCLUSIONS
From what has been discussed, the most relevant
conclusions to be summarized are the following:
• Paired tests show that articulation kinematics is
substantially different for PD and HC with respect
to normative subjects.
• This does not seem to be the case between PD and
HC subjects, as these subsets may share some
dysarthric features which may be due to aging
more than to neuromotor degeneration.
• This differentiation problem needs to be evaluated
as well in the case of phonation features,
otherwise there will not be full guarantee in using
phonation features to assess neuromotor
degeneration.
As a final remark, it must be stressed that these
conclusions are conditioned by the low size of the
datasets used, and require further validation with
larger number of subjects to be generalized.
ACKNOWLEDGEMENTS
Funded by grants TEC2016-77791-C4-4-R
(MINECO, Spain), CENIE_TECA-PARK_55_02
INTERREG V-A Spain – Portugal (POCTEP), 16-
30805A (CZ.1.05/2.1.00/03.0072), and LOl401 from
the Czech Republic Government.
REFERENCES
Anizah, S., et al. (2018). Objective Evaluation of
Bradykinesia in Parkinson’s Disease using
Evolutionary Algorithms. Proceedings of the 11th
International Joint Conference on Biomedical
Engineering Systems and Technologies (BIOSTEC
2018): 63-69. DOI: 10.5220/0006601700630069
Buchaillard, S., Perrier, P. and Payan Y., 2009. A
biomechanical model of cardinal vowel production:
muscle activations and the impact of gravity on tongue
positioning. Journal of the Acoustical Society of
America, 126(4): 2033-2051.
Brabenec, L., et al., 2017. Speech disorders in Parkinson's
disease: early diagnostics and effects of medication and
brain stimulation, J. Neural Transm., 124(3): 303–334.
Cantiniaux, S., et al., 2010. Comparative analysis of gait
and speech in Parkinson’s disease: hypokinetic or
dysrhythmic disorders? J. Neurol. Neurosurg.
Psychiatry, 81(2): 177–84.
Dauer, W. and Przedborski, S., 2003. Parkinson's disease:
Mechanisms and models. Neuron, 39(6): 889–909.
Deller J. R., Proakis J. G. and Hansen J. H. L., 1993.
Discrete-Time Processing of Speech Signals,
NewYork, Macmillan.
Dorsey, E. R., et al., 2007, 'Projected number of people with
Parkinson disease in the most populous nations, 2005
through 2030' Neurology, 68(5): 384-386.
Dromey, C., Jang, G. O. and Hollis, K., 2013. Assessing
correlations between lingual movements and formants,
Speech Communication, 55(2): 315-328.
Endres, D. M. and Schindelin, J. E., 2003. A New Metric
for Probability Distributions. IEEE Trans. on
Information Theory; 49(7): 1858-1860.
Georgiou T. and Lindquist, A., 2003. Kullback-Leibler
Approximation of Spectral Density Functions. IEEE
Trans. on Information Theory; 49(11): 2910-2917.
BIOSIGNALS 2019 - 12th International Conference on Bio-inspired Systems and Signal Processing
60

Goberman, A. M., 2005. Correlation between acoustic
speech characteristics and non-speech motor
performance in Parkinson’s disease, Med. Sci. Monit.;
11(3): 109–116.
Goberman, A. M., Blomgren, M., Metzger, E, 2010.
Characteristics of speech disfluency in Parkinson
disease. J. Neurolinguistics, 23: 470-478.
Gómez, P. et al., 2009. Glottal Source biometrical signature
for voice pathology detection. Speech Communication,
51: 759-781.
Gómez, P. et al., 2017. Parkinson Disease Detection form ,
A. R.Speech Articulation Neuromechanics. Frontiers
on Neuroinformatics, doi: 10.3389/fninf.2017.00056.
Gómez, P. et al., 2018. Neuromechanical Modelling of
Articulatory Movements from Surface
Electromyography and Speech Formants. International
Journal on Neural Systems (in press), doi:
10.1142/S0129065718500399.
Gómez A., et al., 2018. Estimating Facial Neuromotor
Activity from sEMG and Accelerometry for Speech
Articulation. Proc. of the IEEE Int. Symp. on Medical
Measurements and Applications, 287-292.
Hannam, A. G., et al., 2008. A dynamic model of jaw and
hyoid biomechanics during chewing, J. Biomechanics,
41: 1069-1076.
Jankovic, J., 2008. Parkinson's disease: clinical features and
diagnosis, J. Neurol. Neurosurg. Psychiatry, 79(4):
368–376.
Jürgens, U., 2002. Neural pathways underlying vocal
control. Neurosci. and Behav. Rev. (26): 235-258.
Mardsen, C. D., 1994. Parkinson’s disease. J. Neurol.
Neurosurg. Psychiatry, 57: 672–681.
Martens, H. et al., 2015. The effect of intensive speech rate
and intonation therapy on intelligibility in Parkinson’s
disease. J. Comm. Disorders, 58: 91.105.
Mekyska, J., et al., 2015. Robust and complex approach of
patohogical speech signal analysis, Neurocomputing,
167: 94-111.
Ricciardi, L., et al., 2016. Speech and gait in Parkinson’s
disease: When rhythm matters, Park. Relat. Disord.,
32: 42–47.
Rusz, J. et al., 2013. Imprecise vowel articulation as a
potential early marker of Parkinson’s disease: effect of
speaking task, J. Acoust. Soc. Am., 134: 2171–2181.
Salicrú, M., et al., 1994. On the Applications of Divergence
Type Measures in Testing Statistical Hypotheses, J. of
Multivar. Anal. 51(2): 372-391.
Sapir, S., Ramig, L. O., Spielman, J. L. and Fox, C., 2010.
Formant Centralization Ratio: A Proposal for a New
Acoustic Measure of Dysarthric Speech, Journal of
Speech, Language and Hearing Research, 53(1): 114-
125.
Sapir, S., 2014. Multiple factors are involved in the
dysarthria associated with Parkinson's disease: a review
with implications for clinical practice and research,
Journal of Speech, Language, and Hearing Research,
57(4): 1330-1343.
Tsanas, A., et al., 2010. Novel speech signal processing
algorithms for high-accuracy classification of
Parkinson‘s disease, IEEE Trans. on Biomed. Eng. 59:
1264-1271.
Webb, A. R., 2003. Statistical pattern recognition. John
Wiley & Sons.
Comparing Parkinson’s Disease Dysarthria and Aging Speech using Articulation Kinematics
61
