
Blood-to-blood Immunological Compatibility Test: A Possibility with
Fluorescent Immuno-Biochips
K. Charrière
1
, A. Guitton
4
, V. Ratié
3
, L. Sighi-Dumoulin
3
,V. Bourcier
2
, P. Morel
3
,
L. Pazart
1
and B. Wacogne
1,4
1
Centre Hospitalier Universitaire de Besançon, Centre d’Investigation Clinique,
INSERM CIC 1431, 25030, Besançon, France
2
Haemovigilance Service, Besançon University Hospital, 25000 Besançon, France
3
Etablissement Français du Sang Bourgogne/Franche-Comté, 25000 Besançon, France
4
FEMTO-ST Institute, Univ. Bourgogne Franche-Comte, CNRS,
15B avenue des Montboucons, 25030 Besancon, cedex, France
{vanessa.ratie, lydia.sighidumoulin, pascal.morel}@efs.sante.fr, bruno.wacogne@univ-fcomte.fr
Keywords: Crossmatch, Human Red Blood Cells, Fluorescence, Biochip, Immuno-detection.
Abstract: One of the most feared transfusion accident is the haemolytic reaction. A majority of countries imposes a
compatibility test before each transfusion, at the patient’s bedside or in laboratory. Regardless of the test
performed, it does not prevent human errors and nothing ensures an “error free” procedure. Complete
crossmatch is the only test ensuring a complete blood compatibility between donors and patients. It relies on
the direct or indirect detection of agglutinations which occur when the patient’s plasma is mixed with the red
cells to be transfused. It requires extracting plasma. The work described here will help avoid all the
immunologic incompatibilities by the use of a compatibility test without plasma extraction. It relies on an
immuno- biochip technology in a microfluidic environment with fluorescence detection. This position paper
presents preliminary results obtained with artificial samples together with comments on the state of industrial
competition and the new device market positioning.
1 INTRODUCTION
In France every year, more than 3 million labile blood
products, 80% of which were red blood cells (RBC),
are given to more than 550 000 patients (ANSM
2016). French health institutions have seen a rise in
deliveries of RBC of + 26.3% in total between 2000
and 2014 (EFS, 2014). In 2016, according to the
haemovigilance report by ANSM (National Agency
for Drug Safety), 6780 adverse effects in recipients
(AER) related to transfusion were reported. In total,
255 adverse effects in receivers related to transfusion
were recorded due to immunological incompatibility.
The situation seems to be similar in countries with the
same level of safety as France.
In most countries, a crossmatch (a compatibility
test between blood for transfusion and the receiver's
blood) is carried out in a laboratory prior to
transfusion. The current techniques to carry out a
crossmatch are either manual, with blood reagents
and samples being mixed in tubes or being placed on
gel columns before centrifuging, or automated. As far
as these automated systems are concerned, the
analyzers may only be used in a laboratory and the
analyses are time consuming which can delays the
delivery of the blood product. This test is even
avoided in some emergency situations.
Currently, the final pre-transfusion test at the
patient's bedside consists mainly of an identity check
(identity of the red cell concentrate (RCC) and
identity of the patient). This method cannot guarantee
that there will be no transfusion accident because
50% of the reported adverse effects are due to human
errors, most of them being “wrong blood in tube”
(SHOT 2011). Therefore, in spite of increasingly
effective safety systems, it is currently impossible to
completely eliminate the risks due to human errors,
both in the laboratory and at the time of the
transfusion. These errors highlight the need for a pre-
transfusion analyzer which does not require pre-
treatment (plasma extraction, and/or centrifugation)
160
Charrière, K., Guitton, A., Ratié, V., Sighi-Dumoulin, L., Bourcier, V., Morel, P., Pazart, L. and Wacogne, B.
Blood-to-blood Immunological Compatibility Test: A Possibility with Fluorescent Immuno-Biochips.
DOI: 10.5220/0007356001600166
In Proceedings of the 12th International Joint Conference on Biomedical Engineering Systems and Technologies (BIOSTEC 2019), pages 160-166
ISBN: 978-989-758-353-7
Copyright
c
2019 by SCITEPRESS – Science and Technology Publications, Lda. All rights reserved
in order to limit human manipulation and subsequent
errors.
Some research was carried out in order to make
this process ultimately safe. They are mainly based on
gel agglutination techniques which require plasma
extraction (Cid et al. 2006; Longston et al. 1999) or
SPR (Malomgre et al. 2009; Quinn et al. 2000;
Houngkamhang et al. 2013). More recently, Long-
Range Surface Plasmon-Polaritons have been
suggested to detect selectively captured red blood
cells using specific surface chemistry (Krupin et al.
2014). This system can capture red blood cells in a
sample with a very low cell concentration. The initial
dilution of the sample is carried out in a buffer with a
controlled refractive index. Blood samples must then
be prepared which is not an improvement compared
to current crossmatch. Test plates and image
processing have also been proposed for phenotyping
blood groups (Ferraz et al. 2010). Micro fluidics
coupled with optical fibers are reported in
(Ramasubramanian et al. 2009). A while ago, we
proposed the use of functionalized biochips for ABO
and rhesus compatibility tests (Charrière et al. 2015,
Wacogne et al. 2017).
Except the gel agglutination method which
requires samples preparation, the other techniques
could allow for blood grouping but not a direct
compatibility check between the RCC to be
transfused and the patient. The idea developed in this
position paper arose from the fact that incompatible
antibodies present in the patient’s blood bind to red
cells to be transfused and may lead, more or less
rapidly, to the lyses of RCC.
Therefore, our proposal is to use a single biochip
onto which red cells to be transfused are trapped.
Subsequently, patient’s whole blood is applied onto
the biochip and possibly present irregular antibodies
react with the RCC. Finally, fluorescent anti-IgGs
antibodies are used in order to allow rapid optical
detection. Using such an architecture allows detecting
any erythrocytic immunological incompatibilities
without extracting patient’s plasma. In this way, this
very rapid test can be performed by nonspecifically
trained people, with a reduced and non prepared
receiver’s blood sample.
This principle will be described in part 2 of this
communication together with the actual biological
model used to demonstrate a first proof of concept. A
description of the experimental set-up and results
obtained using fluorescence spectroscopy will be the
subject of part 3. In part 4 and in line with the scope
of a position paper, we will comment on the state of
industrial competition and the new devices market
positioning.
2 GENERAL PRINCIPLE AND
ACTUAL IMMUNOLOGICAL
MODEL
2.1 Biochip Principle
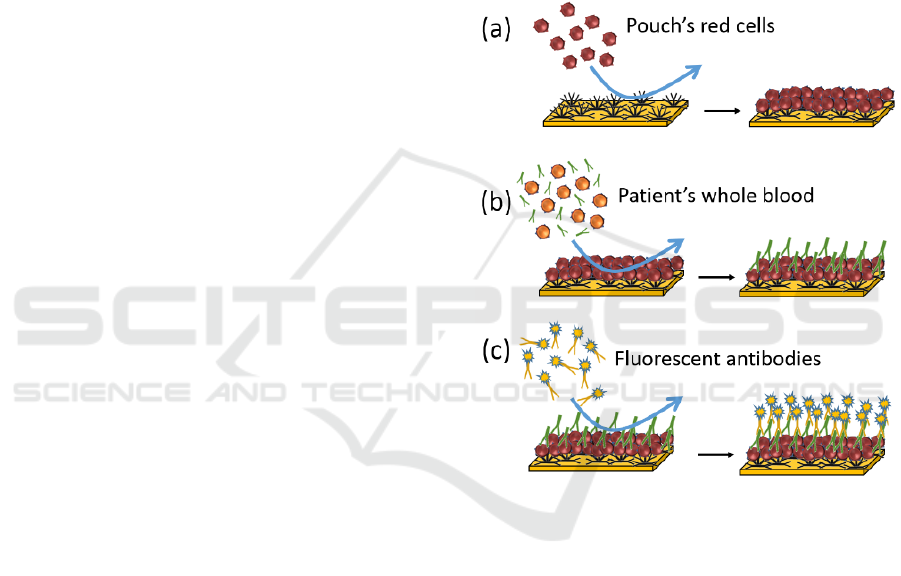
The method we propose is depicted in figure 1 in the
case of non-compatible transfusion. Red cells from
the RCC to be transfused are applied to the biochip
previously grafted with antibodies directed to a high-
incidence antigen (figure 1(a)). After rinsing, a RCC
layer is formed at the biochip surface.
Figure 1: Principle of the blood-to-blood immunological
compatibility test biochip.
Patient’s whole blood is directly injected onto this
surface (figure 1(b)). Antigen/antibody reactions
occur when RCC exhibits an antigen which is
complementary of an antibody present in the patient’s
blood (irregular IgGs in this case). After rinsing,
elements which have not reacted with the red cells
layer are evacuated.
Then, a solution of fluorescent anti-IgGs
antibodies is applied to the biochip (figure 1(c)).
These antibodies react with the patient’s irregular
antibodies forming a fluorescent layer at the biochip’s
surface. The latter is eventually detected using
conventional fluorescence techniques.
In this example, irregular IgGs have been
considered. However, incompatibility may be due to
presence of IgM in the patient’s whole blood (case of
the ABO incompatibility). In this case, and this is not
Blood-to-blood Immunological Compatibility Test: A Possibility with Fluorescent Immuno-Biochips
161
shown in this proof of concept communication,
fluorescent anti IgMs antibodies should be employed.
In order to address any incompatibility situation, the
ideal sensor should be adapted to the presence of both
IgGs and IgMs. A way of doing would be to use a
mixture of fluorescent anti-IgGs and anti-IgMs
antibodies. The fluorescent labels could be chosen in
such a way that both exhibit the same excitation
wavelength but different emission spectra. Here, a
simple fluorescence spectrum fitting would
furthermore indicate which kind of immuno-
incompatibility arose.
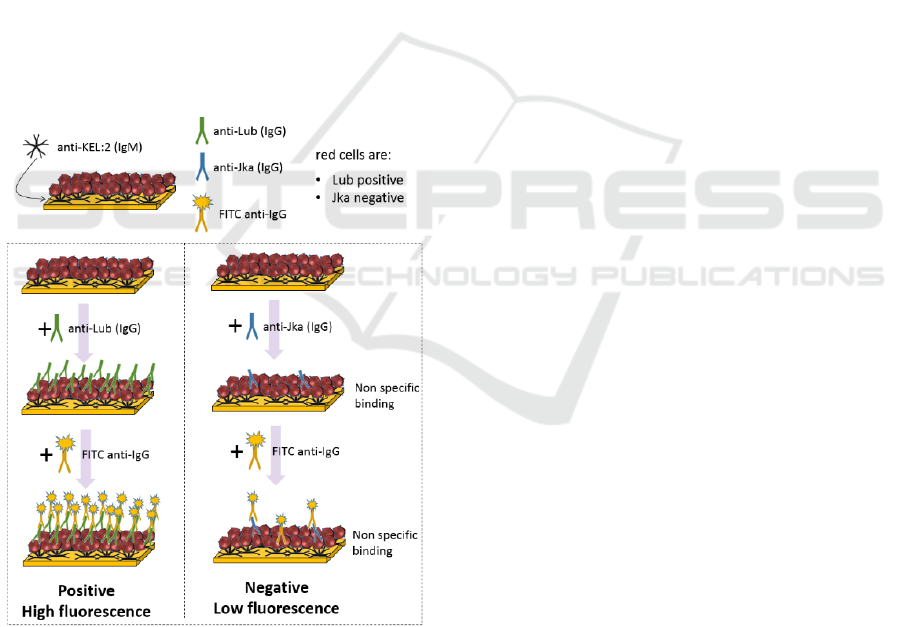
2.2 Immunological Model
In this model, RCC are captured on the biochip by
means of anti Kell IgMs (figure 2). The KEL:2
antigen (cellano) is present at the red cell surface of
about 99.6% of the population. Therefore, for this
proof of concept, the anti Kell IgMs are considered
universal. In the future, a red cell capture method
which also works for the remaining 0.4% of the
population will have to be defined.
Figure 2: Immunological model used in this proof of
concept.
In this example, red cells are Lub positive and Jka
negative. For the positive test, a solution of irregular
anti-Lub IgG antibodies is applied to the RCC
immobilized on the biochip. In the same manner, a
solution of anti-Jka antibodies is used for the negative
test. When antigen-antibody reactions occur,
antibodies bind to the red cells surface.
After rinsing, FITC coupled anti-IgGs antibodies
are applied to the biochips. They react with the
irregular antibodies possibly present at the RCC
surface. In a positive test, a large amount of FITC
coupled antibodies is present and a strong
fluorescence signal is detected. On the contrary in a
negative test, only non-specific interactions occur
leading to a weak fluorescence signal.
For these experiments, commercially available
irregular antibodies were used (Bio-Rad). Further
experiments will be conducted with whole blood.
3 EXPERIMENTAL SET-UP AND
PRELIMINARY RESULTS
3.1 Biochemical Reactions
Immunological reactions described in figure 2 were
performed using the fluidic system of our SPRi
apparatus (SPRi-Plex imager, Horiba Scientific) at
37°C with a MLB2 (Bio-Rad) running buffer.
Biochips were prepared according to the process
described in (Charriere et al. 2015) without RSA
saturation. Anti-Kell IgMs (dilution 1/10 in acetate
buffer, 10 mM and pH 4.5) were grafted onto
biochips.
200 µL of pouch’s red cells were injected onto the
biochips at 20 µL/min. After rinsing, 200 µL,
irregular antibodies (anti-Lub and anti-Jka, 1/10 in
MLB2, BioRad) were injected at 20 µL/min. FITC
anti-IgGs (Sigma) were injected (200 µL, 20µL/min,
1/25 in MLB2).
Complex red cells / antibodies were finally fixed
using a 0.5% glutaraldehyde solution. Biochips were
wetted with MLB2 buffer and protected with cover
slits before fluorescence measurements.
3.2 Fluorescence Measurement Set-up
FITC was excited at 488 nm using an Oxxius 488-50-
COL-PP laser. Excitation light was injected into a
fluorescence beam-splitter as shown in figure 3.
This beam-splitter (Doric Lenses) is equipped
with excitation and emission filters together with a
dichroic mirror (respectively FF01-488/10-25,
BLP01-488R-25 and FF500-Di01-2536).
Fluorescence spectra were recorded using a QE-Pro
spectrometer (Ocean Optics).
BIODEVICES 2019 - 12th International Conference on Biomedical Electronics and Devices
162
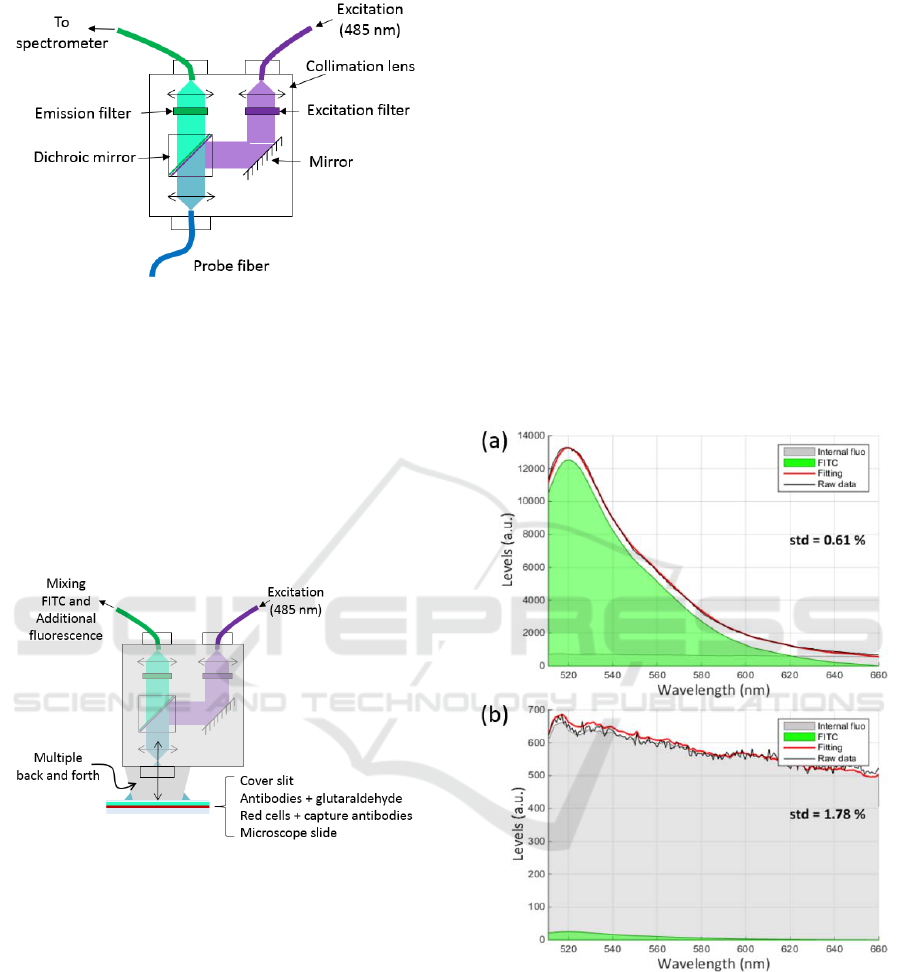
Figure 3: Fluorescence beam-splitter used in these
experiments.
3.3 Additional Fluorescence
This kind of beam-splitter is usually designed to be
used with optical fibres. Because we use it in an open
beam configuration, additional fluorescence signals
are observed due to multiple reflexions in the beam-
splitter (figure 4). This additional fluorescence is
mainly generated by the epoxy resin used to glue
optical elements in the beam-splitter.
Figure 4: Origin of the additional fluorescence.
The shape of the additional fluorescence was
recorded and used as explained in the next section.
3.4 Experimental Results
Overall, 18 measurements were performed with 2
demonstration biochips (7 random places on the
positive biochip and 11 on the negative).
Fluorescence spectra were recorded as above
mentioned. In order to isolate the contribution of the
FITC signal from the whole recorded spectrum a
simple fitting was employed. Indeed, we recorded the
shape of the additional fluorescence and we know the
shape of the FITC emission spectrum. Fitting the
experimental spectra with these 2 shapes allows
separating the contribution of the FITC from the
contribution of the additional fluorescence. Figure
5(a) shows an example of spectrum recorded with the
positive biochip.
In this figure, the green shape corresponds to the
FITC while the grey shape correspond to the
additional fluorescence. It can be seen that the fitting
efficiently reproduces the recorded spectra. The
feature reported on the right of the spectra represents
the standard deviation of the difference between the
experimental spectrum and the fitted one. It is an
estimation of the fitting accuracy. It is clearly
observed that the signal due to the FITC (about 10000
levels) is much greater than the signal of the
additional fluorescence.
In figure 5(b), we present a spectrum obtained
with the negative biochip. Here the shape of the
additional fluorescence is clearly visible.
Figure 5: Fluorescence spectra of: (a) positive biochip, (b)
negative biochip.
As previously mentioned, 18 spectra were
recorded. Table 1 summarizes the levels of FITC and
additional fluorescence obtained at each places of the
biochips.
Blood-to-blood Immunological Compatibility Test: A Possibility with Fluorescent Immuno-Biochips
163
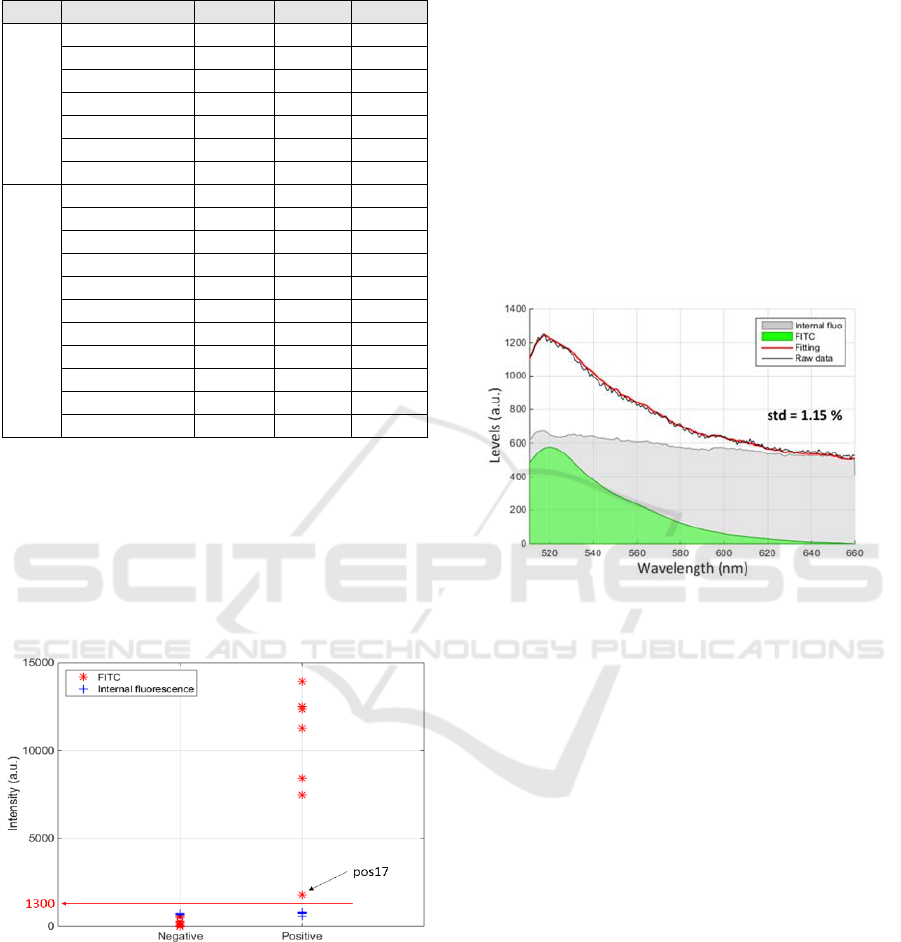
Table 1: Summary of the fluorescence levels obtained with
the 18 measurements on 2 biochips (1 positive, 1 negative).
Type Spectra N° FITC Add. std
Positive
QEP003631_11 12525 757 0.61
QEP003631_12 7470 766 0.39
QEP003631_13 8419 702 0.64
QEP003631_14 11261 797 0.37
QEP003631_15 12355 732 0.58
QEP003631_16 13935 702 0.7
QEP003631_17 1784 575 2.27
Negative
QEP003631_02 0 666 1.79
QEP003631_03 0 697 1.72
QEP003631_04 198 697 1.31
QEP003631_05 198 697 1.31
QEP003631_06 270 657 1.78
QEP003631_20 577 672 1.15
QEP003631_21 537 668 1.51
QEP003631_22 8 664 1.65
QEP003631_23 24 663 1.78
QEP003631_24 6 732 1.73
QEP003631_25 74 750 2.06
From these data, it can be seen that the level of
additional fluorescence is relatively constant (700±50
levels). Also, FITC levels of the positive biochip is
always much larger (except for the QEP003631_17
spectrum). It is however possible to define a threshold
above which a biochip is considered positive. This is
shown in figure 6 where a threshold at 1300 levels is
reported.
Figure 6: Definition of a positive threshold.
This figure shows that the experimental set-up can
be drastically simplified as a simple photodiode can
be used to detect positive biochips. This would make
the final device cost-effective and would ensure its
use in a large number of situations. Practically, the
same fluorescence beam-splitter as the one presented
in figure 3 can be used. This time, the expensive and
centimetre size spectrometer will be replaced by a
millimetre size photodiode.
However, the use of fluorescence spectroscopy
may prove to be extremely useful in the case of weak
antigen-antibody affinity or weak concentration of
irregular antibodies. In some cases indeed, even a
very low antibody concentration can lead to severe
consequences for the patient (for example the anti-
Jka). The interest of fluorescence spectroscopy is
illustrated in figure 7 which reproduces results
obtained with the QEP003631_20 spectrum. This
demonstrates that a simple fitting can extract a weak
level of FITC signal from a spectrum possibly
recognized as negative. Importantly, it must be noted
that figure 7 does not represent a weak affinity/avidity
situation but a case of non-specific interaction at the
place where the spectrum was recorded.
Figure 7: Extracting a weak FITC response using spectral
fitting.
To conclude this experimental section, this work
represents the preliminary results demonstrating that
the immuno-biochip technology can be used to
perform a complete blood compatibility test without
plasma extraction. Further experiments are still
required with a large range of irregular antibodies
before considering a clinical trial on a larger scale.
Also, issues concerning reduced labor and error risk
can be addressed by designing an immuno-combined
medical device as the one proposed in (Charrière et
al. 2018).
4 MARKET POSITIONING
In countries with a safe transfusion system (80% of
wealthy countries and 60% of averagely wealthy
countries), the compatibility check is carried out
either in the laboratory or at the patient's bedside, both
in some cases.
In the laboratory, ABO grouping of RCC and the
patient are carried out by analysers (Bio-Rad,
Diagast, HTZ, Dia Pro, Grifols). The current
BIODEVICES 2019 - 12th International Conference on Biomedical Electronics and Devices
164

techniques for carrying out a crossmatch or an
irregular antibody screening are either manual, with
blood reagents and samples being mixed in tubes or
being placed on gel columns before centrifuging (e.g.
Across Gel® Cross Match, from Dia Pro or ID-Card
50531 from Bio-Rad), or automated (e.g. the Qwalys
analysers from Diagast). The analysers require
additional time-consuming manual operations, (blood
centrifugation for example) which may increase the
risk of errors. Furthermore, they are oversized for
technical platforms or small size laboratories.
To mitigate these risks, some countries, including
France, have formalised a final ABO compatibility
check at the patient's bedside (ABO compatibility
charts from Bio-Rad, Diagast). This check requires
qualified and regularly trained staff, is limited to
ABO compatibility and cannot prevent certain human
errors in terms of allocation, realization or
interpretation.
During the work presented here, a market research
carried out by a specialist firm and companies with a
potential interest, found that the biochip technology
is of major interest. There is nothing similar in this
enormous market. This market research also showed
that the final control of just ABO compatibility on a
biochip would not currently be sufficient to penetrate
the world market because of practices in place in most
countries. The companies we approached strongly
advised increasing the added value of this biochip by
broadening its application to carry out crossmatch,
what we did. Given this international perspective, the
two initial patents we published (Pazart et al. 2001-1,
2011-2) were also broadened and recorded in Europe,
North America and in “BRIC” countries.
5 CONCLUSION
We have presented the proof of concept of a biochip
potentially able to perform a blood-to-blood
immunological compatibility test in a simple fluidic
environment. It relies on a single biochip onto which
red cells to be transfused are trapped. Subsequently,
patient’s whole blood is applied onto the biochip and
possibly present incompatible antibodies react with
the RCC. Eventually, fluorescent anti-IgGs
antibodies are used in order to allow rapid optical
detection.
Fluorescence spectroscopy experiments showed
that irregular antibodies can easily be detected. Here,
we used solutions of irregular antibodies. The next
steps will consist in multiplying the types of irregular
antibodies and to perform experiments with whole
blood obtained from donors. Potentially, a simple
photodiode based detection can be used. This would
allow using a compact device which can be used
either by trained or non trained medical staff.
However, the use of fluorescence spectroscopy in a
more complex set-up can probably lead to the
detection of weak but potentially dangerous
incompatibilities.
ACKNOWLEDGMENTS
This work is funded by the Etablissement Français du
Sang Bourgogne Franche-Comté, contract “X-ult”,
April 2015.
REFERENCES
ANSM. Rapport d’activité hémovigilance 2016. (2017)
http://ansm.sante.fr/Mediatheque/Publications/Bilans-
Rapports-d-activite-Bilans-et-rapports-d-
activite#folder_26762.
Charrière, K., et al., 2015, Biochip technology applied to an
automated ABO compatibility test at the patient
bedside, Sensors and Actuators B, Vol 208, pp. 67-74.
Charrière, K., et al., 2018, A biochip based medical device
for point-of-care ABO compatibility: towards a smart
transfusion line, In: Peixoto N., Silveira M., Ali H.,
Maciel C., van den Broek E. (eds) Biomedical
Engineering Systems and Technologies. BIOSTEC
2017. Communications in Computer and Information
Science, Vol 881, pp. 94-105, Springer, Cham.
Cid, J. et al. Comparison of three microtube column
agglutination systems for antibody screening: DG Gel,
DiaMed-ID and Ortho BioVue, Transfus. Med. Oxf.
Engl. 16, 131–136 (2006).
EFS. Rapport d’activité 2013. (2014).
http://www.dondusang.net/rewrite/article/6180/efs/pub
lications/feuilletez-en-ligne-le-rapport-d-activite-2013-
de-l-efs.htm?idRubrique=790.
Ferraz, A., et al., 2010, Automatic Determination of Human
Blood Types using Image Processing Techniques.
BIODEVICES 2010 - 3rd International Conference on
Biomedical Electronics and Devices, Proceedings pp.
69-74.
Houngkamhang, N. et al., 2013, ABO Blood-Typing Using
an Antibody Array Technique Based on Surface
Plasmon Resonance Imaging, Sensors Vol. 13, pp.
11913–11922.
Krupin, O., et al., 2014, Selective capture of human red
blood cells based on blood group using long-range
surface plasmon waveguides, Biosens. Bioelectron.
Vol. 53, pp. 117–122.
Langston, M. et al., 1999, Evaluation of the gel system for
ABO grouping and D typing, Transfusion (Paris) Vol.
39, pp. 300–305.
Blood-to-blood Immunological Compatibility Test: A Possibility with Fluorescent Immuno-Biochips
165

Malomgre, W., et al., 2009, Recent and future trends in
blood group typing, Anal Bioanal Chem Vol. 393, pp.
1443–51.
Pazart, L., et al, 2011, Device for taking a sample of a body
fluid and method for implementing same,
WO2011055029.
Pazart, L., et al, 2011, Secure perfusion system,
WO2011055031.
Quinn, J. G., et al., 1997, Detection of blood group antigens
utilising immobilised antibodies and surface plasmon
resonance, J. Immunol. Methods Vol. 206, pp. 87–96.
Ramasubramanian, M., et al., 2008, Simplified
spectraphotometric method for the detection of red
blood cell agglutination, Appl. Opt. Vol. 47, pp. 4094–
4105.
SHOT. Annual SHOT report 2011. (2011).
Wacogne, B., et al., 2017, Medical devices development:
the bottom-up or the top-down approach?, Int. J. of
Bios. and Bioel. Vol. 3, pp.00079.
BIODEVICES 2019 - 12th International Conference on Biomedical Electronics and Devices
166
