Compensation of Simultaneous Orientation Contrast
in Superimposed Textures
Rudolf Netzel, Nils Rodrigues, Anja Haug and Daniel Weiskopf
Visualization Research Center (VISUS), University of Stuttgart, Germany
Keywords:
Simultaneous Contrast, Texture Orientation, Human Vision.
Abstract:
We propose a method that compensates the simultaneous orientation contrast in the visualization of superim-
posed textures. Such superposition plays a role in visualizations that overlay or enrich visual representations
of data with additional information. Our compensation method extracts the direction and frequency within the
input textures by using a Gabor filter bank. The foreground texture is then rotated to counterbalance the tilt
illusion. The rotation angle is determined by a model that adopts results of previous studies that measured the
influence of perceived contrast, direction, and frequency on the perceived tilt. The effectiveness of our method
is demonstrated for artificial stimuli and a typical example of scientific flow visualization of multiple vector
fields.
1 INTRODUCTION
Visualization is used to generate graphical represen-
tations of data that are more understandable than the
source data in its original form. A multitude of dif-
ferent methods have been developed for a variety of
application domains, for instance, in flow visualiza-
tion to make the structure of vector fields visible, or in
network visualization to show relationships between
elements represented as node-link diagrams. Such vi-
sualizations often suffer from visual clutter that could,
if not addressed properly, influence the perception and
thereby the interpretation of visualized data. This is
especially true when a post-processing step adds fur-
ther information to an existing visualization by super-
imposition.
A specific example of such a visualization is the
display of a first vector field through line integral con-
volution (LIC) and the overlay of arrow glyphs for a
second vector field. Other examples of such overlays
are points of interest and routing instructions on top
of topological maps that help users to keep contextual
awareness. In general, this concept is related to the
topic of superimposing textures. In some cases, the
method of overlaying textures may produce perceptu-
ally inconsistent results. It is even possible that opti-
cal illusions are created that falsify the visualization.
In such scenarios, rendered graphics accurately depict
the source data, but human perception introduces ad-
ditional artifacts or distortions in addition to existing
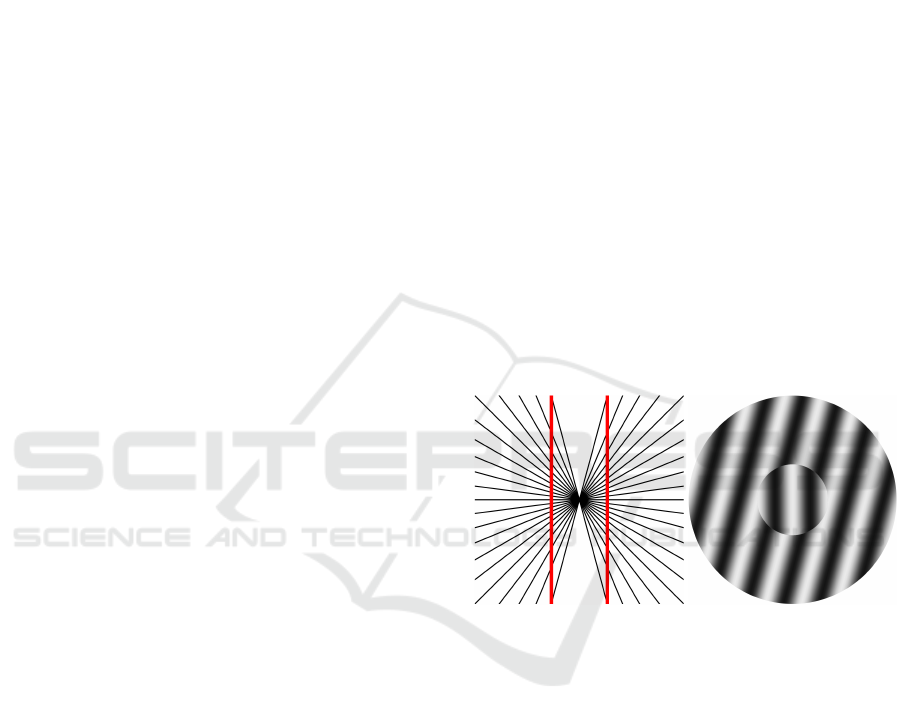
(a) Hering illusion (b) Tilt illusion
Figure 1: Examples of visual illusions. In the Hering illu-
sion (a), two straight foreground lines (red) drawn on radial
lines in the background seem to bend outwards. The tilt illu-
sion (b) arises from a perfectly vertical texture (small inner
disk) on a background. Both shapes have a sinusoid texture,
but the foreground seems to have rotated counterclockwise.
graphical features.
One illusion that is very likely to appear in many
line-based visualizations is the tilt illusion. It results
in the perception of rotated or bent lines instead of
straight ones (Figure 1). It is difficult to quantify the
effect for a general public, as it depends on viewing
distance, frequencies in the stimulus, orientation be-
tween back- and foreground, as well as individual hu-
man learning.
With this paper, we want to increase awareness of
such effects within the visualization community. It is
a relevant topic because it can occur when overlaying
textures or even in such simple cases where lines cross
48
Netzel, R., Rodrigues, N., Haug, A. and Weiskopf, D.
Compensation of Simultaneous Orientation Contrast in Superimposed Textures.
DOI: 10.5220/0007356800480057
In Proceedings of the 14th International Joint Conference on Computer Vision, Imaging and Computer Graphics Theory and Applications (VISIGRAPP 2019), pages 48-57
ISBN: 978-989-758-354-4
Copyright
c
2019 by SCITEPRESS – Science and Technology Publications, Lda. All rights reserved
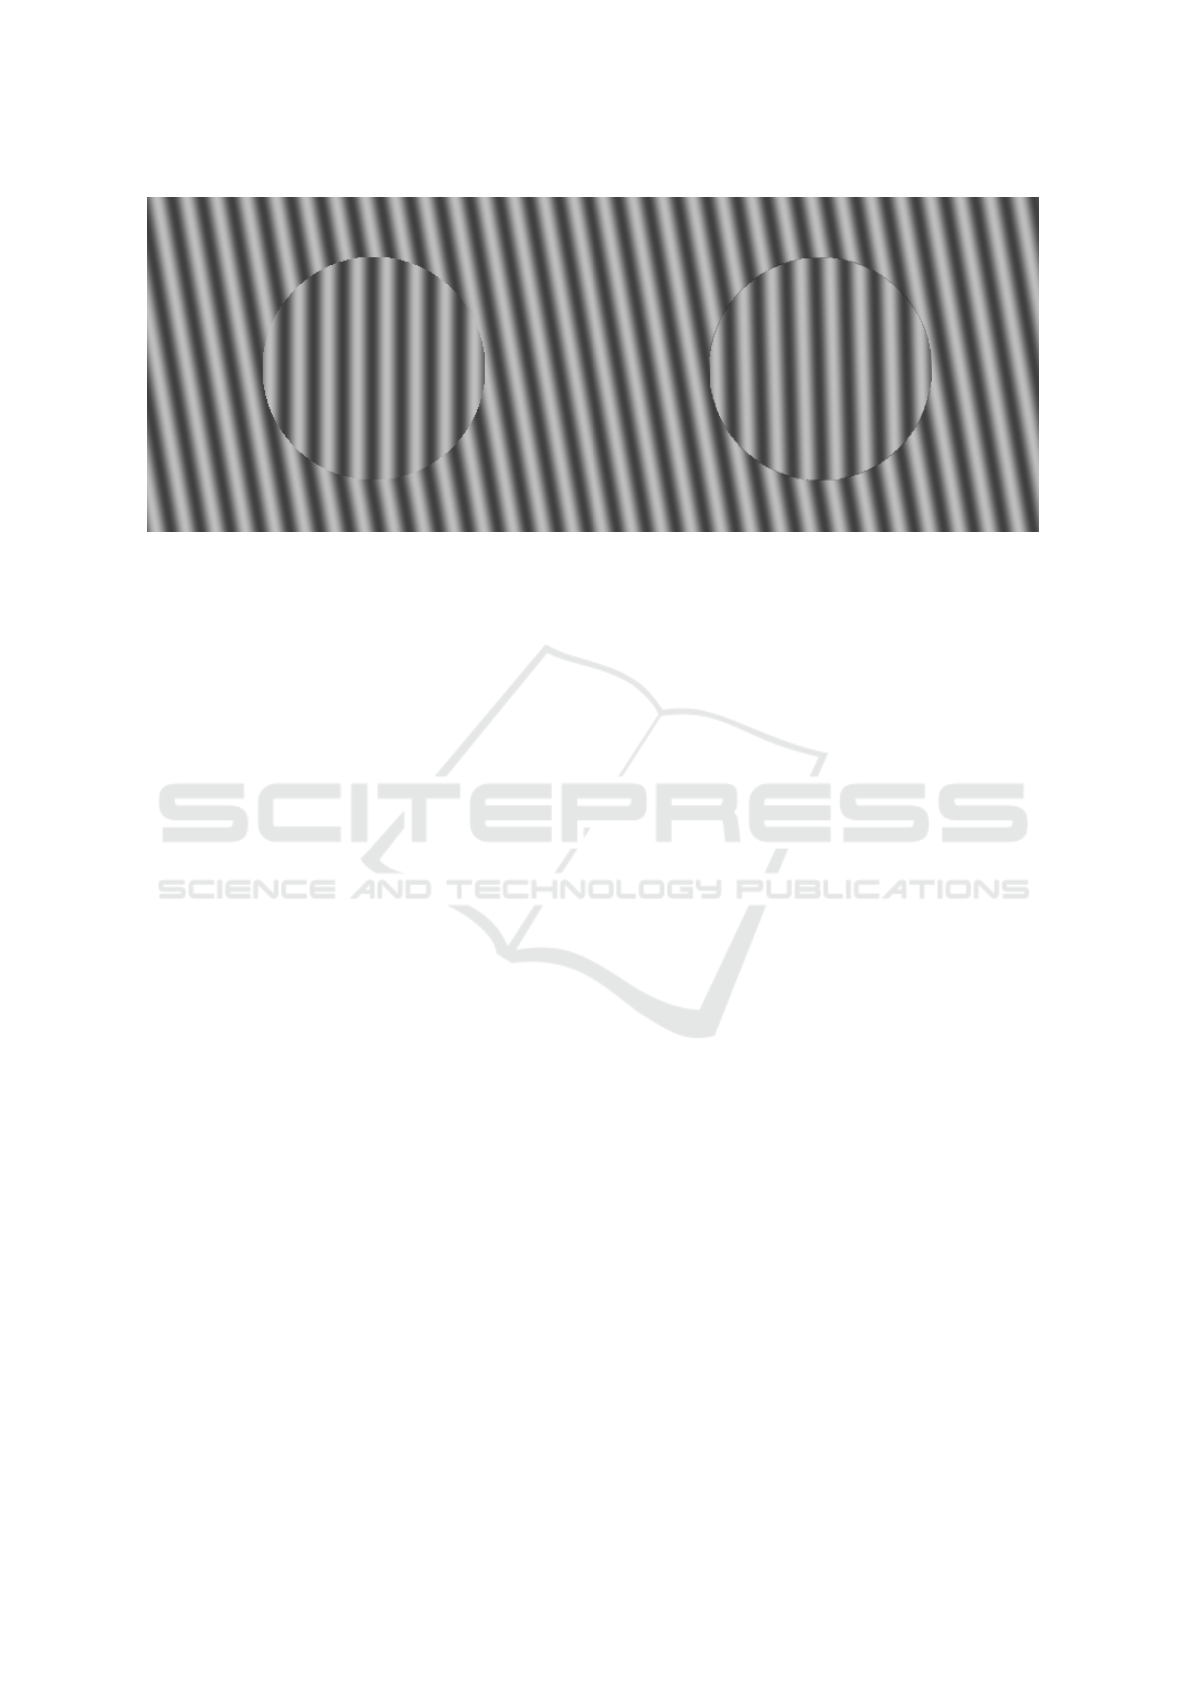
(a) Image without compensation (b) Image with compensation
Figure 2: Example of a location-dependent compensation of the simultaneous orientation contrast (tilt illusion). The images
illustrate a disk (foreground texture) that is superimposed over a background texture. Both the background texture and disk
exhibit sinusoidal patterns. After the compensation, the disk in (a) appears no longer rotated in (b).
(Figure 1a). This is especially problematic when the
direction has to be estimated correctly, e.g., graph vi-
sualizations that use partial links (Becker et al., 1995).
For the remainder of this paper, we focus on il-
lusions caused by the simultaneous orientation con-
trast. We propose a method that allows us to compen-
sate the tilt illusion in specific cases: it takes as input
two superimposed textures and determines perceived
directions and frequencies of these textures utilizing
Gabor filters. Our method then compensates the tilt
illusion by rotating the overlaid texture in the opposite
orientation (Figure 2). We show examples of orienta-
tion contrast compensation for artificial stimuli and an
application from scientific visualization that we men-
tioned earlier: flow visualization of two superimposed
vector fields, one shown by LIC, the other one shown
by arrow glyphs overlaid on top of the LIC image
(see Figure 7). Our model is capable of performing
a compensation for such stimuli, since it operates on
position-dependent data. Therefore, it can be applied
for, e.g., scientific visualizations with superimposed
textures.
2 RELATED WORK
When it comes to creating visualizations, there are
many factors that need to be considered, e.g., which
graphical primitives or color encoding should be used.
The visualization research community is very well
aware of the importance of human visual perception
in this context (Ware, 2012). In particular, there is
previous work on the role of attention (Healey and
Enns, 2012; Frintrop et al., 2010) and color (Zhou and
Hansen, 2016) for visualization.
However, there is less prior work that would quan-
tify the—possibly subtle—effects of the surrounding
on the actual visualization. A typical example is the
simultaneous contrast effect. Quite often this effect is
considered for color or luminance contrasts. For ex-
ample, the simultaneous color contrast has been con-
sidered in visualization techniques. This effect causes
the same color to be perceived differently depending
on its surrounding colors. Mittelst
¨
adt et al. (2014)
developed an algorithm for the compensation of the
simultaneous color contrast by optimization of per-
ceived color. Here, the colors of a background and a
foreground texture are adjusted in an iterative process.
In each iteration, the background texture is evaluated
based on a color appearance model (iCAM) and ad-
justed accordingly. In subsequent work, Mittelst
¨
adt
and Keim (2015) extended the approach to account
for interpersonal differences.
Another example is the compensation of per-
ceived motion in animated visualizations by Weiskopf
(2004). Differences in perceived speed are caused by
suboptimal motion perception for (almost) isolumi-
nant colors; and these differences are compensated by
data acquired through time-consuming user calibra-
tion. However, we are not aware of any previous vi-
sualization work that would compensate the perceived
direction of textures, which is the focus of our paper.
Researchers have studied the tilt illusion outside
the visualization context. Goodenough et al. (1979)
tackled it from the psychophysical side and tried to
find the causes for errors in rod and frame tests. They
found that eye torsion and illusionary self-tilt do not
account for the total strength of the tilt-effect. In-
Compensation of Simultaneous Orientation Contrast in Superimposed Textures
49

stead, they suggested that simultaneous orientation
contrast is involved in the creation of errors in rod and
frame tests. Westheimer (1990) analyzed the effects
of distance, surrounding lines, time duration, and syn-
chronicity on orientation contrast for lines.
Research by Nothdurft (1991) shows that even
without overlaying images, orientation contrast can
create the perception of segmentation in fields of
lines. This might also be relevant for visualizations
where fields of arrows are superimposed on LIC im-
ages, as in our example in Section 5. Depending on
the difference on the perceived main direction of a
background and a foreground texture, the texture on
top could appear rotated and introduce areas of incon-
sistent flow directions. Schwartz et al. (2009) detected
the patterns of tilt illusions in natural images with spa-
tially limited search fields and measured the perceived
tilt, but they did not perform any compensation. In
other research, it was shown that the spatial frequency
as well as the contrast has an influence of the per-
ceived tilt bias. To this end, Georgeson (1973) re-
ported the tilt bias for different spatial frequencies of
foreground and background texture. Durant and Clif-
ford (2006) studied the tilt effect by presenting fore-
ground and background asynchronously, while also
varying the contrast of both. Wei et al. (2013) mod-
eled simple cells as Gabor patches and used them to
identify line segments that seem to deform when lines
are crossing, but no compensation was performed.
Franceschiello et al. (2018) also used this model for
simple cells to derive a model that specifically com-
pensates Hering illusions.
In general, illusions, like the tilt illusion or il-
lusionary contours, are caused in the first two lay-
ers (V1 and V2) in the visual cortex (Molotchnikoff
and Rouat, 2012; Carter, 2014). It was shown that
the receptive fields of so-called simple cells are in-
volved, which detect edges by overlapping receptive
fields and lateral inhibition. For our paper, we adopt
previous work and experiments in texture perception
and make them usable for visualization by deriving a
computational model for orientation compensation of
superimposed textures.
The superposition of visual elements, such as tex-
tures, plays an important role in visualization when-
ever there is more information to be shown than just
on a single 2D plot. A typical example is the combi-
nation of two surface displays (Bair and House, 2007;
Bair et al., 2009) or weaving of visual regions (Lu-
boschik et al., 2010). We are particularly interested in
the simultaneous display of multivariate or multiple
2D flows in a single image (Kirby et al., 1999; Ur-
ness et al., 2006). For this, the overlay of two textures
is a useful and common approach since textures can
show flow direction effectively. However, none of the
above previous papers considered simultaneous con-
trast effects in orientation perception.
3 METHOD
In this section, the compensation process for the si-
multaneous orientation contrast is described in more
detail. Our method relies on two textures as input:
one texture is a designated background texture, while
the other one is the foreground texture that is being
superimposed in order to provide, e.g., additional in-
formation at designated locations. The locations of
foreground textures are also an input for our method.
As depicted in Figure 3, the compensation pro-
cess consists of three parts: (1) input texture analysis
to retrieve characteristic values from the textures, (2)
computation of the tilt angle model that estimates per-
ceived orientation, and (3) the actual compensation of
the tilt bias by means of foreground rotation.
3.1 Input Texture Analysis
First, input textures have to be analyzed to perform
the compensation. Here, perceptually relevant char-
acteristic values are retrieved from the input textures:
direction, spatial frequency, and contrast. The con-
trast of the textures is defined as the difference be-
tween the brightest and darkest texture point. We use
Gabor filters to retrieve frequency and direction in-
formation from the textures. These kinds of filters are
commonly used to imitate the frequency and direc-
tion perception in the human visual system (Palmer,
1999). Neurons and their associated receptive fields
in combination with lateral inhibition of neighboring
neurons form a pattern that is similar to that of Ga-
bor filters, which are generated by multiplying a 2D
sinusoidal function with a 2D Gaussian function or a
Hamming window. These filters are sensitive to the
direction and frequency defined by a sinusoidal func-
tion.
Our computational model performs a convolution
of the input texture with these Gabor filters. The fil-
tering result highlights edges that have properties sim-
ilar to those of the sinusoidal functions of the filters.
For our implementation, we create a filter bank for di-
rections between 0
◦
and 179
◦
, while the frequencies
are set to 2
i
cycles per degree with i ∈ 0, ..., 5 (assum-
ing a screen resolution of 1920 × 1200 and a view-
ing distance of 60 cm). This results in 1080 2D fil-
ter responses. A sampling of the direction in 1
◦
steps
was performed to ensure that possible maxima are not
overlooked. Furthermore, the used tilt bias function
IVAPP 2019 - 10th International Conference on Information Visualization Theory and Applications
50

FG
BG
Texture analysis
Tilt angle model
α
Angle
Weights
-
-
= ω
frq
= ω
cont
Rotation
Figure 3: Steps for the compensation of the simultaneous orientation contrast. First, characteristic values are retrieved from
the foreground (FG) and background (BG) textures: direction, spatial frequency, and contrast. Then, the adjusted tilt bias
angle is determined; the original tilt bias angle is modified by taking into a count weights for the frequency and contrast. In
the final step, the foreground object is rotated based into the opposite direction of the adjusted tilt bias.
was also derived with the same sampling. We aggre-
gate the scalar values of each such response to get
a single number that represents the total strength of
each filter. We used the default parameter for the spa-
tial frequency bandwidth (1 octave) that determines
the cutoff of the filter response as frequency content
in the input image doubles compared to the preferred
frequency. The default parameter is also used for the
spatial aspect ratio (0.5), which controls the ellipticity
of the Gaussian envelope. To make these representa-
tive scalar values comparable, they are normalized by
the size of their corresponding filter. The minimum
size of the filters was 53 × 53 pixels and the maxi-
mum size 209 × 209 pixels. Furthermore, to compute
the dominant direction and frequency, we need to ag-
gregate the previous results in two ways: we combine
all filter responses for each direction and all values
for each frequency. Figure 5 shows the result of such
a filter process for the first case. We determine pri-
mary directions and frequencies based on the maxima
of the normalized responses.
It is important to note that Gabor filtering leads to
a spatially dependent computation of the characteris-
tic values for the texture, i.e., angle, spatial frequency,
and contrast are not necessarily constant for the tex-
ture but may vary from location to location. While
many of the stimuli used in perception research may
have constant characteristic values across the whole
image, realistic examples from scientific visualization
will usually be spatially dependent.
3.2 Tilt Angle Model
In the second part, these characteristic values are used
to estimate the perceived angle tilt at the respective
location, i.e., the characteristic values are accessed
at the position where the foreground and background
textures coincide.
To this end, we adopt findings from previous stud-
ies and models from vision research and cast them
into a computable model. We determine an adjusted
tilt bias angle
˜
α
bias
by multiplying the original tilt bias
angle α
bias
with weights for the influence of the spa-
tial frequency ω
frq
and the contrast ω
cont
:
˜
α
bias
= α
bias
· ω
frq
· ω
cont
(1)
The values of α
bias
, ω
frq
, and ω
cont
are computed by
utilizing three functions that are based on previously
conducted studies about the effects of the tilt bias with
respect to differences of directions, frequencies, and
contrasts. The first function approximates the original
tilt bias angle. The directional bias is defined on the
interval [0;180] and is based on experimental results
of Schwartz et al. (2009).
We defined the other two functions piecewise and
use them as weights for the influence of spatial fre-
quency (Georgeson, 1973) and contrast (Durant and
Clifford, 2006). Figure 4b shows how the influence
of frequency is defined on [−3;0] and [0; 2] separately.
Weights for contrast are available for the input ranges
[−100;0] and [0; 100] (Figure 4c). They indicate that
the difference of frequency or contrast of the fore-
ground and background texture influence the effect of
tilt bias.
The influence of spatial frequency differences be-
tween foreground and background textures has an ex-
ponential drop-off in both positive and negative direc-
tions. For contrast differences, on the other hand, the
dependency of the weight function is approximately
linear for positive and negative values. Note that only
Georgeson (1973) conducted an experiment to explic-
itly measure the effect of spatial frequency, while Du-
rant and Clifford (2006) were interested in the after
effects of tilt illusions (delayed presentation of back-
ground or foreground texture). This included also the
simultaneous presentation of both textures, resulting
in four measurements that were used to approximate
the contrast weight function. Effects of tilt bias under
different conditions for artificial stimuli are depicted
in Figure 6 (images in the top row).
3.3 Foreground Rotation
In the last part,
˜
α
bias
is finally used to compensate for
the tilt bias. We rotate the foreground texture around
Compensation of Simultaneous Orientation Contrast in Superimposed Textures
51
Difference between angles in degrees
-2.5
-2
-1.5
-1
-0.5
0
0.5
1
1.5
2
2.5
Tilt bias in degrees
20 40 60 80 100
120
140 160 1800
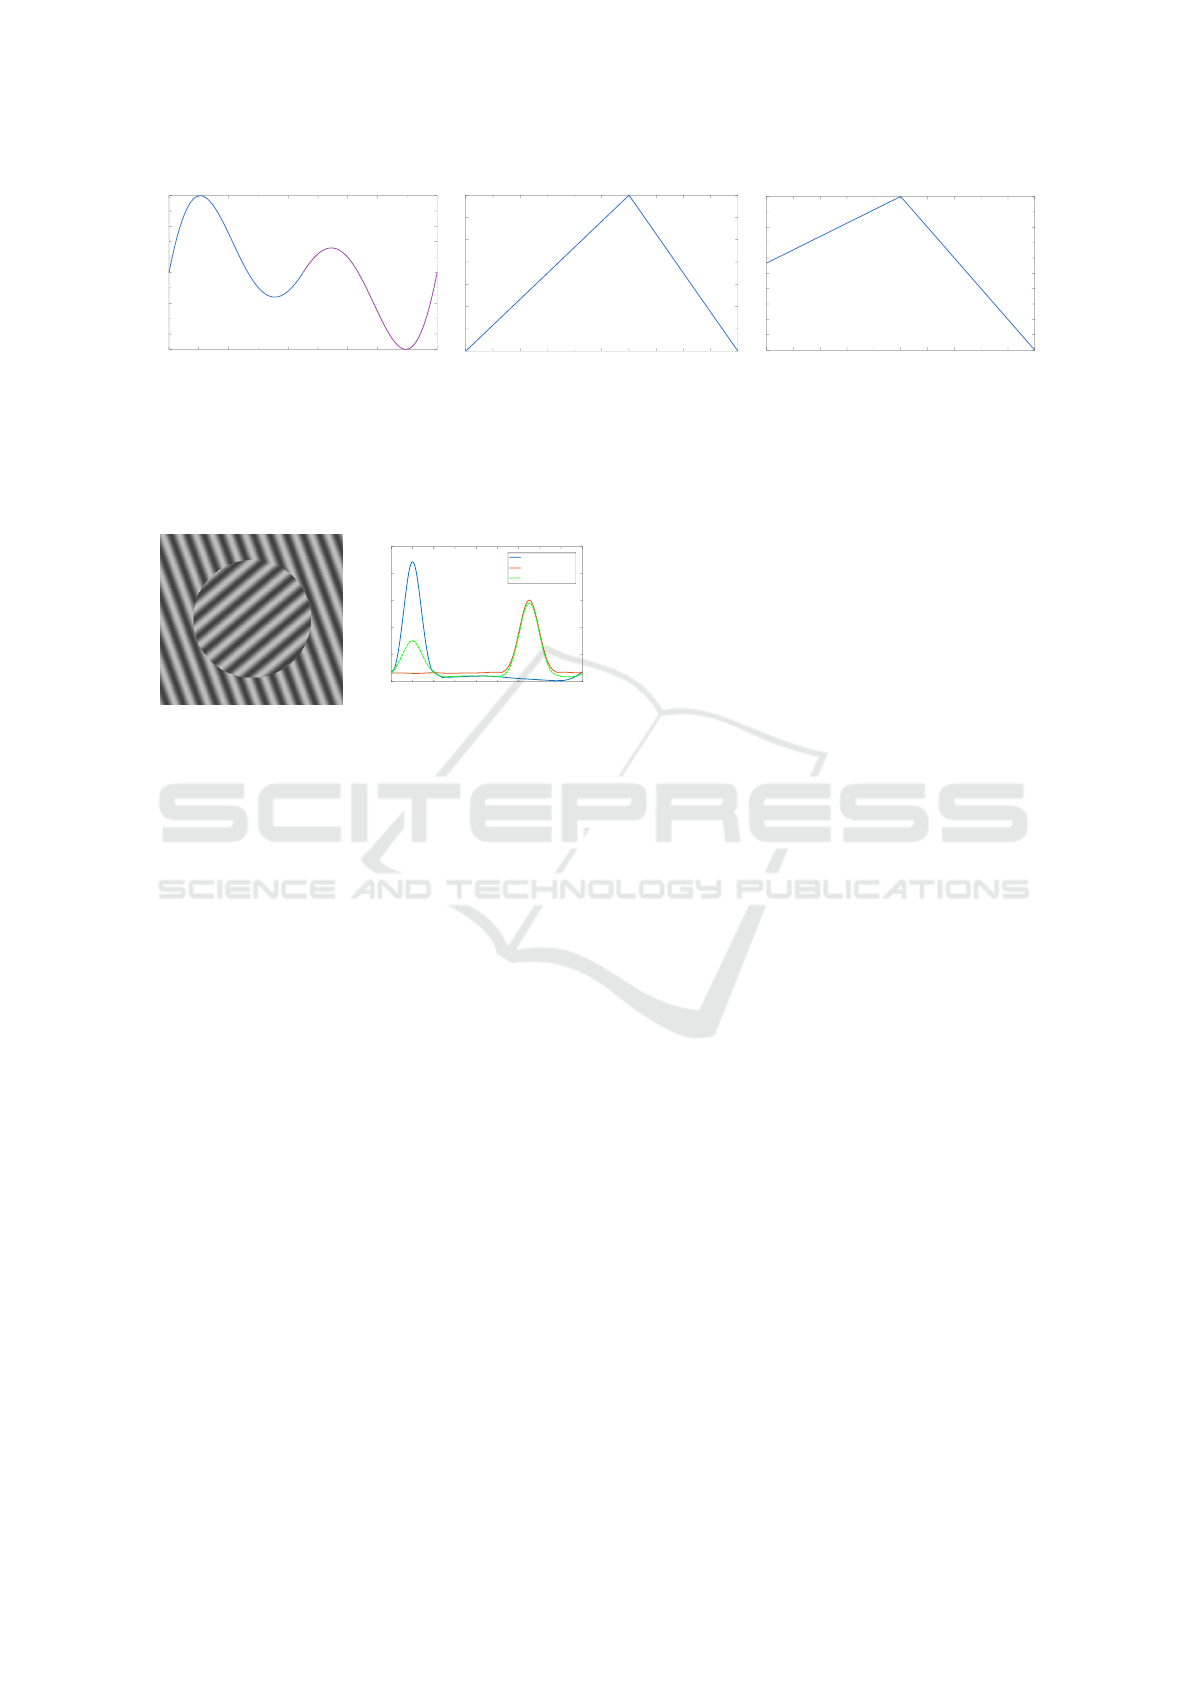
(a) Directional bias
-3 -2.5 -2 -1.5 -1 -0.5 0 0.5 1 1.5 2
Spatial frequency background to foreground in octaves
0.3
0.4
0.5
0.6
0.7
0.8
0.9
1
Weight
(b) Frequency weight function
-100 -80 -60 -40 -20 0 100
Background contrast relative to foreground contrast in %
0
0.1
0.2
0.3
0.4
0.5
0.6
0.7
0.8
0.9
1
Weight
20 40 60 80
(c) Contrast weight function
Figure 4: Bias functions used in our tilt angle model: (a) Approximated function of the measured tilt bias of Schwartz et al.
(2009); the blue part corresponds to positive angular differences in their work, magenta to negative differences. (b) Weights
for the detected spatial frequency of the foreground and the background texture; the weight is one if spatial frequency has
an influence, and zero if not; based on Georgeson (1973). (c) Weight for the contrast difference between the foreground and
background texture; the weight is one if the contrast has an influence, and zero if not; based on Durant and Clifford (2006).
(a) Superimposed images
0 20 40 60 80 100 120 140 160 180
0
0.5
1
1.5
2
2.5
#10
4
Background
Foreground
Combined
Filter direction
Filter response
(b) Responses of filters
Figure 5: Result of applying a Gabor filter bank on a super-
imposed image (a). The plot (b) shows the responses of the
filters in tested direction for the foreground, background,
and superimposed image. Maxima indicate the main direc-
tions.
its center point by the opposite of the adjusted tilt bias
angle.
This approach works quite well as long as the
foreground object covers a rather small area so that
the spatial coincidence between foreground and back-
ground can be uniquely determined. Furthermore, a
small object may just be rotated as a whole with-
out further considerations to be made. We leave the
extension of our method to large foreground objects
for future work: it may have to include nonlinear de-
formations of the foreground texture to accommodate
spatially varying tilt angles.
4 ARTIFICIAL STIMULI
During the development and refinement of our com-
pensation method, we used a series of test images to
qualitatively rate the compensation. One series of test
images contained alternating black and white bars,
where both foreground and background texture had
a rectangular shape. Corners and edges of the fore-
ground textures might be useful for the visual sys-
tem to perform some kind of implicit compensation.
Hence, we used circular foreground textures in other
tests. Additionally, we employed sinusoidal functions
to generate striped textures. Related work often uses
such kinds of stimuli in the context of measuring the
tilt bias.
We went through several trial-and-error cycles to
detect and address problems with our preliminary
compensation model. The filter responses are one ex-
ample. At first, they were noisy and it was not pos-
sible to detect a maximum, since the sizes of filters
were not considered. Therefore, we introduced a nor-
malization of filter responses.
Initial tests with textures of the same contrast
and spatial frequency yielded good results. However,
the method produced an overcompensation when we
changed the spatial frequency between foreground
and background. As described in the previous sec-
tion, weighting the compensation by the differences
in spatial frequency addressed this issue. For the same
reasons, a weight for the contrast difference was in-
troduced. We were able to prevent overcompensation
with these countermeasures. Results of successful
compensations for simple cases are depicted in Fig-
ure 6 (images on the bottom).
The test stimuli used so far are based on frequen-
cies and local contrasts that are constant across the
image. To further demonstrate the effects of tilt bias
and the results of our compensation method, we cre-
ated images that contain a broad range of frequency,
direction, and local contrast changes by using a J
¨
ahne
test pattern (J
¨
ahne, 2004). In such images, the spa-
tial frequency increases continuously from the center
until reaching a defined maximum at the outer bor-
der. That makes the patterns point-symmetric and al-
lows for tests with a continuous range of directions.
So far, the stimuli have always been monochrome.
We continue without introducing color and calculate
the brightness of each point in the image using the
IVAPP 2019 - 10th International Conference on Information Visualization Theory and Applications
52

(a) No differences (b) Contrast difference (c) Frequency difference (d) Transparency
Figure 6: The tilt bias is influenced by the spatial frequency and contrast difference of the foreground and the background
texture. The effect is also present if transparency is used. This is shown in the top row. The bottom row depicts the same
images under the same conditions and after the compensation. In the bottom images of (a) and (d), the compensation was
not affected by the contrast and frequency weight. In (b) and (c), the weights reduced the amount of compensation. Viewing
distance about 20 cm.
function
g(x) =
g
0
· sin
k
m
|x|
2
2r
m
·
1
2
tanh
r
m
− |x|
ω
+
1
2
(2)
Here, x is the vector offset from the image center, |x|
the distance from the image center, r
m
is the maxi-
mum radius of the pattern in the image, and k
m
spec-
ifies the maximum instantaneous frequency. Further-
more, tanh can be seen as an approximation to a step
function, where r
m
is the location of the step and ω
is the width of the transition. The following parame-
ters were used to generate the test patterns: k
m
=
π
2
,
r
m
= 400, and ω = 40.
Figures 7 and 8 only use the lower half of the
J
¨
ahne pattern, due to its symmetry. Arrows were
placed on a radial line to demonstrate the effects of
varying frequency and constant perceived direction of
the background texture. Furthermore, by arranging
arrows on circular paths, the impact of changing per-
ceived direction of the background texture and a con-
stant spatial frequency are shown. Figure 7a shows
the original image where some arrows seems to be ro-
tated by several degrees. This effect is compensated
in Figure 7b.
5 MULTIFIELD FLOW
VISUALIZATION
So far, our method was demonstrated only for artifi-
cial stimuli. In this section, results of a compensation
for an example from scientific visualization are pre-
sented. In such a scenario, foreground textures might
be glyphs or other small graphical elements that are
superimposed over a background texture to provide
additional localized information.
We discuss a specific, yet typical example from
scientific flow visualization: the simultaneous plot of
two 2D vector fields in a single image (Urness et al.,
2006). One of the vector fields may be visualized by
arrow glyphs that yield a coarse representation. A
complementary visualization is chosen for the other
vector field and shown as background texture. Here,
we use a dense texture-based method in the form of
line integral convolution (LIC) (Cabral and Leedom,
1993). This method allows us to visualize fine de-
tails of vector fields that might be hard to detect in
the coarse grids of glyphs. For more background on
texture-based flow visualization, we refer to the sur-
vey paper by Laramee et al. (2004).
In such an example use case, the simultaneous ori-
entation contrast between the LIC background and the
glyph foreground can result in a tilt illusion. Mis-
Compensation of Simultaneous Orientation Contrast in Superimposed Textures
53
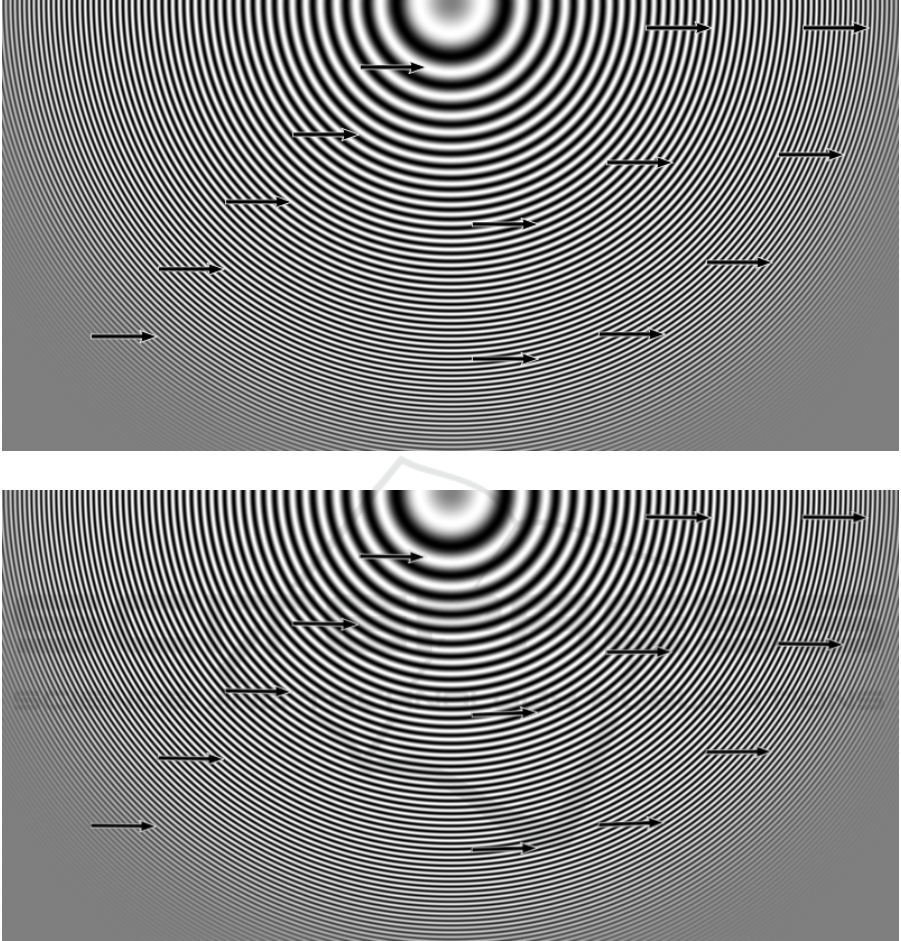
(a) Without compensation
(b) With compensation
Figure 7: Arrows are superimposed on a J
¨
ahne test pattern. On the left side, for each arrow position, the frequency is
changing and the direction of the background texture is constant. On the right side, arrows are arranged on two circles leading
to a constant frequency and a varying direction. In a viewing distance of about 20 cm, some arrows seem to be tilted in (a).
This effect is compensated in (b). In (b), eight arrows are rotated clockwise (minimum 0.51
◦
, maximum 0.86
◦
, and average
0.69
◦
) and five arrows are rotated counterclockwise (minimum 0.36
◦
, maximum 2.28
◦
, and average 1.38
◦
).
perceptions in the orientation of superimposed ar-
rows can then lead to false readings of flow direc-
tion. Therefore, compensation is crucial for a correct
interpretation of the vector fields. Figure 9a shows
an example without compensation. Here, an analyst
might have selected a region that is of interest and
manually placed arrows. For this example, we as-
sume that all glyphs should be perfectly horizontal.
Tilt bias from orientation contrast creates the appear-
ance of the lower three arrows going in slightly differ-
ent directions, while the upper five are not affected.
After compensation, all glyphs appear horizontal in
Figure 9b. The proposed method works on each ar-
row individually, i.e., the glyphs are rotated against
IVAPP 2019 - 10th International Conference on Information Visualization Theory and Applications
54
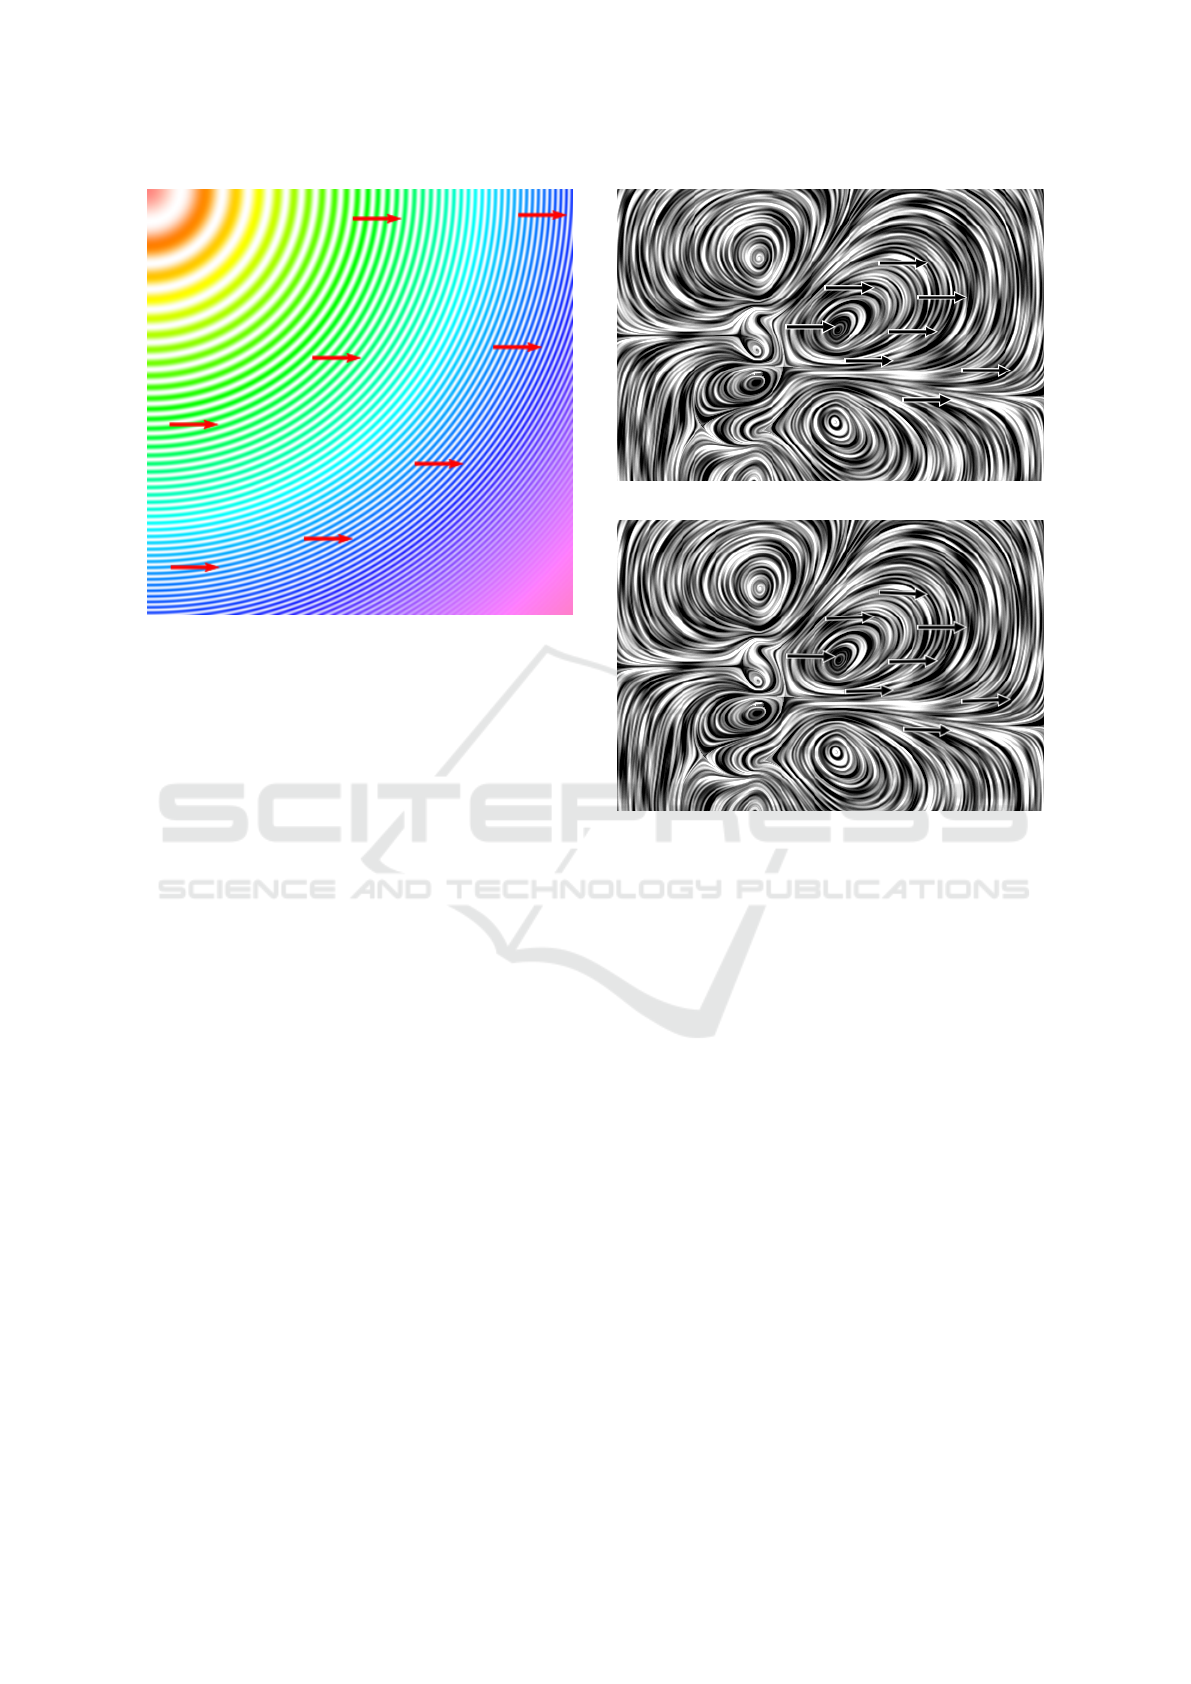
Figure 8: Arrows are superimposed on a J
¨
ahne test pattern.
They are arranged on two circles, leading to a constant fre-
quency and a varying direction. When texture is rendered
with color, the tilt effect is less pronounced than in Fig-
ure 7a.
the tilt angle derived at the respective location on the
LIC background.
6 DISCUSSION
Our tests with different artificial stimuli show promis-
ing results and we were able to demonstrate that our
method can be applied in realistic scenarios from flow
visualization. However, there are a few topics that re-
quire further investigation to improve the compensa-
tion and to test its validity.
The first issue concerns the weight functions. Our
frequency weight seems to be reliable, since it is
based on the results of an experiment that specifically
tested the effects of frequency on the tilt bias. This is
not the case for the contrast weight. Here, we were
only able to use four measurements of an experiment
that measured the after effects of tilt illusions in the
case of a simultaneous appearance of fore- and back-
ground texture. In both cases, it would be beneficial
to verify the results of the frequency experiment and
to improve the contrast weight function by conduct-
ing experiments with a more appropriate sampling of
the parameter space.
We based our method on the tilt bias of Schwartz
et al. (2009), who used measurements from Wes-
theimer (1990). In this original work, the author
conducted experiments using only vertically oriented
stimuli, but states on page 1914 that “there is no rea-
(a) Image without compensation
(b) Image with compensation
Figure 9: Arrows superimposed on background LIC tex-
tures that depict a vector field. The three arrows at that bot-
tom of (a) are affected by the tilt illusion at a viewing dis-
tance of about 20 cm. In the compensated image (b), they
appear horizontal. In (b), four arrows are rotated clockwise
(0.76
◦
, 2.47
◦
, 0.08
◦
, and 1.71
◦
) and four arrows are rotated
counterclockwise (2.31
◦
, 0.96
◦
, 1.42
◦
, and 2.23
◦
).
son to believe that the findings [. . . ] would not apply
to other orientations”. However, viewing our test im-
ages vertically or horizontally can lead to the percep-
tion of varying degrees of the tilt illusion, depending
on the observer. This suggests the existence of an ad-
ditional parameter to the tilt effect and requires further
investigation.
Another aspect that is not addressed yet is the im-
pact of color on the tilt illusion. This was subject of
previous research (Clifford et al., 2003a; Lovegrove
and Over, 1973; Clifford et al., 2003b), where mea-
surements were taken with respect to color signals (L,
M, and S cone signals derived from RGB images) and
luminance. Color contrast can reduce the tilt effect, as
shown in Figure 8. Here, the tilt effect is weaker than
in Figure 7a. In the best case, Equation 1 might sim-
ply be extended by additional weight terms for the
influence of color. In the worst case, there could be
dependencies between color, contrast, and frequency
Compensation of Simultaneous Orientation Contrast in Superimposed Textures
55

that would need to be modeled.
The next topic that could be of relevance is to in-
corporate Gestalt laws into the compensation process.
For instance, horizontally aligned arrows on a virtual
horizontal line are less influenced by the tilt bias ac-
cording to our observations of initial tests. The human
visual system relies on certain expectations or makes
assumptions in the presence of geometric structures.
This issue is even more pronounced for large fore-
ground objects that may require nonlinear and spa-
tially dependent deformations for tilt compensation.
A related topic is the estimation of the dominant
frequency and direction. As described in Section 3,
the maximum response for direction and frequency
is currently utilized. However, Figure 5b shows that
there might be several distinct local maxima that
could be considered for compensation, in particular,
for large textures.
7 CONCLUSION
In this paper, we addressed the topic of visual illu-
sion effects; more specifically, the tilt illusion caused
by simultaneous orientation contrast. It is a relevant
topic within the field of visualization, as it can occur
when overlaying textures or even in line renderings.
We have proposed an approach to compensate for
the tilt illusion in case of superimposed textures. This
is of practical relevance for visualization since su-
perimposed textures are commonly used for multi-
field and other overlaid visualizations. To perform the
compensation, information about directions, frequen-
cies, and contrast are extracted from the input images.
Based on the results of prior experiments on the ef-
fects of the tilt illusion, we have approximated weight
functions for frequency and contrast, which are used
to avoid overcompensation. We demonstrate the re-
sults of our method for artificial stimuli and a realistic
scenario from flow visualization.
In our example cases, the results are promising.
However, a misinterpretation of the visualization is
only prevented for specific stimuli, render sizes, view-
ing distances and subjects; all of which we cannot
control. While someone looks at the digital version
of this paper on a screen, someone else prints it with
or without scaling, holds it nearer to the eyes while
reading, etc. In short, there are still a number of top-
ics that need to be addressed. One of them is that our
efforts resulted in a compensation success that varies
between each individual person. More work is needed
to explore the effects of simultaneous orientation con-
trast. Our method might benefit from additional ex-
periments to refine the weight functions, the incorpo-
ration of color or Gestalt laws, and, finally, the han-
dling of secondary maxima in the weighting of per-
ceived directions and frequencies.
ACKNOWLEDGEMENTS
We would like to thank the German Research Foun-
dation (DFG) for financial support within project B01
of SFB/Transregio 161.
REFERENCES
Bair, A. and House, D. H. (2007). Grid with a view: opti-
mal texturing for perception of layered surface shape.
IEEE Transactions on Visualization and Computer
Graphics, 13(6):1656–1663.
Bair, A., House, D. H., and Ware, C. (2009). Factors influ-
encing the choice of projection textures for displaying
layered surfaces. In Proceedings of the 6th Symposium
on Applied Perception in Graphics and Visualization
(APGV), pages 101–108.
Becker, R. A., Eick, S. G., and Wilks, A. R. (1995). Visual-
izing network data. IEEE Transactions on Visualiza-
tion and Computer Graphics, 1(1):16–28.
Cabral, B. and Leedom, L. C. (1993). Imaging vector fields
using line integral convolution. In Proceedings of the
SIGGRAPH Annual Conference on Computer Graph-
ics and Interactive Techniques, pages 263–270.
Carter, R. (2014). The Brain. Dorling Kindersley Ltd.
Clifford, C. W., Pearson, J., Forte, J. D., and Spehar, B.
(2003a). Colour and luminance selectivity of spatial
and temporal interactions in orientation perception.
Vision Research, 43(27):2885 – 2893.
Clifford, C. W. G., Spehar, B., Solomon, S. G., Martin,
P. R., and Qasim, Z. (2003b). Interactions between
color and luminance in the perception of orientation.
Journal of Vision, 3(2).
Durant, S. and Clifford, C. W. G. (2006). Dynamics of the
influence of segmentation cues on orientation percep-
tion. Vision Research, 46(18):2934–2940.
Franceschiello, B., Sarti, A., and Citti, G. (2018). A neu-
romathematical model for geometrical optical illu-
sions. Journal of Mathematical Imaging and Vision,
60(1):94–108.
Frintrop, S., Rome, E., and Christensen, H. I. (2010). Com-
putational visual attention systems and their cognitive
foundations: a survey. ACM Transactions on Applied
Perception, 7(1):6:1–6:39.
Georgeson, M. A. (1973). Spatial frequency selectivity of a
visual tilt illusion. Nature, 245:43.
Goodenough, D. R., Oltman, P. K., Sigman, E., Rosso, J.,
and Mertz, H. (1979). Orientation contrast effects in
the rod-and-frame test. Perception & Psychophysics,
25(5):419–424.
IVAPP 2019 - 10th International Conference on Information Visualization Theory and Applications
56

Healey, C. G. and Enns, J. T. (2012). Attention and visual
memory in visualization and computer graphics. IEEE
Transactions on Visualization and Computer Graph-
ics, 18(7):1170–1188.
J
¨
ahne, B. (2004). Practical Handbook on Image Process-
ing for Scientific and Technical Applications, Second
Edition. CRC Press, Inc.
Kirby, R. M., Marmanis, H., and Laidlaw, D. H. (1999).
Visualizing multivalued data from 2D incompressible
flows using concepts from painting. In Proceedings of
the IEEE Visualization Conference, pages 333–340.
Laramee, R. S., Hauser, H., Doleisch, H., Vrolijk, B., Post,
F. H., and Weiskopf, D. (2004). The state of the art
in flow visualization: dense and texture-based tech-
niques. Computer Graphics Forum, 23(2):203–222.
Lovegrove, W. and Over, R. (1973). Colour selectivity in
orientation masking and aftereffect. Vision Research,
13(5):895–901.
Luboschik, M., Radloff, A., and Schumann, H. (2010). A
new weaving technique for handling overlapping re-
gions. In Proceedings of the International Conference
on Advanced Visual Interfaces (AVI), pages 25–32.
Mittelst
¨
adt, S. and Keim, D. A. (2015). Efficient contrast ef-
fect compensation with personalized perception mod-
els. Computer Graphics Forum, 34(3):211–220.
Mittelst
¨
adt, S., Stoffel, A., and Keim, D. A. (2014). Meth-
ods for compensating contrast effects in information
visualization. Computer Graphics Forum, 33(3):231–
240.
Molotchnikoff, S. and Rouat, J., editors (2012). Visual Cor-
tex - Current Status and Perspectives. InTech.
Nothdurft, H. (1991). Texture segmentation and pop-
out from orientation contrast. Vision Research,
31(6):1073–1078.
Palmer, S. E. (1999). Vision Science: Photons to Phe-
nomenology. MIT Press.
Schwartz, O., Sejnowski, T. J., and Dayan, P. (2009). Per-
ceptual organization in the tilt illusion. Journal of Vi-
sion, 9(4):19–19.
Urness, T., Interrante, V., Longmire, E., Marusic, I.,
O’Neill, S., and Jones, T. W. (2006). Strategies for
the visualization of multiple 2D vector fields. IEEE
Computer Graphics and Applications, 26(4):74–82.
Ware, C. (2012). Information Visualization: Perception for
Design. Morgan Kaufmann, third edition.
Wei, H., Ren, Y., and Li, B.-M. (2013). A collaborative
decision-making model for orientation detection. Ap-
plied Soft Computing, 13(1):302–314.
Weiskopf, D. (2004). On the role of color in the percep-
tion of motion in animated visualizations. In Proceed-
ings of the IEEE Visualization 2004 Conference, pages
305–312.
Westheimer, G. (1990). Simultaneous orientation con-
trast for lines in the human fovea. Vision research,
30(11):1913–1921.
Zhou, L. and Hansen, C. D. (2016). A survey of colormaps
in visualization. IEEE Transactions on Visualization
and Computer Graphics, 22(8):2051–2069.
Compensation of Simultaneous Orientation Contrast in Superimposed Textures
57
