
Project Portfolio Risk Prediction and Analysis using the Random
Walk Method
Xingqi Zou
1 a
, Qing Yang
1 b
, Qian Hu
1 c
and Tao Yao
2 d
1
School of Economics and Management, University of Science and Technology Beijing, 30 Xueyuan Road, Beijing, China
2
Department of Industrial and Manufacturing Engineering, The Pennsylvania State University, University Park, U.S.A.
Keywords: Project Portfolio Selection, Risk Prediction, Sustainable Development, Random Walk Method, Multidomain
Matrix (MDM).
Abstract: Based on the interdependency relationship among projects, the paper analyses risk factors in the project
portfolio network via the random walk algorithm. Sustainability is one of the most important challenges of
the project and portfolio management. This paper analyses the interdependencies among projects in a portfolio
from the perspective of sustainable development and builds models to measure the relationship among risk
factors via the Multidomain matrix (MDM) method. Using the interdependency relationship among projects
and potential relationship between different risk factors as inputs, the paper builds the model of portfolio risk
network to predict the risk in the project portfolio via a random walk algorithm. Because the random walk is
a personalized recommendation algorithm, so our proposed method can achieve an accurate prediction of
portfolio risk through predicting the risk factors and their probabilities in the portfolio. Our method can also
help project managers to rank these risk factors in the portfolio through distinguishing the most concerned
risks.
1 INTRODUCTION
1 Sustainable development is a process of change in
which the exploitation of resources, the direction of
investments and the orientation of technological
development can enhance both the current and future
potential to meet human needs and aspirations.
Portfolio risks may affect the sustainable
development of the portfolio (Ghasemi et al., 2018).
Interdependencies among projects create complexity
for portfolio risk analysis. Several researchers have
explored the sustainability in project management
(Silvius et al., 2017). However, existing studies on
prediction portfolio risks do not account for the
interdependency relationship from the perspective of
sustainable development. So, the paper analyses the
interdependency relationship project portfolio
network from the perspective of sustainable develop
ment. Further, we explore to build the assessment
a
https://orcid.org/0000-0001-5679-8152
b
https://orcid.org/0000-0002-7529-9065
c
https://orcid.org/0000-0002-3441-5613
d
https://orcid.org/0000-0002-2124-5678
criterion of sustainable development and present an
innovative approach to predict the risks in R&D
projects via the random walk algorithm. The paper
has three key contributions to practice: 1) it builds the
assessment criterion to analyse interdependency
relationship between projects; 2) It analyses the
relationship between risk factors using MDM. 3)
Using the interdependency relationship among
projects and initial relationship between different risk
factors as inputs of the random walk algorithm, the
proposed method can predict and analyse the risk
factors in the portfolio.
Zou, X., Yang, Q., Hu, Q. and Yao, T.
Project Portfolio Risk Prediction and Analysis using the Random Walk Method.
DOI: 10.5220/0007357202850291
In Proceedings of the 8th International Conference on Operations Research and Enterprise Systems (ICORES 2019), pages 285-291
ISBN: 978-989-758-352-0
Copyright
c
2019 by SCITEPRESS – Science and Technology Publications, Lda. All rights reserved
285

2 BUILDING THE ASSESSMENT
CRITERION AND MEASURING
THE INTERDEPENDENCY
STRENGTH IN PORTFOLIO
2.1 The Assessment Criterion
(1) Assessments of social and environmental impact
The social and environmental impact assessment is a
significant feature of sustainable development in
R&D projects. Sustainable development is the
integration of environmental, social and economic
dimensions, regularly observing the ability of projects
to deliver sustainable results on different levels
(Aarseth et al., 2016). Social sustainability of R&D
projects mainly focuses on the external value to
improve the quality of industry chain and fulfil social
responsibility. Environmental sustainability refers to
the use of energy and other resources and waste left
behind as a result of its operations during the process
of project development.
(2) Strategic alignment
Strategic has been adopted by many companies
through their mission statement and strategy (Parisi,
2013). Therefore, reviewing the project’s strategic
alignment is important approach to enhancing
competitiveness and realizing sustainable
development. However, resource limitations require
an organization to strategically allocate resources to a
subset of possible projects (Badri et al., 2001). The
strategic alignment of projects directly affects
resources available. It is fit only when project’s
objective matches the strategy of an enterprise.
Therefore, the strategic alignment can be used to
analyze if the project is in alignment with enterprise’s
strategy and the degree of alignment (Sardana et al.,
2016). In this paper, strategic alignment is measured
by the ratio between “the contribution of the project
to the business strategy” and “the strategic target
value of the business”.
(3) Project benefit contribution
In essence, profits are the ultimate purpose of the
enterprise. Projects are essential to create economic
value, benefit realization from projects is thus
strongly associated with successful organizational
performance. As one of the ways of creating
economic value, projects are strongly associated with
successful organizational performance. And,
financial methods are the most widely used in the
domain of selecting projects. In many situations,
financial methods present better results and, when
used in conjunction with other methods, results are
even better (Shwiff et al., 2013). Therefore,
considering the sustainable development concurrently,
the projects’ benefit contribution is used as a factor to
analyze the interdependency relationship. Using the
cost-benefit analysis (CBA) method to measure the
benefit contribution of projects, the CBA is defined as
a systematic process of calculating and comparing
benefits and costs and provides a basis for comparing
projects which involves comparing the total expected
costs of each project against its total expected
benefits(David et al., 2013; Hemakumara, 2017).
The CBA has two main purposes: to verify
whether the project’s benefits outweigh its costs, and
by how much; to provide a basis for comparing
projects. The steps that comprise cost-benefit analysis
of project: 1) select measurement and measure all
cost/benefit elements of each project; 2) predict
outcome of cost and benefits over relevant time period;
3) convert all costs and benefits into a common
currency; 4) apply discount rate; 5) calculate net
present value of project options; 6) calculate the cost-
benefit ratio of each project.
(4) The evolution of technology performance
The evolution of technology performance is the
key to decide the success and sustainability of R&D
projects. It can be used for monitoring the
performance of R&D process and analyzing when a
technology has reached its performance limit. The
information helps the firms adjust its technological
strategy in time, and thoroughly employ its
technology resources to achieve goals. Therefore, the
evolution of technology performance must be adopted
as a criterion to analyze the interdependency
relationship in the portfolio. Empirical evidence
points out that the S-curve is the accurate
measurement of technology performance whose
evolution is comparatively poor at its inception but
improves rapidly during heavy research and
development activity and finally matures as the
performance saturates near the physical limits or
boundaries (Arendt et al., 2012).
Using the S curve to evaluate the evolution of
technology performance involved in the R&D project,
and choosing the dimension of time to construct the S
curve that the horizontal axis represents the duration
time of R&D project and longitudinal axis refer to the
technology performance. We can intuitively identify
the performance of all the technologies, and predict
the transfer relationship of technologies in the process
of R&D project. Building the S-curve of all projects
in portfolio, the paper can intuitively identify the
performance of all the technologies and determine its
interdependency relationship.
(5) The diffusion of technology, knowledge and
experience
ICORES 2019 - 8th International Conference on Operations Research and Enterprise Systems
286

In many industries, large firms have at least
several product lines and constantly undertake
multiple development projects to add new product
lines or to improve and replace existing products. To
achieve economies of scale and scope, firms must
appropriately allocate resources and systematically
manage these multiple projects (Huemann and Silvius,
2017). Specifically, technologies, knowledge and
experience developed in one project are often reused
or transferred to other projects within the firm (Dutra
et al., 2014). Therefore, each new product
development project often has both technological and
organizational linkages and interdependencies with
other past or on-going projects. Technologies,
knowledge and experience gained from one project
can be disseminated to the other projects. Also, we
can achieve the effect of organizational learning
through the application of shared knowledge and
experience. In fact, some companies carry out basic
research projects for the sake of learning new
knowledge and experience. In this case, financial
benefits are not high in priority, but the knowledge
and experience gained for future endeavor is, and the
formal education brought into company is more
concerned. There are some projects that we are doing
mainly to gain experience in some areas. So, the paper
analyzes the interdependency relationship through the
diffusion of technology, knowledge and experience.
2.2 Measuring the Interdependency
Strength
Further, we build the portfolio dependency network
under the constraints of assessment criterions. The
network is a directed-weighted network with the
project as the "node" and the interdependence
between projects as the "edge". The direction of
"directed edges" reflects the direction of project’s
dependences.
As shown in Fig.1, the portfolio interdependency
network is built under the constraints of project
benefit contribution, and the attribute value of the
node in the network is the benefit contribution of
projects. If the benefit contribution of P1 is higher
than P
2
, it is shown that P
1
is superior to P
2
, then there
is a directed edge from P
1
to P
2
. Similarly, the
interdependency network constrained by other criteria
can be built (Fig. 1 (b) and (c)), so the final
interdependency network is shown as Fig. 1 (d).
Finally, the interdependency strength is derived from
the sum of values representing the aforementioned
interaction types. For example, if there are strategic
alignment, project benefit contribution between the
two projects and there is no other interdependency
relationship, then the interdependency strength could
be valued 2.
3 IDENTIFYING THE
RELATIONSHIP BETWEEN
RISK FACTORS USING MDM
According to the criterion from the perspective of
sustainable development, the paper concludes the risk
factors,namely: 1) choosing too many projects for
the limited resources (PR1); 2)portfolio’s imbalance
between long-term and short-term projects (PR2); 3)
the risk of social and environmental impact (PR3);4)
the risk of strategic alignment (PR4); 5) political and
social changes which leads to the changing strategy,
and project’s objectives lack of alignment with new
strategy (PR5); 6) the risk of technology, technology
maturity can’t meet project requirements(PR6);7)
lacking diffusion in technology and
knowledge/experience(PR7);8) not having cross-
trained staff who can easily switch from project to
project(PR8) .
Furthermore, the paper investigates the probability of
risks in the portfolio, then we use MDM to identify
the relationship between risk factors.
The MDM is an extension of DSM modeling in which
two or more DSM models in different domains are
represented simultaneously, each single-domain
P
2
P
1
P
3
P
5
P
4
P
2
P
1
P
3
P
5
P
4
P
2
P
1
P
3
P
5
P
4
P
2
P
1
P
3
P
5
P
4
(a)
(b)
(c) (d)
Figure 1: The independency network of the project portfolio.
Project Portfolio Risk Prediction and Analysis using the Random Walk Method
287
11
_ ( , ) ( _ ( , ) ( _ ( , ) _ ( , )))
mm
i j i i j j i j
i j j i
R DSM P P PR DMM R P PR DMM R P P DSM P P
,
(1)
R
1
R
2
R
3
R
4
R
5
R
1
R
2
R
3
R
4
R
5
R
1
.14 .17
.2
.17
.12
R
2
.11
.15
.13
.38
.33 R
3
.45
.41
.45
.47 .5
R
4
.5
.37
.36 .41
.45
R
5
.44
.42 .44
.45
.44
.09
.09 .12
.14
.12
.54
.58 .58
.57
.57
.22
.12 .23
.13
.11 .17
.42
.38 .47
.5
.45 .52
.44
.37 .47
R
6
.43 .43
.15
R
7
.16
.54
.55 R
8
R
6
R
7
R
8
R
6
R
7
R
8
(a) Portfolio-risk MDM
(b) Risk factors DSM
P
1
P
2
P
3
P
4
P
5
P
1
P
1
.25
.19
.11
.13
P
2
.12 P
2
.14
.27
.12
P
3
.11 .05
P
3
.23
.03
P
4
.13 .61
.46
P
4
.32
P
5
.07 .17
.13
.16
P
5
R
1
.6
.8
R
2
.4
.1 .4
R
3
.5 .7 .3 .3 .6
R
4
.7 .3
.6
.6
.4
R
5
.6 .4
.7
.4
.3
R
6
.1 .5 .7
.6
R
7
.3
.5 .2
R
8
.6 .3
.2
.9
.5
R
1
.14 .17
.2
.17
.12
R
2
.11
.15
.13
.38
.33 R
3
.45 .41
.45
.47 .5
R
4
.5
.37
.36 .41
.45
R
5
.44
.42 .44
.45
.44
.09
.09 .12
.14
.12
.54
.58 .58
.57
.57
.22
.12 .23
.13
.11 .17
.42 .38 .47
.5
.45 .52
.44 .37 .47
R
6
.43 .43
.15
R
7
.16
.54
.55 R
8
Portfolio DSM
Portfolio-risk DMM
Risk DSM
Figure 2: The calculation of initial PR_DSM.
DSM is on the diagonal of the MDM, and the off-
diagonal blocks are DMMs(Eppinger and
Browning,2012). The DSM method proposed by
Steward (1981) is a powerful structural method to
represent the elements comprising a system and their
dependencies (Yang et al., 2015).
The P_DSM is a square matrix with diagonal
entries representing projects and off-diagonal entries
(i, j) representing the interdependency strength
between projects. In the R_DSM the elements of
column represent instigating risk and the elements of
row represent the affected risk, Let R_DSM (m, n)
represents the influencing strength of risk n on risk m,
that is, the conditional probability of risk m if risk n
occurs.
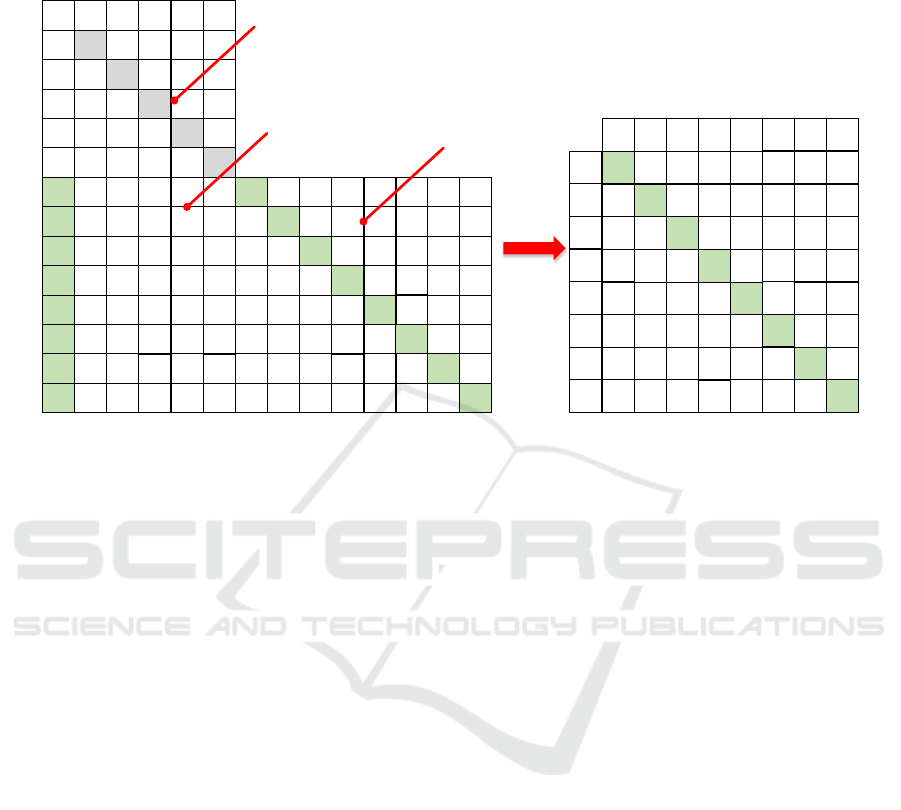
To identify the R_DSM and analyze the
relationship between risk factors, the paper uses
Multidomain matrix (MDM) to build the portfolio-
risk matrix. As shown in Fig. 2, the MDM consists of
three essential parts: the portfolio DSM (P_DSM), the
portfolio risk domain mapping matrix (PR_DMM)
and the risk DSM (R_DSM). The P_DSM describes
the interdependency strength among projects in the
portfolio; the PR_DMM reflects the relationship
between project and risk. The R_DSM can be
calculated by using equation 1.
4 PROJECT PORTFOLIO RISK
NETWORK ANALYSIS BASED
ON RANDOM WALK
There are three steps to build the model of project
portfolio risk network analysis based on random walk
with restart method: 1) Building the portfolio-risk
network and simulating the walker’s random walk
process in the portfolio network; 2) Realizing the
simulation of the walk process when the iteration
approaches infinity (i.e. realizing infinite random
walk simulation) and extracting the stable probability
distribution of the random walker in the portfolio risk
network; 3)Analyzing the portfolio risk based on this
stable probability distribution value.
4.1 Random Walk with Restart Method
The fundamental idea of the random walk algorithm
is that the walker starts from one node in the network
and travels through the whole network graph. Then,
in each step of the journey, the walker may select to
move to the adjacent node of the current node with
probability α or choose to jump to other non-neighbor
node with probability 1-α (Gan and Jiang, 2015). In
the random walk with restart algorithm, the walker
ICORES 2019 - 8th International Conference on Operations Research and Enterprise Systems
288

can not only choose to move to the adjacent node and
jump to the non-neighbor node, but also return to the
starting node with a certain probability v to start a new
walk. Therefore, random walk with restart considers
not only the relationship between the two different
domains, but also the internal relationship between
the two domains, making the analysis more accurate
from the overall network.
4.2 Random Walk in the Portfolio
Network
In the network of project portfolio, the walker start
form one node in the network, such as projects or risk
factors, and travel through the whole portfolio
network. Then, in each step of the journey, the walker
may select to move to other projects or risk factors
with probability α or start a new journey with
probability 1-α. A new journey means that the walker
will start form one node in the network again. Each
movement of the walker produces a probability
distribution. Based on it, the walker makes the next
movement and the probability distribution of the next
movement could be iteratively calculated. The walker
continues to move, and the probability distribution
could be continuously iteratively calculated. After a
certain number of iterations, the probability
distribution will tend to a certain value and finally
obtain a stable probability distribution.
The risk factors
layer
R_DSM
P_DSM
R_DSM
DMM
P_DSM
A
E
R
2
R
3
R
4
R
1
P
1
P
2
P
3
P
4
P
5
R A
A
T
The portfolio
layer
Figure 3: The project portfolio risk network based on the
random walk with restart method.
Fig. 3 depicts the calculation process for solving
the relationship between risk factors via the random
walk with restart algorithm. Fig. 3 (a) shows the
portfolio risk network model; Fig.3 (b) shows the
random walk process of the walker in the portfolio
risk network. The influence relationship matrix
between risk factors can be obtained via the random
walk with restart algorithm as shown in Fig.3(c).
4.3 The Calculation Process of Random
Walk with Restart Algorithm
The random walk process of the walker in portfolio
risk network can be described as matrix X,
~~
~
~
(1 )
(1 )
T
RA
X
AP
(2)
where R is the influence relationship matrix among
risk factors, P is the interaction intensity matrix
between projects, A is the correspondence matrix
between the project and risk factors, and A
T
is the
transpose matrix of A (reflecting the correspondence
between risk factors and project);
~
R
、
~
P
、
~
A
、
~
T
A
are
matrix after the above matrix normalization
respectively. Normalizing the matrix X can obtain the
random walk matrix W of the random walker in the
portfolio risk network, where represents the
probabilities that the random walker moves from the
node j to i, m the number of items in the portfolio and
n is the number of risk factors.
Starting from project P
j
, we analyze its
relationship in project portfolio risk network. R
j
(0)
represents the relationship between project P
j
and the
risk factor layer which can be obtained by the
correspondence matrix between the project and risk
factors. P
j
(0)
represents the relationship between
project P
j
and other projects in portfolio which could
be obtained by the interaction intensity matrix
between projects. Therefore, the relationship vector
x
j
(0)
of project P
j
in portfolio risk network is defined
as equation 3.
(0)
(0)
(0)
(1 )
j
j
j
R
x
P
(3)
where
is the weight of relationship between project
and risk factors and
1
is the weight of project
portfolio layer. By normalizing x
j
(0)
, we obtain the
initial probability vector of project PV
j
(0)
. The initial
probability vectors of all the projects in the "Portfolio
Network Layer" are constructed into the initial
probability matrix PV
(0)
.
The matrix represents the initial probability of the
random walker staying at each node on the portfolio
risk network. If
()
()
()
ij
tt
m n n
PV pv
denotes the
probability of staying at each node at time t. The
probability matrix PV tends to be stable when the
number of iterations is infinite, so a stable probability
value
PV
can be obtained.
PV
is
()m n m
matrix, where m represents the number of projects in
portfolio and n represents the number of risks in the
risk factors layer. It can be seen from the structure of
the PV
(0)
matrix that the first to n rows reflect the
correspondence between the project portfolio and the
risk factors layer, so the first to n rows of the
PV
matrix are intercepted to analyze the portfolio risk.
Project Portfolio Risk Prediction and Analysis using the Random Walk Method
289

1
(0)
(1 )
T
PV v I v W PV
(4)
Through the calculation of random walk, we
achieve an accurate prediction of portfolio risk
through predicting the risk factors and their
probabilities in the portfolio.
5 AN ILLUSTRATIVE EXAMPLE
The following case study will illustrate how the model
and methodology developed in the preceding sections
can be applied in a real-work setting. Based on the
research and development of aeronautical equipment
(P
1
-P
5
), the paper analyzes the interdependency
relationship between different projects in the portfolio,
identifies risk factors (R
1
-R
8
) and determines the
potential relationship between different risk factors.
Moreover, using the random walk, we predict the risk
factors and its probability in the portfolio. The risk
factors are technical risk, scope management risk,
organization management risk, schedule management
risk, cost management risk, supplier management,
quality management risk and market competition risk.
Firstly, as shown in Fig.2, the paper calculates the
interdependency strength between different projects
_ ( , )
ij
P DSM P P
, the relationship between risk factors
and projects
_ ( , )
jj
PR DMM R P
, the risk factors and
its potential relationship
_ ( , )
ij
R DSM R R
. Further,
building the network model of portfolio risk, taking
the interdependency strength between different
projects, the relationship between risks and projects,
and the relationship between risk factors as the input
data, we can get the results of “predicting the risk
factors in portfolio” using random walk. From the
output results, we can accurately predict the risk
factors and its probability in the portfolio and achieve
the targeted analysis of risk factors. Also, it can help
the project managers to intuitively distinguish the
most concerned risks, for example, the R
4
is highest
in the project P
1
and R
3
is highest in the project P
2
.
Correspondingly, we can calculate the risk
severity in the portfolio (P_RS_DSM) using equation
5, calculation results show that the ranking of risk
factors in the portfolio is R
8
-R
4
-R
3
-R
5
-R
6
-R
1
-R
7
-R
2
.
1
_ _ ( ) _ ( , )
m
i i j
j
P RS DSM R R DSM R R
(5)
.121 .06 .048 .116.042
.2 .113 .121 .17.141
.134 .169 .177 .139.179
.145 .179 .138 .116.159
.05 .178 .051 .047.147
P
2
P
3
P
4
P
5
P
1
.165 .067 .188 .171.074
.046 .125 .047 .08.093
.14 .109 .231 .161.165
R
1
R
2
R
3
R
4
R
5
R
6
R
7
R
8
Figure 4: Output matrix of portfolio risk network using
random walk.
6 CONCLUSIONS
To assist managers in facing risks in the portfolio
environment, the paper analyses risk factors in the
project portfolio network via the random walk
algorithm. On the basis of analyzing the
interdependency relationship among projects, the
paper measures the strength using complex network.
Then, we builds the risk network of project portfolio.
Using the interdependency relationship among
projects and potential relationship between different
risk factors as inputs, the paper builds the model of
portfolio risk network to predict the risk in the project
portfolio via a random walk algorithm.
In the highly competitive global market
environment, it is necessary for enterprises to carry
out multiple projects and seek complementary
advantages between projects to maximize their profits
under the constraints of limited resources. Identifying
the portfolio risk is an important issue that decision-
makers cannot avoid. The project portfolio risk is a
complex system which has multi-level, nonlinear and
emergent characteristics. In the portfolio risk network,
different levels and different nodes at the same level
are interdependent each other, and exists a correlation
effect. So, the paper focused the following work: 1) It
analyzes the interdependencies between projects from
the perspective of sustainable development; 2) It
builds models to identify the relationship between risk
factors using Multidomain matrix (MDM) model; 3)
It builds the model of portfolio risk network to predict
the risks in the portfolio and rank these risk factors in
the portfolio via random walk method.
Our novel approach integrates various kinds of
direct and indirect relationship among projects. By
ICORES 2019 - 8th International Conference on Operations Research and Enterprise Systems
290

considering projects as portfolio risk networks,
including the single network (the project layer and the
risk layer) and corresponding relationship network,
and using random walk algorithm to measuring the
risk factors in the portfolio.
Nevertheless, the approach has also some
limitations that are outlined in the following. Since
this is a mathematical deductive approach, we had to
make a few assumptions. For instance, we calculate
the interdependency strength deriving from the sum
of values representing the aforementioned interaction
types. We try to more accurately measure the strength
of dependencies among projects in the next step.
ACKNOWLEDGEMENTS
This study was supported by the National Natural
Science Foundation of China (No. 71472013,
71528005 and 71872011).
REFERENCES
Aarseth, W., Ahola, T., Aaltonen, K., Økland, A.,
Andersen, B., 2016. Project sustainability strategies: a
systematic literature review. International Journal of
Project Management, 35(6), 1133-1150.
Arendt, J. L., Mcadams, D. A., Malak, R. J., 2012.
Uncertain technology evolution and decision making in
design. Journal of Mechanical Design, 134(10),
100904.
Badri, M. A., Davis, D., Davis, D., 2001. A comprehensive
0–1 goal programming model for project selection.
International Journal of Project Management, 19(4),
243-252.
David, R., Ngulube, P., Dube, A., 2013. A cost-benefit
analysis of document management strategies used at a
financial institution in Zimbabwe: a case study. South
African Journal of Information Management, 15(2), 1-
10.
Dutra, C. C., Ribeiro, J. L. D., Carvalho, M. M. D., 2014.
An economic–probabilistic model for project selection
and prioritization. International Journal of Project
Management, 32(6), 1042-1055.
Eppinger, S. D., Browning, T. R., 2012. Design Structure
Matrix methods and applications. MIT Press Books, 1.
Gan, M., Jiang, R., 2015. ROUND: Walking on an object–
user heterogeneous network for personalized
recommendations. Expert Systems with Applications,
42(22), 8791-8804.
Ghasemi, F., Sari, M., Yousefi, V., Falsafi, R.,
Tamošaitienė, J., 2018. Project portfolio risk
identification and analysis, considering project risk
interactions and using Bayesian networks.
Sustainability, 10(5), 1609-1632.
Hemakumara, G., 2017. Cost-Benefit Analysis of Proposed
God agama development node under the Greater Matera
development planning program. International Research
Journal of Management and Commerce, 4(9), 2348-
9766.
Huemann, M., Silvius, G., 2017. Projects to create the
future: managing projects meets sustainable
development. International Journal of Project
Management, 35(6), 1066-1070.
Parisi, C., 2013. The impact of organisational alignment on
the effectiveness of firms’ sustainability strategic
performance measurement systems: an empirical
analysis. Journal of Management & Governance, 17(1),
71-97.
Sardana, D., Terziovski, M., Gupta, N., 2016. The impact
of strategic alignment and responsiveness to market on
manufacturing firm's performance. International
Journal of Production Economics, 177, 131-138.
Shwiff, S. A., Anderson, A., Cullen, R., White, P. C. L.,
Shwiff, S. S., 2013. Assignment of measurable costs
and benefits to wildlife conservation projects. Wildlife
Research, 40(40), 134-141.
Silvius, A. J. G., Kampinga, M., Paniagua, S., Mooi, H.,
2017. Considering sustainability in project management
decision making; an investigation using q-
methodology. International Journal of Project
Management, 35(6), 1133-1150.
Yang, Q., Kherbachi, S., Hong, Y. S., Shan, C., 2015.
Identifying and managing coordination complexity in
global product development project. International
Journal of Project Management, 33(7), 1464-1475.
Project Portfolio Risk Prediction and Analysis using the Random Walk Method
291
