
Digital Picture Co-occurrence Texture Characteristics Discriminate
between Patients with Early Dementia of Alzheimer’s Type and
Cognitive Healthy Subjects
Sibylle Robens
1
, Thomas Ostermann
1
, Sebastian Unger
1
, Petra Heymann², Stephan Müller
3
,
Christoph Laske
3
and Ulrich Elbing
2
1
Department of Psychology and Psychotherapy, Witten/Herdecke University, Witten, Germany
2
Institut for Research and Development in Arts Therapies, Nürtingen-Geislingen University, Nürtingen, Germany
3
Department of Psychiatry and Psychotherapy, Eberhard Karls University, Tübingen, Germany
stephan.mueller@med.uni-tuebingen.de, christoph.laske@med.uni-tuebingen.de, ulrich.elbing@hfwu.de
Keywords: Gray Level Co-occurrence Matrix, Digital Device, Alzheimer’s Disease Screening.
Abstract: Gray level co-occurrence texture characteristics of digital drawings were compared between persons with
early dementia of Alzheimer’s disease and healthy controls. It was hypothesized that texture characteristics
contribute to the differentiation between these subject groups. The study population consisted of 67 healthy
subjects and 56 patients with early dementia of Alzheimer’s type. Between subject groups comparisons of
texture entropy, homogeneity, correlation and image size were conducted with Mann-Whitney-U tests. The
diagnostic power of combining all texture features as explanatory variables was analysed with a logistic
regression model and the area under curve (AUC) of the corresponding receiver operating control (ROC)
curve was calculated. The gray level co-occurrence characteristics differed significantly between healthy
and demented subjects and the logistic regression model resulted in an AUC of 0.86 (95% CI [0.80, 0.93],
sensitivity=.80, specificity=.79).
1 INTRODUCTION
Alzheimer’s disease (AD) is the most common form
of dementia and with the further development of
disease modifying therapies, the screening of early
symptoms becomes increasingly important.
Symptoms in the early stage include forgetting
recently learned information, difficulty in
completing familiar tasks at work or in household, or
troubles in following a conversation. Apart from
these symptoms occuring in daily life, early
symptoms also include problems in the handling of
visual images and spatial relationships. This
manifests in perceptual difficulties, i.e., in reading,
but also in processing difficulties, i.e., in writing or
drawing (Alzheimer’s Association, 2017; Trojano
and Gainotti, 2016). In particular, as the process of
drawing involves the interaction of several cognitive
mechanisms, drawing deficits may be used as a
diagnostic tool in detecting psychological or
cognitive impairment.
This idea was operationalized in the development
of projective tests in the very early 20
th
century.
Originating from childrens drawings, Goodenough
(Goodenough,1936) developed the first idea of using
drawings as a tool for psychological assessment for
intelligence. In parallel Emil Jucker, a swiss
occupational counselor in 1298 initiated the idea of
using the picture of a tree for counseling (Koch,
1949). The interpretation of tree drawings was not
that intuitive, as a variety of parameters were
considered to have a diagnostic validity, such as
hight of the trunk, skewness, line thickness or the
percentage of paper place used for the drawing.
Within the last two decades, several authors have
used projective drawing tests in clinical diagnostics
and have developed evaluation schemes (Pintea et
al., 2013). Although these approaches seem to be
promising, a clinical validation with respect to their
relevance on the diagnosis of dementia still is
lacking.
Actually several drawing tests are applied in the
screening of dementia which are often included in
88
Robens, S., Ostermann, T., Unger, S., Heymann, P., Müller, S., Laske, C. and Elbing, U.
Digital Picture Co-occurrence Texture Characteristics Discriminate between Patients with Early Dementia of Alzheimer’s Type and Cognitive Healthy Subjects.
DOI: 10.5220/0007357500880093
In Proceedings of the 12th International Joint Conference on Biomedical Engineering Systems and Technologies (BIOSTEC 2019), pages 88-93
ISBN: 978-989-758-353-7
Copyright
c
2019 by SCITEPRESS – Science and Technology Publications, Lda. All rights reserved
test batteries. In particular, the clock drawing test
(Shulman et al., 1993) has been considered as a tool
for detection of mental impairments related to
dementia, as it shows a high sensitivity and specifity
(Shulman et al., 2000). The paper drawings of
common screening tests are usually analysed and
scored by specialists after the drawing process.
Another line of research has come across using
more drawing related topics such as colourfulness by
means of computer aided image analysis (Heymann
et al., 2018). An innovative approach in this respect
is given by the use of digital media. Instead of
drawing the picture on a paper sheet, a digital pad is
used. Using this digital equipment, analysis of
drawing process itself with parameters such as line
drawing speed and on-air-movements during the
whole drawing process can be obtained and have
been subject to previous research (Müller et al.,
2017; Souillard-Mandar et al., 2016).
The current study examined if texture features
derived from digital tree drawings were able to
discriminate between cognitive healthy subjects and
patients with early dementia of Alzheimer’s disease
(early AD). Sixty-seven healthy subjects and 56
patients diagnosed with early AD painted a tree from
their memory on a digitizing tablet with a pressure-
sensitive pen. Besides several drawing features, the
texture parameters homogeneity, entropy and
correlation extracted from the gray-level co-
occurrence matrix (GLCM) (Haralick et al., 1973)
and the picture size were computed. The gray-level
co-occurrence matrix is a statistical method of
texture analysis, which takes into account the spatial
relationship of image pixels. Its application is
studied in different clinical settings, e.g. in the
differentiation of healthy from pathological tissues
in mammograpy (Pratiwi et al., 2015), the
identification of bone leasures to assess the risk of
fractures (Shirvaikar et al., 2016) or in the detection
of skin diseases (Parekh et al., 2011).
It was hypothized that texture features contribute
to the differentiation between cognitive healthy and
early demented subjects.
2 MATERIAL AND METHODS
Subjects were recruited from the Memory Clinic of
the University Hospital of Tübingen, Germany and
the study was approved by the local ethical
committee. All subjects were right-handed, had
normal or corrected-to-normal visual acuity, no
severe hearing impairments and no physical
restrictions to perform drawings. The subjects
underwent clinic interviews and neuropsychological
tests. In case of suspected cognitive deficits further
examinations, e.g. brain images and special
laboratory tests were made. Fifty-six patients (40
women, 16 men, mean age = 66 ± 10 years) were
diagnosed with early AD, according to the National
Institute of Neurological and Communicative
Disorders and Stroke Alzheimer’s Disease and
Related Disorders Association (McKhann et al.,
1984).
Sixty-seven persons (25 women, 42 men, mean
age = 70 ± 11 years) had no signs of cognitive
impairment confirmed by a clinical interview and
neuropsychological tests. They formed the healthy
control group.
The drawing task was first introduced by
Heymann (Heymann et al., 2018). All subjects were
told to draw a tree by memory without time
restrictions on a tablet with a digital pen. Whereas at
Heymann’s study the resulting pictures were
analysed per view by dementia specialized art
therapists, drawing characteristics were calculated in
the current study with a software program from
attendra GmbH, Tübingen. The drawing program
allowed choosing between 12 different colours and 3
line widths. The software recorded several variables,
e.g. the total numbers of colours and line widths and
the number of colour or line width changes, the
pressure, the velocity, the pen-up / pen-down
relations and the texture features.
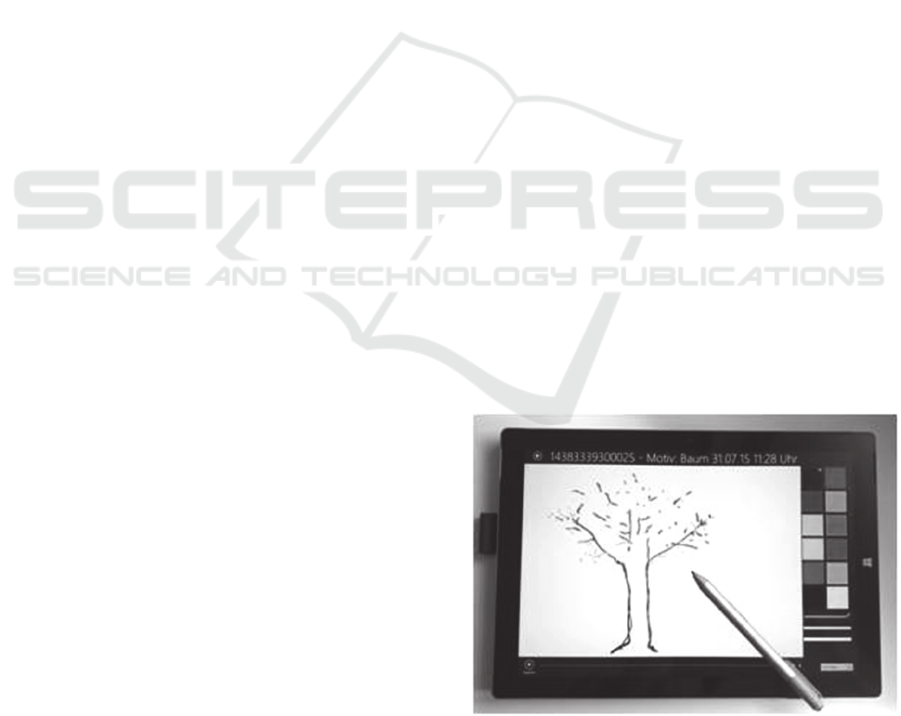
The digital device was a multi-touch Surface Pro
3 tablet with a digital stylus (Figure 1). Windows 8.1
Pro software was implemented and the tablet had an
Intel Core i7-4650U processor with 1.7 to 3.3 GHz.
The screen had a 3:2 aspect ratio with a display area
of 25.4cm x 16.9cm and a resolution of 2160 x 1440.
Figure 1: Digital device with drawing program.
Texture characteristics based on Haralick’s
GLCM (Haralick et al., 1973) describe visual
Digital Picture Co-occurrence Texture Characteristics Discriminate between Patients with Early Dementia of Alzheimer’s Type and
Cognitive Healthy Subjects
89
patterns of an image, regarding its structural surface
arrangement. The GLCM is a square matrix where
the number of rows and columns is equal to the
number of different gray levels in the image. Each
GLCM matrix element (i,j) represents the frequency
a pixel with gray level value i is adjacent to a pixel
of value j for a given distance d and angle θ, which
defines the direction of the spatial relationship
between both intensities i and j. GLCM texture
features are extracted using the nearest neighbor
distance d=1 and the four angles θ=0° (horizontal),
θ=90° (vertical), θ=45° (right-diagonal) and θ=135°
(left-diagonal).
For example we look at an image with window
size four and four gray levels:
Table 1: Example of a 4x4 image matrix with four gray
tones.
0 1 1 3
0 0 2 3
1 2 3 0
2 3 3 2
The corresponding GLCM at distance d=1 and
angle θ=0° is then defined as:
Table 2: Gray-level co-occurrence matrix of example
image with distance=1 and angle=0°.
j=0 1 2 3
i=0 1 1 1 0
1 0 1 1 1
2 0 0 0 3
3 1 0 1 1
By dividing each GLCM element (i,j) by the
total sum of the matrix elements, the resulting
elements P(i,j) of the normalized GLCM can be
considered as the probabilities of finding the specific
spatial relationship. Haralick proposed several scalar
texture measures which are extracted from the
normalized GLCM. With
P(i,j) = Element ij of the normalized GLCM
N = Number of gray levels in the image
,
,
²
,
,
²
the following texture features were calculated:
Entropy: Measures the local variations in the
GLCM. The entropy is small when the image is
texturally uniform.
,
,
,
(1)
Correlation: Measures the gray level linear
dependence between the pixels at the specified
positions relative to each other.
,
²
,
(2)
Homogeneity: Large homogeneity values
indicate that the image contains only few gray
levels.
,
1
²
,
(3)
Format full frame: The area covered by tree
image pixels in relation to the available display
area.
All statistical calculations were done using SAS
(Version 9.4) and p-values < .05 were considered to
be significant.
3 RESULTS
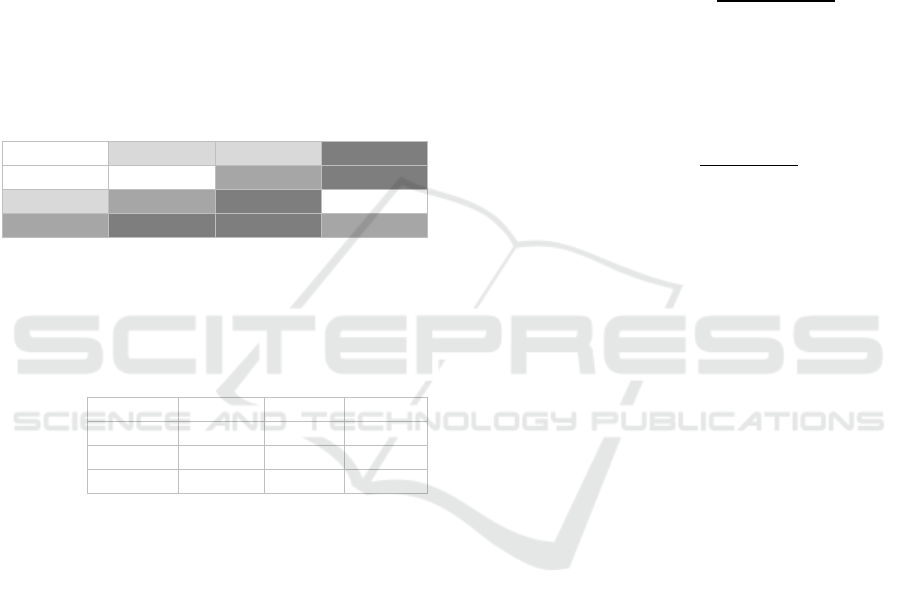
Entropy: Frequency polygon charts of entropy data
separated by subject groups (Figure 2a) revealed a
much more right skewed distribution of demented
patients than the distribution of the healthy subjects.
These indicated smaller entropies, i.e., more uniform
images, in the early AD group. Median comparisons
with Mann-Whitney-U-Tests supported this by
significant differences between healthy and early
demented subjects with a p-value < .0001 (Figure
2b).
Correlation: Both distributions of texture
correlation were left skewed but with a smaller peak
for the early AD group, revealing smaller texture
correlations for the demented (Figure 3a). Median
comparisons of texture correlation supported this by
showing significant differences between both subject
groups (p<.05) (Figure 3b).
HEALTHINF 2019 - 12th International Conference on Health Informatics
90
(a)
(b)
Figure 2: Frequency polygon charts (a) and boxplots (b) of
GLCM texture entropy separately for healthy subjects
(n=67) and patients with early AD (n=56).
(a)
(b)
Figure 3: Frequency polygon charts (a) and boxplots (b) of
GLCM texture correlation separately for healthy subjects
(n=67) and patients with earlyAD (n=56).
Homogeneity: The left skewed distribution of the
demented was, compared to the healthy group, more
shifted to the right, indicating more homogenous
images for them (Figure 4a). This was supported by
a significant larger median in the early AD group (p-
value < .0001) (Figure 4b).
(a)
(b)
Figure 4: Frequency polygon charts (a) and boxplots (b) of
GLCM texture homogeneity separately for healthy
subjects (n=67) and patients with earlyAD (n=56).
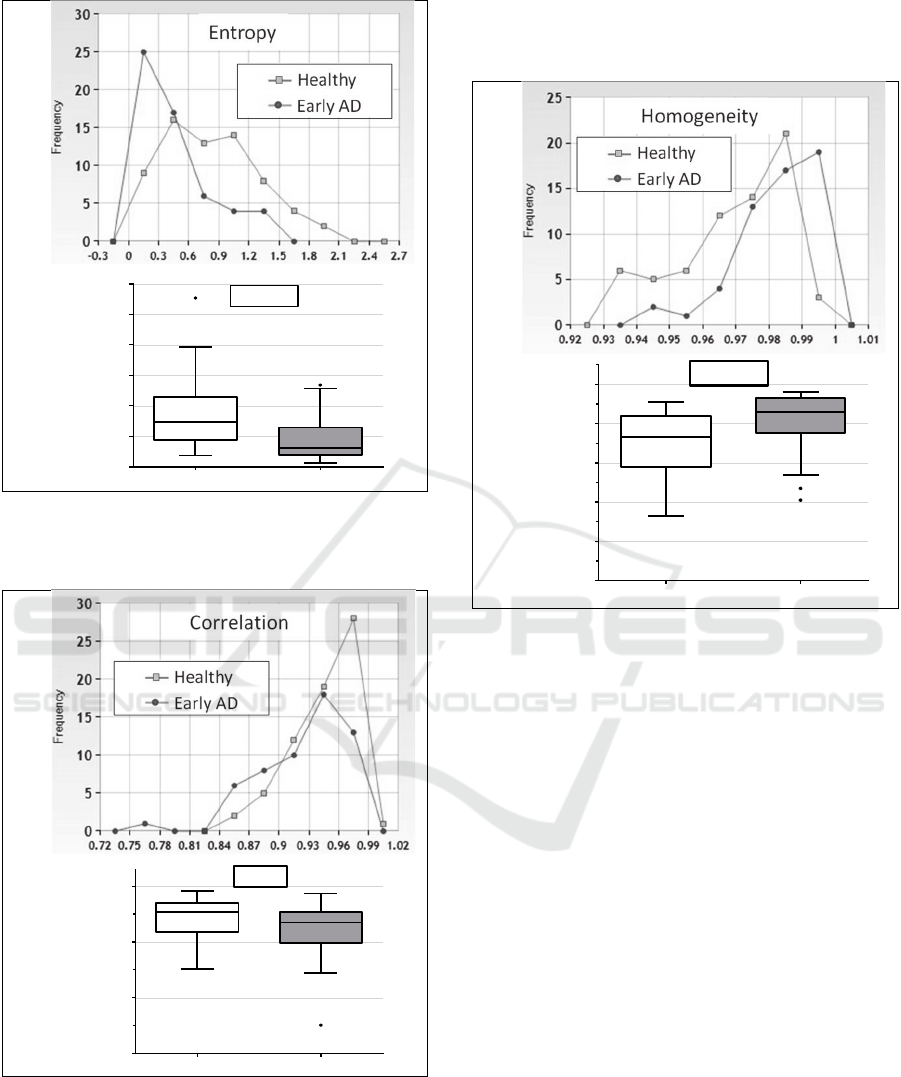
Format full frame: The distribution of the early AD
group was nearly symmetric compared to a left
skewed distribution of the healthy group (Figure 5a).
The images of the cognitive impaired subjects were
significant smaller than those of the cognitive
healthy ones (Mann-Whitney-U test, p-value <
.0001) (Figure 5b).
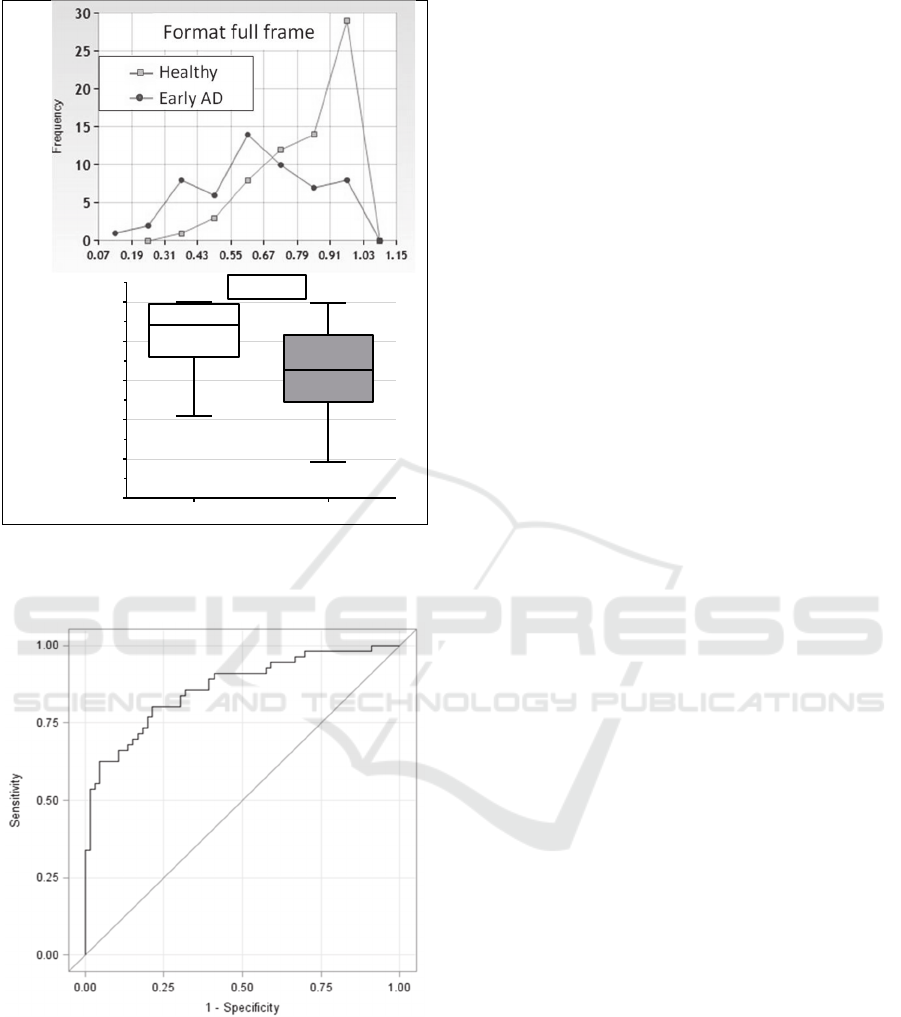
A ROC-curve analysis was performed to
evaluate if a combination of the texture
characteristics was able to discriminate well between
cognitive healthy and subjects with early dementia.
The ROC-Curve was calculated with a gender-,
education- and age-adjusted logistic regression
model. All four texture feature entropy, correlation,
homogeneity and format full frame were included as
factors (Figure 6). The corresponding AUC was
equal 0.864 with a 95% confidence interval of
[0.799; 0.929]. The Youden-Index calculation
resulted in a sensitivity of 0.804 and a specificity of
0.788.
0.0
0.5
1.0
1.5
2.0
2.5
3.0
Entropy
Healthy
Early AD
p<.0001
0.7
0.8
0.9
1.0
Correlation
Healthy
Early AD
p< .05
0.90
0.92
0.94
0.96
0.98
1.00
H
o
m
o
g
e
n
e
i
t
y
Healthy
Early AD
p< .0001
Digital Picture Co-occurrence Texture Characteristics Discriminate between Patients with Early Dementia of Alzheimer’s Type and
Cognitive Healthy Subjects
91
(a)
(b)
Figure 5: Frequency polygon charts (a) and boxplots (b) of
the picture size (format full frame) separately for healthy
subjects (n=67) and patients with earlyAD (n=56).
Figure 6: ROC curve for discrimination of healthy subjects
(n=67) from patients with early AD (n=56).The logistic
regression model was adjusted for gender, age and
education level and texture variables entropy, correlation,
homogeneity and format full frame were includes as
factors.
4 CONCLUSIONS
The study investigated if gray-level co-occurrence
texture features of digital drawings can contribute to
the differentiation between cognitive healthy and
mildly demented patients. Subjects in an early stage
of Alzheimer’s dementia showed significant
differences in texture features compared to cognitive
healthy subjects. A reduction in entropy, correlation
and picture size and an increase in homogeneity
were observed for the early demented group. In line
with these findings, characteristic drawing disorders
of AD patients have been reported in literature as
omissions, simplifications, and impaired perspective
and spatial relations (Gragnaniello et al., 1998; Kirk
and Kertesz, 1991; Trojano and Gainotti, 2016). The
ROC-Curve, with all texture characteristics
included, separated cognitive healthy and early
demented subjects very good with an AUC of 0.86.
Essential requirements to a dementia screening
tool are a high sensitivity and specificity and a fast
and easy handling procedure with a good patient
acceptance. Our obtained results indicate that the
analysis of texture features in a digital drawing test
might be a reasonable approach to discriminate
between healthy and early demented subjects as it
results in a sensitivity and specificity of about 80%.
The creative procedure of drawing a tree without
performance pressure and time restrictions is
furthermore less stressful than for example memory
tests, where the patient is confronted with his
cognitive deficits. This leads to a good patient’s
acceptance. Using a digital device instead of paper
allows for an objective evaluation of drawing
features and the images don’t have to be rated by a
trained specialist.
Although the study results are very promising,
further analysis and validation is needed, especially
with a larger sample size and the inclusion of
persons with amnestic mild cognitive impairment,
who are more likely to develop AD than people
without it (Petersen, 2004).
Our future aim is to automatically calculate a
decision-value from the linear combination of the
texture features adjusted for age, gender and
education and to provide a cut-off value for
healthcare professionals to support their decision
whether the patient needs further clinical
examinations or not.
0.0
0.2
0.4
0.6
0.8
1.0
Format full frame
Healthy
Early AD
p< .0001
HEALTHINF 2019 - 12th International Conference on Health Informatics
92

REFERENCES
Alzheimer's Association (2017). 2017 Alzheimer's disease
facts and figures. Alzheimer's & Dementia, 13(4), 325-
373.
Goodenough, FL. (1926). Measurement of intelligence by
drawings. Oxford, England: World Book Co.
Gragnaniello, D., Kessler, J., Bley, M., and Mielke, R.
(1998). [Copying and free drawing by patients with
Alzheimer disease of different dementia stages].
Nervenarzt, 69(11), 991-998.
Haralick, R. M., Shanmugam, K., and Dinstein, I. h.
(1973). Textural features of image classification. IEEE
Transactions on Systems, Man, & Cybernetics, 3(6),
610-621. doi:10.1109/TSMC.1973.4309314
Heymann, P., Gienger, R., Hett, A., Muller, S., Laske, C.,
Robens, S., Ostermann, T., Elbing, U. (2018). Early
Detection of Alzheimer's Disease Based on the
Patient's Creative Drawing Process: First Results with
a Novel Neuropsychological Testing Method. J
Alzheimers Dis, 63(2), 675-687.
Kirk, A. and Kertesz, A. (1991). On drawing impairment
in Alzheimer's disease. Arch Neurol, 48(1), 73-77.
Koch, K. (1949). Der Baumtest: der Baumzeichenversuch
als psychodiagnostisches Hilfsmittel: Huber.
McKhann, G., Drachman, D., Folstein, M., Katzman, R.,
Price, D., and Stadlan, E. M. (1984). Clinical
diagnosis of Alzheimer's disease. Report of the
NINCDS-ADRDA Work Group* under the auspices of
Department of Health and Human Services Task
Force on Alzheimer's Disease, 34(7), 939-939.
Muller, S., Preische, O., Heymann, P., Elbing, U., and
Laske, C. (2017). Increased Diagnostic Accuracy of
Digital vs. Conventional Clock Drawing Test for
Discrimination of Patients in the Early Course of
Alzheimer's Disease from Cognitively Healthy
Individuals. Front Aging Neurosci, 9, 101.
Parekh, R., and Mittra, A. K. (2011). 2011 : Automated
Detection of Skin Diseases using Texture Features
(Vol. 3).
Petersen R.C. (2004). Mild cognitive impairment as a
diagnostic entity. J Intern Med. 256, 183-194.
Pintea, F., Lacrama, D. L., Musuroi, C., Karnyanszky, T.
M., and Toma, C. (2013). Automatic Pre-
Classification of Baum Test Images.
Pratiwi, M., Alexander, Harefa, J., and Nanda, S. (2015).
Mammograms Classification Using Gray-level Co-
occurrence Matrix and Radial Basis Function Neural
Network. Procedia Computer Science, 59, 83-91.
Shirvaikar, M., Huang, N., and Dong, X. N. (2016). The
measurement of bone quality using gray level co-
occurrence matrix textural features. Journal of medical
imaging and health informatics, 6(6), 1357-1362.
Shulman, K. I. (2000). Clock-drawing: is it the ideal
cognitive screening test? Int J Geriatr Psychiatry,
15(6), 548-561.
Shulman, K. I., Gold, D. P., Cohen, C. A., and Zucchero,
C. A. (1993). Clockdrawing and dementia in the
community: A longitudinal study. Int J Geriatr
Psychiatry, 8(6), 487-496.
doi:doi:10.1002/gps.930080606
Souillard-Mandar, W., Davis, R., Rudin, C., Au, R.,
Libon, D. J., Swenson, R., Price, C.C., Lamar, M.,
Penney, D. L. (2016). Learning Classification Models
of Cognitive Conditions from Subtle Behaviors in the
Digital Clock Drawing Test. Mach Learn, 102(3),
393-441.
Trojano, L., and Gainotti, G. (2016). Drawing Disorders in
Alzheimer's Disease and Other Forms of Dementia. J
Alzheimers Dis, 53(1), 31-52.
Digital Picture Co-occurrence Texture Characteristics Discriminate between Patients with Early Dementia of Alzheimer’s Type and
Cognitive Healthy Subjects
93
