A Novel Approach for Anomaly Detection in Power
Consumption Data
C. Chahla
1
, H. Snoussi
1
, L. Merghem
2
and M. Esseghir
2
1
University of Technology of Troyes, Institute Charles Delaunay-LM2S, Troyes, France
2
University of Technology of Troyes, Institute Charles Delaunay-ERA, Troyes, France
Keywords: Anomaly Detection, K-means, Auto-Encoders, LSTM, Power Consumption, Big Data.
Abstract: Anomalies are patterns in data that do not follow the expected behaviour and they are rarely encountered.
Anomaly detection has been widely used within diverse research areas such as credit card fraud detection,
image processing, and many other application domains. In this paper, we focus on detecting anomalies in
power consumption data. The identification of unusual behaviours is important in order to foresee
uncommon events and to improve energy efficiency. To this end, we propose a model to precisely identify
anomalous days and another one to localize the detected anomalies. Normal days are identified using a
simple Auto-Encoder reconstruction technique, whereas the localization of the anomaly throughout the day
is performed using a combination of LSTM and K-means algorithms. This hybrid model that combines
prediction and clustering techniques, permits to detect unusual behaviour based on the assumption that
identical daily consumption can appear repeatedly due to users’ living habits. The model is evaluated using
real-world power consumption data collected from Pecanstreet in the United States.
1 INTRODUCTION
Global demand for energy is rising, and the lack of
energy resources such as oil, has hindered the
progress of global economies (F. Jovane et al.,2008).
Improving the efficiency of power consumption is of
great importance, since the increase of energy
consumption may become environmentally
hazardous enhancing global warming (S. Bilgen,
2014) (F. Jovane et al., 2008). One promising
approach to improve energy efficiency is to identify
anomalies in building energy consumption. This
information can be useful to the building managers
in order to reduce wasting energies by applying
energy saving procedures.
The large amount of data generated makes the
problem of detecting anomalies and localizing it
very challenging. Although many studies have been
conducted to propose low energy buildings,
buildings often exceed the energy saving objectives
indicated by the buildings’ energy design. Thus,
building administrators want to know how to
minimize the failure rate and how to discover power
consumption measurements highly differing from
old observed data.
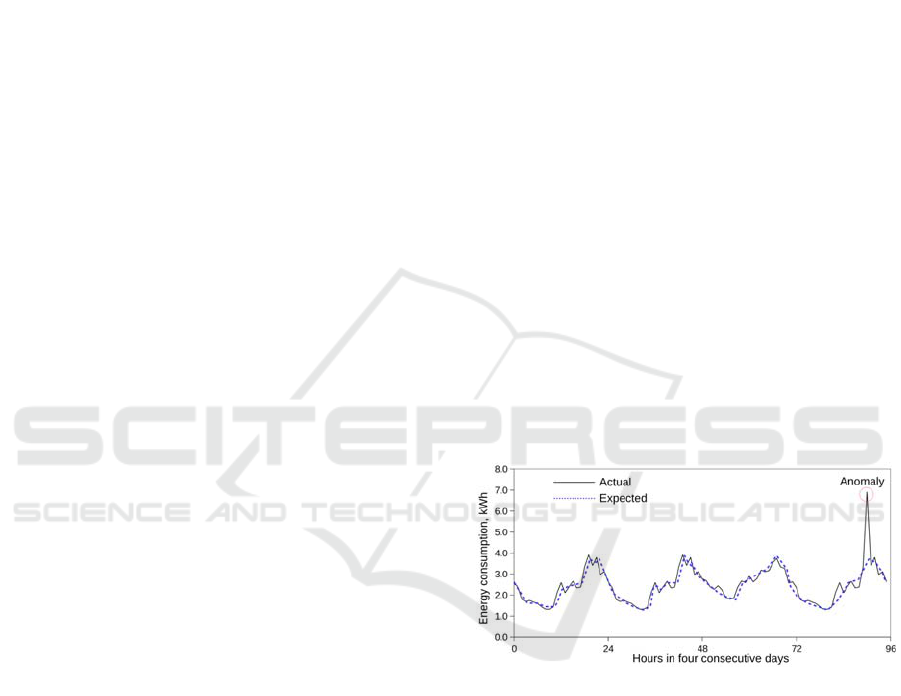
Figure 1: An example of an anomaly in a typical
household energy consumption.
In recent years, the weather conditions affected
the electric power demand, especially in heating and
cooling systems. Nowadays, it is widely accepted
that anomaly detection is of paramount importance
to reduce energy waste. Anomaly detection can be
used for example to determine if there is a faulty
equipment consuming more power than required.
Moreover, it can be used to detect power theft and
intrusions. Fig. 1 shows an example of an anomaly
in power consumption data, where a considerable
difference between the actual consumption and the
expected consumption can be detected (X. Liu et al.,
2016).
Chahla, C., Snoussi, H., Merghem, L. and Esseghir, M.
A Novel Approach for Anomaly Detection in Power Consumption Data.
DOI: 10.5220/0007361704830490
In Proceedings of the 8th International Conference on Pattern Recognition Applications and Methods (ICPRAM 2019), pages 483-490
ISBN: 978-989-758-351-3
Copyright
c
2019 by SCITEPRESS – Science and Technology Publications, Lda. All rights reserved
483

In this paper, we build an anomaly detection
mechanism to improve energy efficiency and to
detect abnormal behaviours. In particular, we
propose to use machine learning techniques to detect
anomalous days in order to avoid taking them into
account when building models representing the
normal behaviour of the users. K-means algorithm
are used to learn different scenarios representing the
energy consumption behaviour of each user, and
LSTM (Long Short Term Memory) is used to
predict the power consumption of the next hour.
Identifying outliers not only has the benefit to detect
abnormal events like power theft or a faulty
equipment, it can also be used as indicator for
residents to help them to change their living habits
and to warn them of device failures.
The rest of the paper is organized as follows:
Section 2 introduces the related work. Our proposed
framework as well as the experimental results are
presented in section 3. Section 4 concludes the paper
and provides the direction for the future works.
2 RELATED WORK
Anomaly detection also known as outlier detection is
the process of discovering patterns in data that do
not conform to expected behaviour (V. Chandola et
al., 2007). There is a tremendous research being
performed in anomaly detection in a wide variety of
application domains. Table 1 gives a summary of
anomaly detection categories (L. Li, 2013).
Table 1: Anomaly detection categories.
Problem Categories
Input
Binary, Univariate,
Multivariate, time series,
continuous…
Supervision
Supervised, Unsupervised,
semi-supervise
d
Anomalies
Pattern anomalies, context
anomalies, point anomalies,
correlation anomalies
In this paper, the data provided is not annotated
and cannot be annotated manually. Therefore the
approach we develop here is unsupervised. The
input of the algorithm is univariate and time series
and the outliers are context anomalies and point
anomalies. Context anomalies are data that are
considered abnormal in one context but normal in
another. For example, a lighting source in a school
might be anomalous on weekends but not on
weekdays when there are classes. Point anomalies
occur when an instance is considered abnormal
compared to the rest of the data.
Several previous studies utilized historical
building power data to detect anomalies. Methods
used for these unsupervised anomaly detection
problems include: nearest neighbour, clustering and
information theory. The nearest neighbour
approaches try to analyse the neighbourhood of each
sample to determine if it’s normal or not. The
distance is calculated between samples, and
anomalies are detected based on the assumption that
samples with anomalies are distant form normal
samples (V. Chandola et al., 2009). These
approaches have the advantage of being applicable
without making assumptions on the data
distributions. The main disadvantage of these
techniques remains in the fact that the assumption
that samples with anomalies have no close
neighbours is not always true.
Clustering approaches can also be applied for
outlier detection. In (V. Chandola et al., 2009), a
detailed review of these approaches has been
presented. This approach is based on the idea that
anomalies will not fit into any cluster or they will
make sparse clusters. Moreover, even if they fit in a
particular cluster, they will be distant from its
centroid. The main disadvantage of these approaches
is the computational complexity. Finally, the
approaches based on information theory calculate
entropy or Kolomogorov complexity. The
performance of these approaches are determined by
the choice of the theoretic measures.
2.1 Auto-Encoder
Figure 2: Auto-Encoder.
The Auto-Encoder is an artificial neural network that
tries to reproduce input vectors {x1, x2,…, xm} as
ICPRAM 2019 - 8th International Conference on Pattern Recognition Applications and Methods
484

output vectors {x
̂
1, x
̂
2,…, x
̂
m} (Sakurada et al.,
2014). An example of an Auto-Encoder is presented
in Fig.2. L1 and L5 are the input and the output
layers respectively whereas the others are hidden
layers. Supposing the vectors representing each
samples are made of D variables, the loss function
used for reconstructions is presented Eq. (1):
̂
(1)
Eq. (2) represents the activation of unit k in layer l,
the sum is calculated in the (l-1) layer over all
neurons j:
f
(2)
Where b and W are the bias and weight parameters,
respectively.
2.2 K-means Algorithm
K-mean is another well-known unsupervised
algorithm used for anomaly detection. Clustering
vectors is grouping these vectors according to some
characteristics. Given {x1, x2,…, xn}, this algorithm
searches to attribute each sample to one of the k
clusters that minimizes the distance between the data
point and the cluster:
,
⋲
||
||
⋲
(3)
The algorithm summarizing k-means is presented in
Algorithm 1.
2.3 LSTM
Long Short Term Memory (LSTM) (Hochreiter et
al., 1997) is one of the most popular Recurrent
Neural Networks (RNN). It has presented an
effective and scalable model for several learning
problems related to sequential data by modelling
long range dependencies. For the t-th element in a
sequence, the LSTM takes as input the element x
t,
the previous output h
t-1
and cell state c
t-1
and
computes the next output h
t
and cell state c
t
. Both h
and c are initialized with zeros.
3 PROPOSED METHOD AND
EXPERIMENTAL RESULTS
This research proposes a combination of recurrent
neural networks and clustering methods in order to
detect and predict anomalies in power consumption
data. We begin by building a LSTM with three
hidden layers and we trained it to predict the power
consumption of the next hour using the data of the
last 24 hours using Adam optimizer. We trained it
for up to 40 epochs with a batch size equal to 64.
The learning rate was set to 0.0001 and a dropout of
0.2 was applied at the output of each of the three
hidden layers.
The predicted value using LSTM is going to be
used to form a vector representing the power
consumption of the last 24 hours, then compared to
all the possible scenarios defining the typical normal
behaviour of this user at this specific hour. Thus, the
second step of our work is to learn these typical
behaviour scenarios using the k-means algorithm.
We start by applying some data rearrangement in
order to generate 24 groups representing the 24
hours of the day. Data rearrangement permits to
represent each input instance using sliding window
instead of single consumption value. To avoid
unpleasant impact of missing real world data, some
pre-processing techniques are used to adapt data to
the algorithms used. All values less than zero are
considered noisy as well as all the data points lying
further than 3 box lengths in the boxplot
representing the overall power consumption of the
user.
Each hour is represented by a vector taking the
last 24 hours of power consumption data. Then in
each group, we apply the k-means algorithm in order
to represent each hour by several possible
behaviours. The value k for the clustering was set to
11. In other words, for each hour the user can have
11 different behaviours that can be considered
normal. Using this technique, we can predict
anomalies one hour before its occurrence. The
predicted value generated by the LSTM take in
consideration the changes in behaviours based on the
assumption that recent data weights more than old
data. And the k-mean algorithm searches for the
closest centroids representing the power
consumption at that time. When the predicted value
is higher than the measured one by a threshold
margin, an anomaly is detected. The threshold used
for this user was set to 13.
A Novel Approach for Anomaly Detection in Power Consumption Data
485
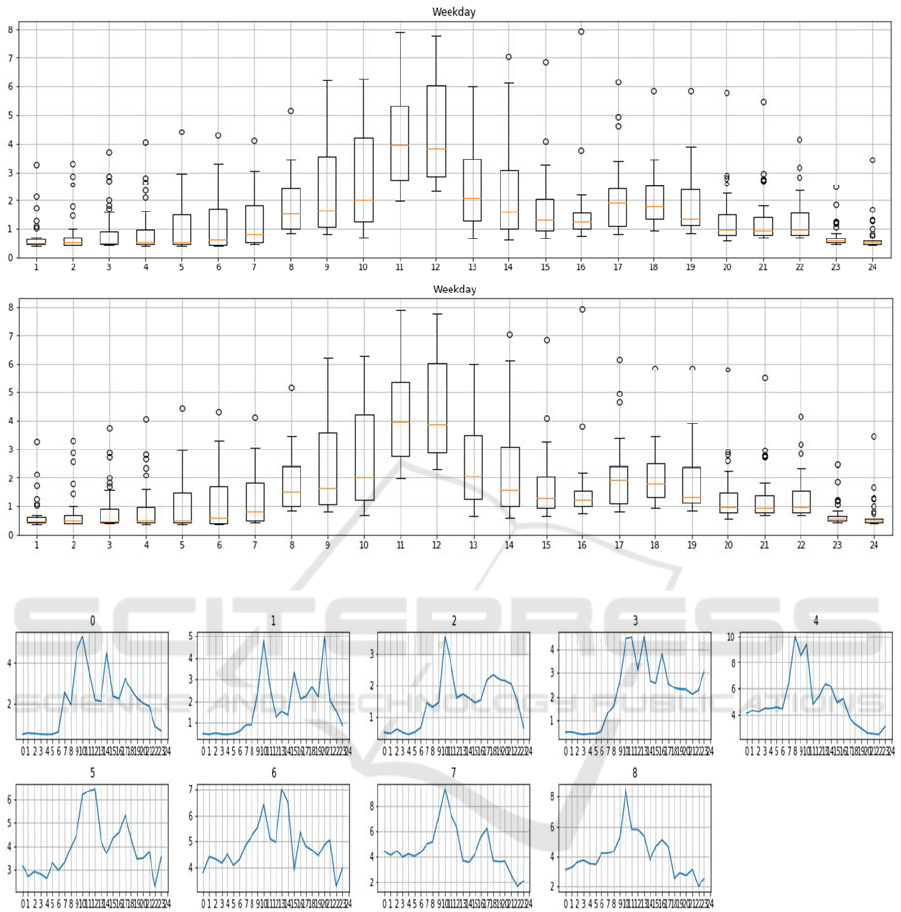
Figure 3: General characteristics of power consumption data (Weekdays and Weekends) using Boxplot.
Figure 4: Power consumption data for Day0 to Day8.
3.1 Database
The real-world data used in this work are collected
from Pecanstreet’s dataport (https://
dataport.pecanstreet.org). This database works on
smart meters owned by Pecan Street to provide real
data for researchers around the world. The total
database contains data from 67 devices in 820
households. The devices include lights plugs,
refrigerators, microwaves, air conditioners, ovens
heaters… A data sample is shown in Table 2 where
the ID represents the ID of the user, hour represents
the time of the reading, grid represents the energy
used in the grid, bedroom represents the energy used
by bedroom, and refrigerator represents the energy
used by the refrigerator. In this paper we used the
total usage of the user with 1 hour resolution. We
randomly chose one user (ID 59) during the period
January 2017 to December 2017. Fig. 3 presents an
illustration of the power consumption of this user
using Boxplots. The upper part represents Weekdays
consumption and the lower part represents the
Weekends. As can be seen, this user tends to use
more energy in weekdays. The peak hours are
ICPRAM 2019 - 8th International Conference on Pattern Recognition Applications and Methods
486
mainly at 11 o’clock and 12 o’clock. In the
following, we only use the data representing
weekdays.
Table 2: Data sample.
ID hour Bedroom Grid Refrigerator
499 2015-05-
01 07:00
0 0.67 0.2
499 2015-05-
01 08:00
0 0.39 0.12
499 2015-05-
01 09:00
0 0.04 0.17
3.2 Results and Discussions
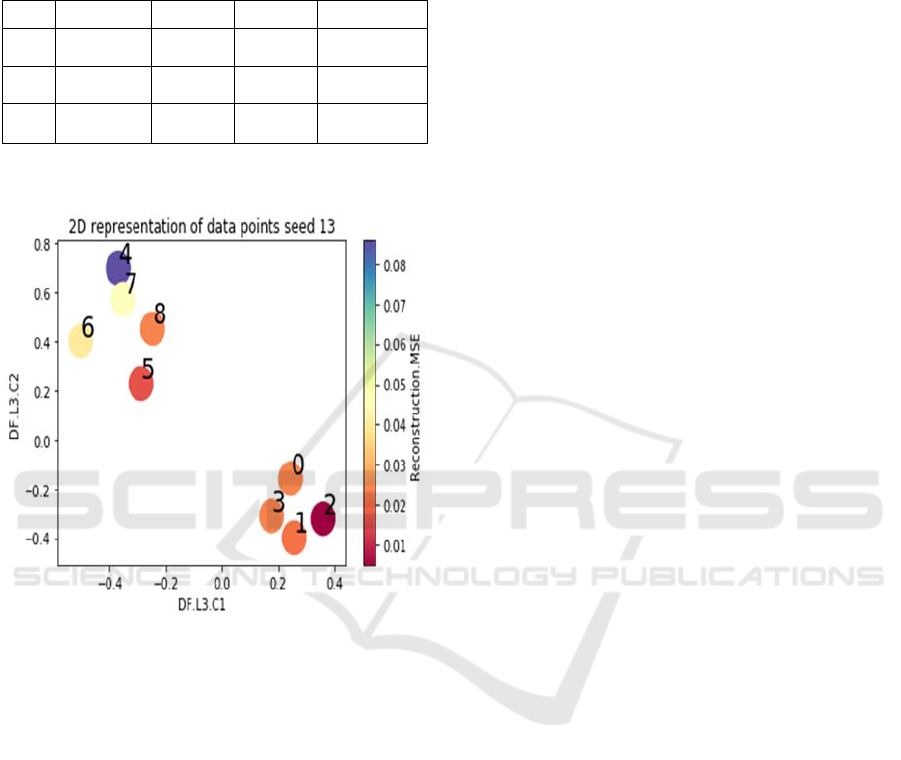
Figure 5: Visualization of different test days using Auto-
encoders reconstruction. Different colors represent the
reconstruction MSE.
We applied two different approach for two different
scenarios. The first one is trying to detect anomalous
days without localizing the anomaly. This can be
useful to building managers to better understand
consumers’ behaviors and for making energy
efficient home improvements. Fig. 4 represents the
actual power consumption values of the test days.
Fig. 5 shows a visualization of the Auto-Encoder
reconstruction with 5 hidden layers as following [24,
50, 20, 2, 20, 50, 24]. Different colors represent the
reconstruction MSE (Mean Square Error). The
reconstruction error is then compared with a
threshold in order to determine if the day in normal
or not. For a threshold of 0.04, only days 4, 6 and 7
are considered as anomalous as can be seen in Fig.
5.
In the second scenario, we tried to localize the
anomaly using the method we proposed in section 3.
Fig. 6, Fig.7 and Fig. 8 illustrate the results of our
proposed method on the same test days. As can be
seen, our method localized two anomalies for day 4
(at 8 a.m. and 10 a.m.) and one anomaly for day 7
(at 10 a.m.). This can explain why days 4 and 7 have
been considered anomalous by the auto encoders and
can also explain day 4 has a higher reconstruction
error than day 7 since day 4 has 2 anomalies
whereas day 7 has only one anomaly. Contrary to
the Auto-Encoder that considered the day number 6
as anomalous, our method conserves a consistent
overall prediction as can be seen in Fig.7.
4 CONCLUSION
Finding anomalies in time series data is a very
promising topic permitting to reduce the waste of
energy and to better monitor building energy
consumption. In this paper, we present a hybrid
model combining LSTM and K-means algorithm in
order to detect outliers in time series data. Auto-
Encoders detects abnormal days, whereas the
proposed algorithm identifies the typical scenario
permitting to localize the detected anomalies.
Despite of these encouraging results, this work
needs the assistance of real expert users and analysts
in order to better define the anomaly in this domain.
Experts can also provide some annotations for the
learning data in order to give us the possibility of
applying semi-supervised approaches in this domain.
ACKNOWLEDGEMENTS
This work has been supported by SOLOTEC project
which is financed by the European Union and
Champagne Ardenne region.
REFERENCES
S. Bilgen, Structure and environmental impact of global
energy consumption, Renewable and Sustainable
Energy Reviews, Volume 38,2014,Pages 890-
902,ISSN 1364-0321,
https://doi.org/10.1016/j.rser.2014.07.004.(http://www
.sciencedirect.com/science/article/pii/S136403211400
4560).
Jovane, F., Yoshikawa, H., Alting, L., Boer, C. R.,
Westkamper, E., Williams, D., ... & Paci, A. M.
(2008). The incoming global technological and
industrial revolution towards competitive sustainable
manufacturing. Cirp Annals, 57(2), 641-659.
A Novel Approach for Anomaly Detection in Power Consumption Data
487
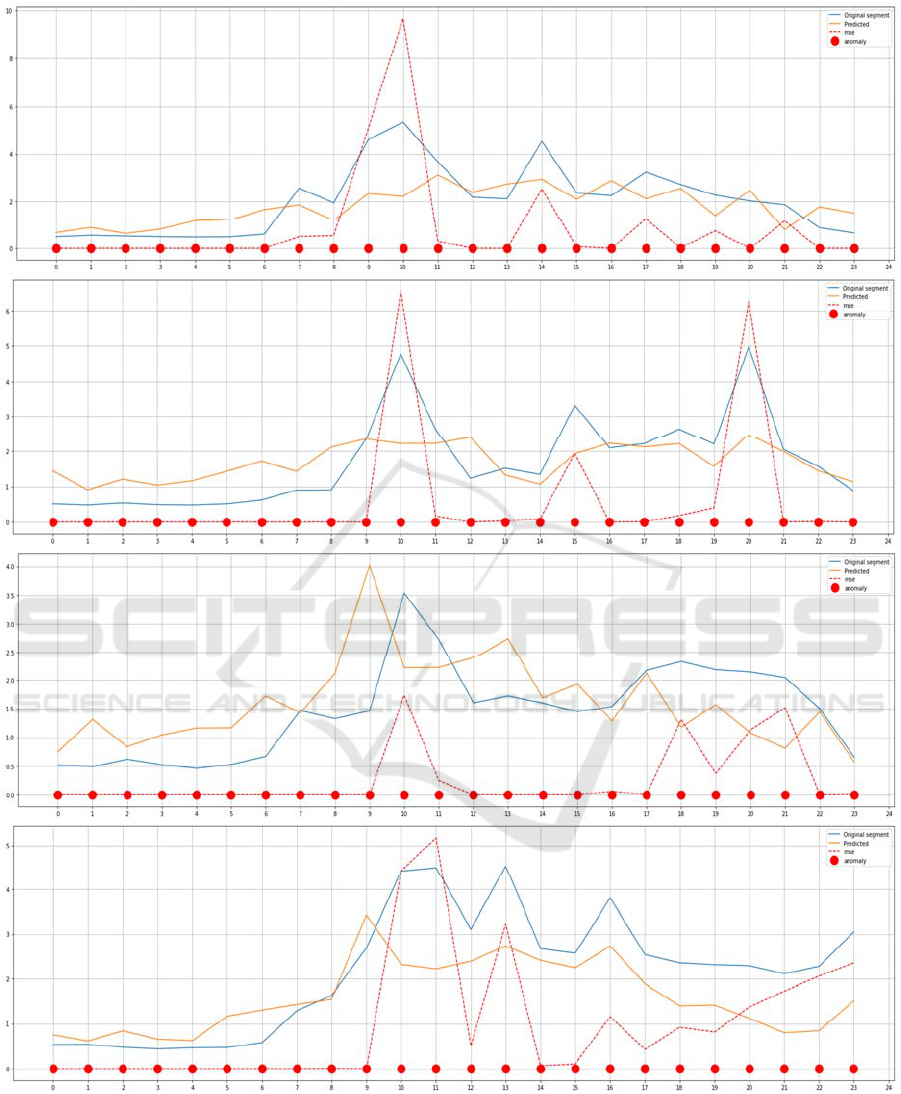
Figure 6: Power Consumption values for five test days (Day0 to Day3). The actual power consumption, the predicted one
and the anomalies are presented.
ICPRAM 2019 - 8th International Conference on Pattern Recognition Applications and Methods
488
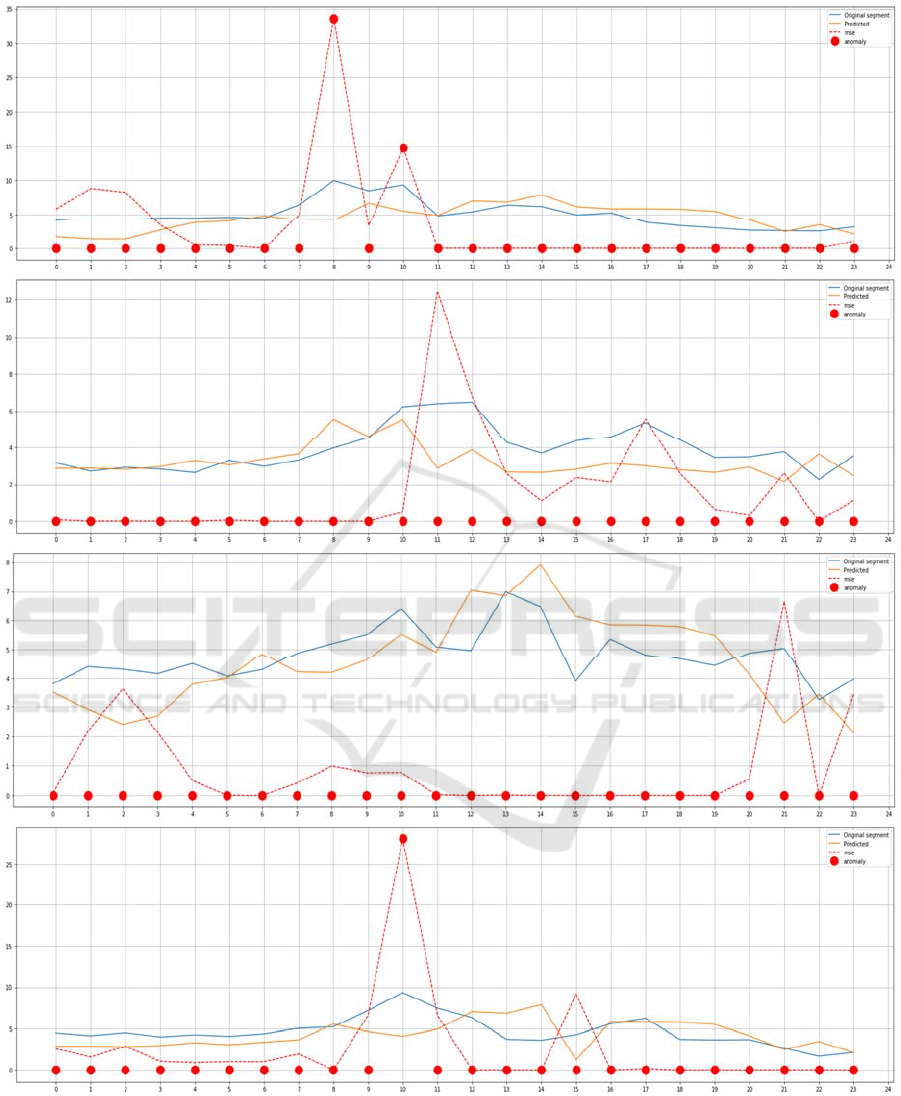
Figure 7: Power Consumption values for four test days (Day4 to Day7). The actual power consumption, the predicted one
and the anomalies are presented.
A Novel Approach for Anomaly Detection in Power Consumption Data
489
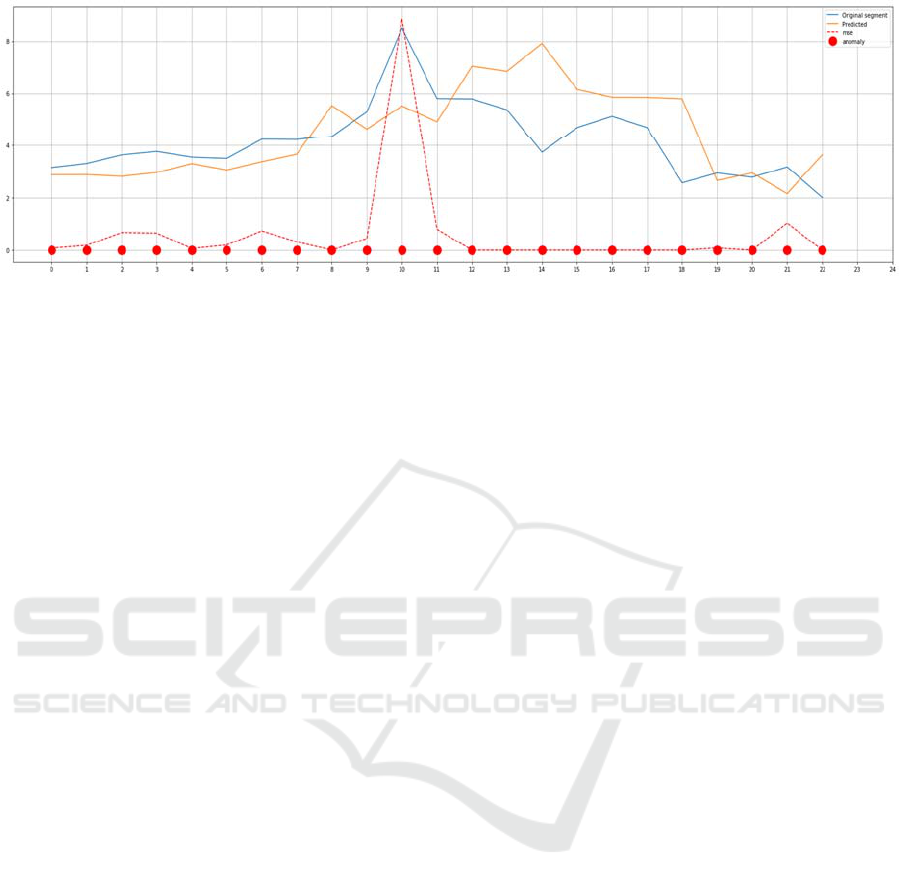
Figure 8: Power Consumption values for four test days (Day8). The actual power consumption, the predicted one and the
anomalies are presented.
Liu, X., Iftikhar, N., Nielsen, P. S., & Heller, A. (2016,
September). Online anomaly energy consumption
detection using lambda architecture. In International
Conference on Big Data Analytics and Knowledge
Discovery (pp. 193-209). Springer, Cham.
Chandola, V., Banerjee, A., & Kumar, V. (2007). Outlier
detection: A survey. ACM Computing Surveys.
Li, L. (2013). Anomaly detection in airline routine
operations using flight data recorder data (Doctoral
dissertation, Massachusetts Institute of Technology).
Pecan Street’s Dataport. [Online]. Available:
https://dataport.pecanstreet.org/
Chandola, Varun, Arindam Banerjee, and Vipin Kumar.
(2009) "Anomaly detection: A survey." ACM
computing surveys (CSUR) 41.3 (2009): 15
Sakurada, Mayu, and Takehisa Yairi.(2014) "Anomaly
detection using autoencoders with nonlinear
dimensionality reduction." Proceedings of the
MLSDA 2014 2nd Workshop on Machine Learning
for Sensory Data Analysis. ACM.
Hochreiter, Sepp, and Jürgen Schmidhuber. (1997) "Long
short-term memory." Neural computation 9.8: 1735-
1780.
ICPRAM 2019 - 8th International Conference on Pattern Recognition Applications and Methods
490
