
Modeling and Evaluation of a City Logistics System with
Freight Buses
Zheng Chang, Haoxun Chen and Farouk Yalaoui
ICD-LOSI, UMR CNRS 6281, University of Technology of Troyes, Troyes, France
Keywords: City Logistics, Freight Bus, Joint Distribution, Vehicle Routing Problem.
Abstract: Freight bus is a new public transportation means for city logistics, and each freight bus can deliver and pick
up goods at each customer/supplier location it passes. In this paper, we study the route planning problem of
freight buses in an urban distribution system. Since each freight bus makes a tour visiting a set of
pickup/delivery locations once at every given time interval in each day following a fixed route, the route
planning problem can be considered a new variant of periodic vehicle routing problem with pickup and
delivery. In order to solve the problem, a Mixed-Integer Linear Programming (MILP) model is formulated.
Based on the model, we compare a distribution system with freight buses with that without freight bus.
Preliminary numerical results on randomly generated instances show that the system with freight buses can
significantly reduce transportation costs compared with the system without freight buses.
1 INTRODUCTION
The rapid development of e-commerce has been
making urban logistics flows more and more
intensive. Driven by market demand, more and more
city freighters operated by different private third-
party logistics companies were born and circulate in
the centers of cities. This has caused serious traffic
congestion and environmental pollution problems in
large cities. To reduce traffic congestions and
improve the efficiency and time accuracy of
delivery, collaboration among third-party logistics
companies (carriers) in urban logistics is needed.
In 1973, Japanese scholar Shize (1973) first put
forward the joint distribution which has been proved
to be an effective way for city logistics. Joint
distribution promotes enterprises with similar
functions to use common facilities and equipment
such as warehouses, logistics platforms, and
vehicles, through which small orders of goods for
delivery can be consolidated into a large-volume
order to achieve the economics of scale in
transportation and other related logistics services.
Gill and Allerheiligen (1996) pointed out that
members of a distribution channel should cooperate
with each other through joint distribution, and
illustrated the effectiveness of joint distribution, and
proposed several principles for implementing it. Hao
and Su (2014) discussed the basic concepts and
operation models of joint distribution in city
logistics. Xu and Yang (2017) proposed a model for
cost sharing among small companies implementing
joint distribution.
Motivated by joint distribution, in our previous
work (Chang and Chen. 2017), we put forward the
concept of freight bus, which is a new public
transportation means for city logistics that can
replace city freighters belonging to different private
third-party logistics companies in the center of a
city. Freight bus has some advantages compared
with city freighter. Firstly, freight bus can realize
joint distribution of different third-party logistics
companies, and can thus save city logistics costs and
reduce the air pollution; Secondly, because of
having a regular schedule, freight bus can improve
the timeliness and accuracy of logistics services;
Thirdly, replacing private city freighters by freight
buses can facilitate the traffic control in a city and
reduce the traffic congestion. Finally, freight bus can
improve the utilization rate of special lanes reserved
for buses. In that article, we did not consider both
pickup and delivery of goods at each
customer/supplier location when a freight bus passes
it. However, in practice, as a new public
transportation means for city logistics, freight buses
should perform both pickup and delivery of goods at
every customer/supplier location they visit.
292
Chang, Z., Chen, H. and Yalaoui, F.
Modeling and Evaluation of a City Logistics System with Freight Buses.
DOI: 10.5220/0007362502920298
In Proceedings of the 8th International Conference on Operations Research and Enterprise Systems (ICORES 2019), pages 292-298
ISBN: 978-989-758-352-0
Copyright
c
2019 by SCITEPRESS – Science and Technology Publications, Lda. All rights reserved
The periodic vehicle routing problem (PVRP)
was first introduced by Beltrami and Bodin (1974)
in vehicle routing for municipal waste collection.
This is the first time that the periodicity of customer
deliveries was specifically addressed in combination
with the consideration of vehicle routing costs.
Russell and Igo (1979) named the periodic routing
problem as the assignment routing problem.
Christofides and Beasley (1984), which is well cited
by periodic routing papers, named the problem as a
period routing problem and provided the first
mathematical formulation of the problem. The first
article that uses the term “periodic vehicle routing”
appears to be Gaudioso and Paletta (1992). In the
paper entitled “Forty Years of Periodic Vehicle
Routing”, Ann and Jill (2014) discussed a wide
range of circumstances and settings in which the
PVRP has been applied and reviewed models and
solution methods developed for the PVRP, including
both exact and heuristic methods.
In this paper, we study the route planning
problem of freight buses with both pickup and
delivery in an urban distribution system. In this
system, each freight bus makes a tour visiting a set
of pickup/delivery locations once at every given
time interval in each day following a fixed route in a
city, and the route planning problem can be
considered a new variant of periodic vehicle routing
problem with pickup and delivery. To the best of our
knowledge, this problem was rarely studied in the
literature. In order to solve the problem, a Mixed-
Integer Linear Programming (MILP) mathematical
model is formulated. Based on the model, we
compare a distribution system with freight buses and
that without freight bus. Preliminary numerical
results on randomly generated instances show that
the system with freight buses can significantly
reduce transportation costs compared with the
system without freight buses.
2 FREIGHT BUS IN CITY
LOGISTICS
With the increase of freight distribution in urban
transportation, more and more private city freighters
were born in the city. Motivated by joint
distribution, in this paper, consider an urban
distribution system with freight buses, which is a
new public transport means that can replace city
freighters belonging to different private logistics
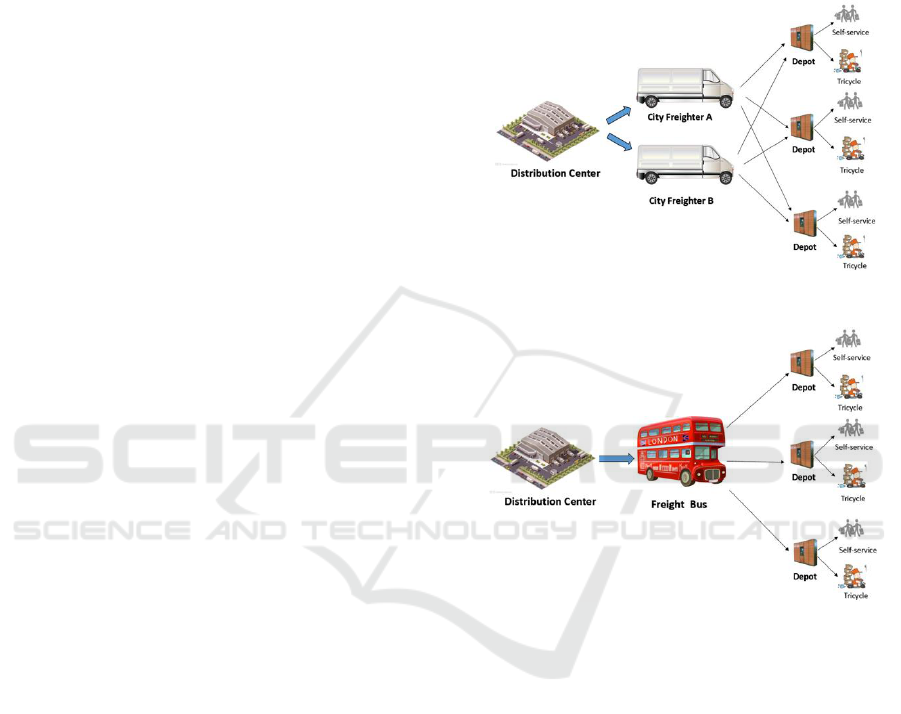
companies in the center of a city. The following two
figures compare city freighters and freight buses in
an urban distribution system. We can see in Fig. 1,
there are city freighters from two companies A and
B, which separately deliver their customers'
demands from a distribution center to multiple
depots. However, in Fig. 2, freight buses are used to
deliver all the demands from the distribution center
to the depots.
Figure 1: City freighters in urban distribution system.
.
Figure 2: Freight buses in urban distribution system.
As a public service for third-party logistics
companies and customers, the use of freight buses
can achieve joint distribution. One important feature
of freight buses is that they are standardized vehicles
and have fixed time schedules. With the fixed
schedules, both shippers and customers can well
arrange their order delivery and delivery times. As
we can see from Fig. 2, each depot in such
distribution system is a freight bus station, which has
a smart cabinet (depot) for temporary storage of
goods. According to the schedules, customers can
pick up their ordered products by self-service at the
freight bus stations (depots), or ask the last-mile
delivery men to deliver the goods from a freight bus
station to their homes (Dayarian, Crainic, Gendreau,
& Rei. 2015). The following figure 3 illustrates
freight bus lines, where each freight bus station is
visited and served by a freight bus line periodically.
Modeling and Evaluation of a City Logistics System with Freight Buses
293
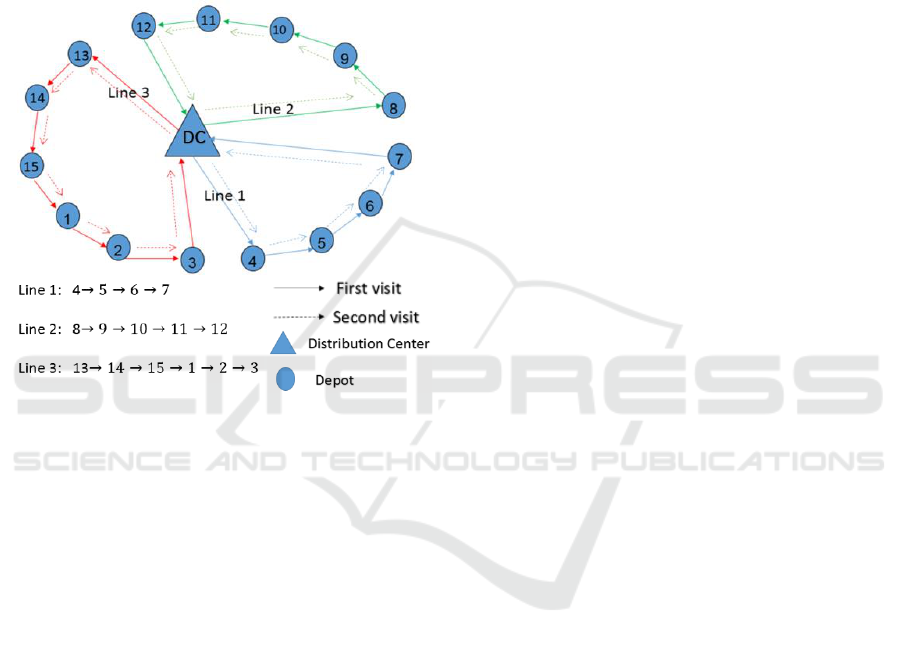
In each run (period), each freight bus starts from a
distribution center, delivers and pick up goods at
multiple depots, and finally returns back to the
distribution center, according to a predefined route
and time schedule. Moreover, as a public
transportation means, freight buses can also enjoy
the policy of bus priority and use special lanes
reserved for buses, which can improve the timeliness
and accuracy of logistics services (Trentini, Campi,
Malhene & Boscacci, 2011).
Figure 3: An example of freight bus lines.
Freight bus has some advantages compared with
city freighter. Firstly, freight bus can realize joint
distribution of different third-party logistics
companies, and can thus save city logistics costs and
reduce the air pollution; Secondly, because of
having a regular schedule, freight bus can improve
the timeliness and accuracy of logistics services;
Thirdly, replacing private city freighters by freight
buses can facilitate the traffic control in a city and
reduce the traffic congestion. Finally, freight bus can
improve the utilization rate of special lanes reserved
for buses. Just like the birth of passenger buses, we
believe that in cities with high freight demands,
freight buses are very likely to be born in the near
future.
3 MATHEMATIC MODEL FOR
FREIGHT BUS ROUTING
In this section, we establish a mathematical model
for the vehicle routing problem of freight bus.
Each freight bus is operated (run) between a distribu-
tion center and multiple depots. Compared with the
capacitated vehicle routing problem, the vehicle
routing problem of freight bus has the following new
characteristics: 1、Each freight bus makes a tour
visiting a set of pickup/delivery locations once at
every given time interval (period) in each day. 2、
Each freight bus has a fixed vehicle route in these
periods. 3 、 Both delivery and pick up can be
operated at each depot (customer/supplier location).
4、delivery and pickup of goods can be delayed but
with penalties.
Therefore, the freight bus routing problem
considered in this paper is a multi-period vehicle
routing problem with pickup and delivery, fixed
routes, and late pickup/delivery penalties. To the
best of our knowledge, this problem was rarely
studied in the literature. In order to solve the
problem, in this section we first formulate a Mixed-
Integer Linear Programming (MILP) model for the
route planning problem of freight buses.
3.1 Problem Description
In the model, each freight bus runs between a
Distribution Center and a set of depots. For
simplicity, we don’t consider the interactions of the
freight buses with the electro-tricycles which
perform last-mile deliveries from depots to
customers. Key features of the model are first
introduced in the following.
(1)Multiple periods: We consider a time horizon
(e.g. one day) that is divided into M periods (M > 1)
and assume that each freight bus visits its served
depots once in each period, and the demand of
delivery and pickup of goods to each depot in each
period is known.
(2)Fixed routes: As passenger buses,we assume
that each freight bus has a fixed route in the time
horizon, and every depot must be served by one
freight bus in each period.
(3)Both delivery and pick up: Each freight bus
can perform pickup and deliver goods at each depot
(customer/supplier location). The freight bus arrives
at each customer/supplier location (station), unload
goods first and load goods later. During the whole
tour, the total amount of goods in the freight bus
should not exceed its capacity. So it is possible that
the delivery or the pickup demand of a depot in a
period is only partially met in this period because of
the capacity limitation of a freight bus, in this case,
the unmet demand of the period can be only met in
later periods. In other words, the goods loaded or
unloaded by the freight bus must be the pickup or
delivery demand of this period or the previous
ICORES 2019 - 8th International Conference on Operations Research and Enterprise Systems
294

periods that were not met due to the limitation of
vehicle capacity.
(4)Penalty of delivery/pickup delay. Delivery
and pickup of goods at a customer/supplier location
can be delayed but with penalties. There are two
types of penalty introduced in this model. One is the
penalty caused by the delay in the time horizon (e.g.
one day) of M periods, which linearly depending on
the quantity of the late delivery or pickup demands
and the number of periods delayed, with the penalty
per period and per unit of demand given by a
coefficient (In this paper, we assume late pickup
and delivery have the same penalty coefficient). The
other is the penalty for all unmet demands at the end
of the time horizon (e.g. one day) of M periods,
which linearly depending on the quantity of the late
delivery or pickup demands, with the penalty per
unit of demand given by another coefficient .
What’s more, Because of these two types of
penalty, we can assume that the operation of the
freight bus has two characteristics: 1,When the
freight bus arrives at a depot, it unloads/delivers first
and then loads/pickup the goods. (In order to free up
more capacity for pickup). 2, For delivery, the
freight bus will give priority to meeting the needs of
the previous visiting depots according to the order of
visiting; for pickup, the freight bus will try its best to
meet the loading needs of the depots according to its
maximum remaining capacity (Because late pickup
and delivery have the same penalty coefficient).
The main parameters of the model are defined as
follows:
o The distribution center where each freight
bus leaves from and returns to.
Set of freight buses.
G Set of depots.
The capacity of each freight bus.
The operating cost for a freight bus when
it travels from node i to node j (i, j ).
M The number of time periods we consider
in the route planning problem.
(k) The demand of delivery of depot i in the
k-th period, G,
.
(k) The demand of pickup of depot i in the k-
th period, G,
.
The per period and per unit late
delivery/pickup penalty cost for goods
delivered/picked up in the time horizon of M
periods.
The per unit late delivery/pickup penalty
cost for goods delivered/picked up beyound the
time horizon.
We assume that the Distribution Center o serves
all depots G in the distribution system considered.
The distance between node i and node j is denoted
by
. The operating cost of a freight bus from node
i to node j is calculated as
, where
is
the unit distance operating cost of each freight bus.
There are N (N is an integer) freight buses operated
for the Distribution Center o, and the capacity of
each freight bus is U.
In each period, each freight bus leaves from the
Distribution Center o, visits its served depots and
returns to the Distribution Center. What’s more, for
one freight bus, every period, all goods loaded at the
DC must be unloaded at its served depots before it
returns to the Distribution Center; and all goods
loaded at its served depots must be unloaded at the
Distribution Center when it returns to the DC . It is
assumed that the demand
and
(k) of each
depot i in each period
is known.
We need to plan the vehicle route for each
freight bus v, and the delivery and pickup quantity of
each freight bus at each depot in each period. The
objective is to minimize the operating costs of all
freight buses plus the late delivery and pickup
penalty costs.
We need to plan the vehicle route for each
freight bus v, and the delivery quantity of every
freight bus at each depot in each period. Our
objective is to minimize the operating costs of all the
freight buses in the M periods.
3.2 Mathematic Model
In this subsection, we propose a mathematic model
for freight buses. With this mathematic model, we
can calculate the whole operating costs of the system
with freight bus in the planning horizon. At the same
time, we can also get the optimal routes of freight
buses. In this subsection, we propose a mathematic
model for the route planning of freight buses by
considering its all characteristics. With this
mathematic model, we can optimize the total cost of
freight buses composed of their operating costs and
penalty costs for the late delivery and pickup of
goods in the planning horizon. At the same time, we
can also get the optimal routes of freight buses by
solving the model.
The detailed mathematical model for the route
planning of freight buses is given as follows:
Decision Variables
A binary variable which is equal to 1 if
the freight bus v goes from node i to j (i,
j ); 0 otherwise.
A binary variable which is equal to 1 if
and only if the depot i is served by the freighter
Modeling and Evaluation of a City Logistics System with Freight Buses
295

bus v; 0 otherwise.
(k) The unloaded quantity of the freighter
bus v at the depot i in the k-th visit k
; 0 otherwise.
(k) The loaded quantity of the freighter bus
v at the depot i in the k-th visit k
; 0 otherwise.
(k) The quantity of all goods remaining to
deliver in the freighter bus v when it just
arrives at node i during the k-th visit,
k
.
(k) The quantity of all goods picked up by
the freighter bus v when it just arrives at
node i during the k-th visit, k
.
Objective Function
The objective is to minimize the sum of all costs
including the operating costs of the freight buses and
the penalty costs for the late delivery and pickup of
goods in the planning time horizon of M periods.
Minimize Z =
+
*
+
*
+
*
+
*
(0)
Constraints
=
(1)
=
(2)
(3)
= 1
(4)
<=
-
+(1-
)
,k
(5)
k
>=
+
-(1-
)
(6)
, k
=
(7)
k
0<=
+
<=U
(8)
,
<=
*
(9)
, n
<=
*
(10)
, n
(11)
>=0 ;
>=0 ;
>=0 ;
>=0
,
,
(12)
Constraints (1) indicate that each freight bus leaves
from and returns to the DC. Constraints (2) ensure
that each freight bus arriving at a depot has to leave
it. Constraints (3) and (4) guarantee that all depots
must be served and each depot is served by at most
one freight bus. Constraints (5) (6) and (7) (8) (9)
formulate vehicle capacity constraints. Constraints
(10) (11) indicate that in each period, the delivery
and pickup of freight bus v at each depot i can only
be the demand of that period or earlier periods but
cannot be the demand of later periods. Finally,
constraints (12) define the domains of all decision
variables.
4 IMPACT OF THE JOINT
DISTRIBUTION REALIZED BY
FREIGHT BUSES
4.1 The Distribution System without
Freight Bus
In order to evaluate the impact of the joint
distribution realized by freight buses, we compare
our proposed distribution system with freight buses
with that without freight bus.
In the system without freight bus, it is assumed
that there are city freighters operated by two private
third party logistics companies and , which
separately deliver and pickup their customers'
demands from a distribution center to multiple
depots. Each city freighter of company or also
visits its served depots once during each period k∈
{1,2 … M}, and the demand of each company’s
customers at each depot i in each period must be
served by its own city freighters. In each period,
each city freighter also begins and ends its travel at
the distribution center. What’s more, and it is
possible that part of the demand of a depot in a
period is served in later periods because of the
limited capacity of a city freighter, and we also
consider two types of penalty costs for late
deliveries and pickups.
To simplify the comparison of the two distribution
systems, we assume that all city freighters operated
by company and company have the same
capacity U, the same unit distance operating cost
,
the same penalty coefficient and , and the same
number of periods M in the planning time horizon as
those of the freight buses, and all the city freighters
also have fixed vehicle routes. The objective of each
city freighter company is to minimize its total cost
which includes the operating costs and the penalty
costs of its own city freighters. With this
assumption, we can use the MILP proposed in this
paper to optimize the vehicle routes of the city
freighters of each company and get its total cost. The
ICORES 2019 - 8th International Conference on Operations Research and Enterprise Systems
296
total cost of the distribution system without freight
bus is thus the sum of the total costs of company
and .
4.2 Experimental Results
In order to verify the freight bus routing model
proposed in section III and evaluate the impact of
joint distribution realized by freight buses, we need
to generate instances which are representative for
both the distribution system with freight buses and
the distribution system without freight bus.
The freight bus routing problem considered in
this paper is related to the vehicle routing problem
with pickup and delivery. So when generating the
instances, we use some data from the benchmark
instances of vehicle routing problem with pickup
and delivery provided by Breedam at
http://neo.lcc.uma.es/vrp/. However, since our
freight bus routing problem involves multiple
periods, we have to generate demand data randomly
based on the benchmark data.
We designed 20 instances with N∈{7,13} and
M ∈ {3,5} (see Table 1). For all instances, the
following data are taken from the benchmark
instances: the coordinates of all nodes, the number
of vehicles, and the capacity of each vehicle. The
other data are generated randomly or based on the
benchmark instances: the delivery demand
(k) of
each depot in each period , the pickup demand
(k)
of each depot in each period, the number of periods
M, the unit distance operating cost
the penalty
coefficients and .
The number of periods M is set to 3 or 5. Since it
is assumed that all freight buses have the same unit
distance operating cost, we simply set
to 1 for all
instances. In order to further evaluate the impact of
the joint distribution realized by freight buses, for
the distribution system with freight buses, we
generate the demand of each depot in each period by
grouping the customer demands of two private third
party logistics companies A and B at the depot in the
period, where the demand (both the delivery and
pickup) of each company at each depot in each
period is randomly generated from [1, 20]. For the
penalty coefficient , because the ratio of to
and
to
affect the tradeoff between the operating
costs of the freight buses and the penalty costs for
late deliveries and pickups as well as the service
level to customers, i.e., the percentage of customer
orders delivered on-time, we cannot set and too
big or too small. After some tests with different
and values, in our numerical experiments we set
to 2, to 4 for all instances.
We then used CPLEX to solve the two models
for each instance with a preset time of 2 hours, and
compare the costs of the two distribution systems.
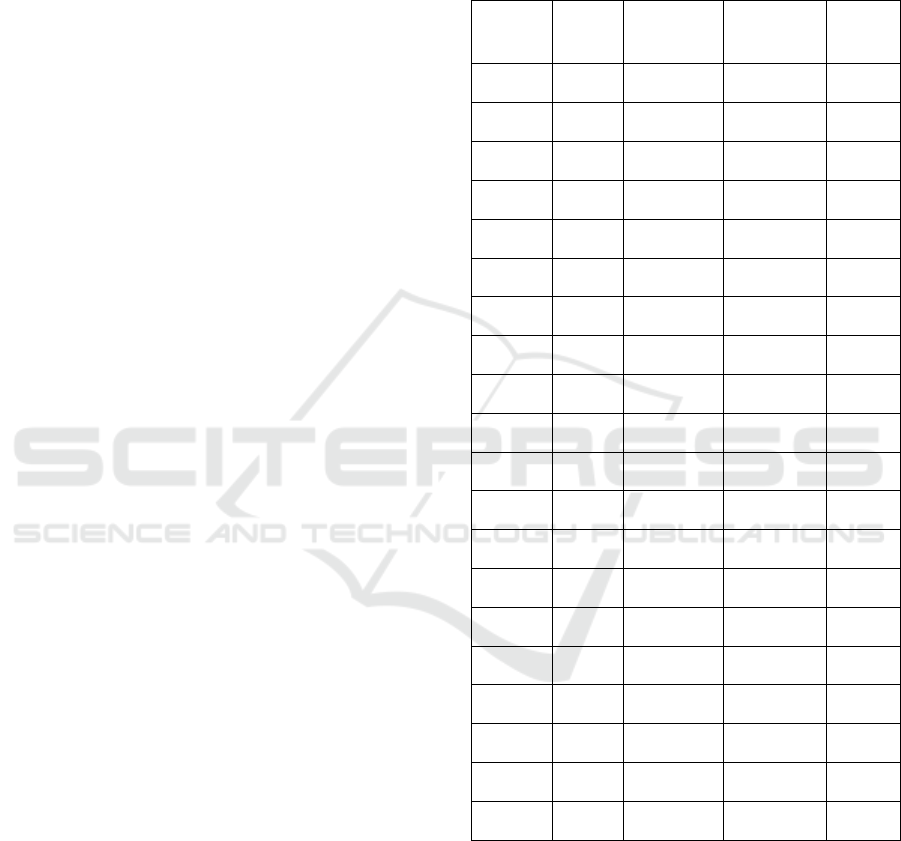
The follow table gives the experimental results.
Table 1: Experimental results of the two city logistic
systems.
Number
of depot
Visit
times
M
Cost with
Freight
bus
Cost
without
Freight bus
Cost
Saving
7
3
1067.1
1291.9
17.4%
7
3
986.6
1200.2
17.8 %
7
3
1076.9
1306.9
17.6 %
7
3
962.0
1168.9
17.7 %
7
3
1005.8
1219.2
17.5 %
7
5
1984.1
2428.5
18.3 %
7
5
1945.1
2389.6
18.6 %
7
5
1887.0
2312.5
18.4 %
7
5
1940.4
2372.1
18.2 %
7
5
1896.6
2312.9
18.0 %
13
3
1459.9
1818.1
19.7 %
13
3
1519.1
1889.4
19.6 %
13
3
1800.1
2233.4
19.4 %
13
3
1397.4
1740.2
19.7 %
13
3
2878.7
3602.9
20.1 %
13
5
3761.2
4731.1
20.5 %
13
5
3232.8
4046.1
20.1 %
13
5
3329.6
4177.7
20.3 %
13
5
3402.7
4258.7
20.1 %
13
5
3405.6
4251.7
19.9 %
From the experimental results, we can see that if
we use the proposed freight bus system, the cost
saving in percentage compared with the
corresponding system without freight bus is ranged
from 17.6% to 35.3% with the average cost saving
25.1%. Moreover, we can see that the larger the size
of the instances, the more the cost savings of the
freight bus system. The preliminary numerical
results show that the distribution system with freight
Modeling and Evaluation of a City Logistics System with Freight Buses
297

bus can significantly reduce transportation costs
compared with the system without freight bus.
5 CONCLUSIONS
In this paper, we put forward the concept of freight
bus, which is a new public transport means that can
replace city freighters belonging to different private
logistics companies operated in a city. Freight bus has
some advantages compared with city freighter.
Firstly, freight bus can realize joint distribution of
different third-party logistics companies, and can thus
save city logistics costs and reduce the air pollution;
Secondly, because of having a regular schedule,
freight bus can improve the timeliness and accuracy
of logistics services; Thirdly, replacing private city
freighters by freight buses can facilitate the traffic
control in a city and reduce the traffic congestion.
Finally, freight bus can improve the utilization rate of
special lanes reserved for buses.
We study the route planning problem of freight
buses with pickup and delivery in an urban
distribution system. At first, we have described the
operations of freight buses in city logistics. In this
system, each freight bus makes a tour visiting a set of
pickup/delivery locations once at every given time
interval in each day following a fixed route in a city,
and the route planning problem can be considered a
new variant of periodic vehicle routing problem with
pickup and delivery. To the best of our knowledge,
this problem was rarely studied in the literature. In
order to solve the problem, a Mixed-Integer Linear
Programming (MILP) model is formulated. Based on
the model, we compare a distribution system with
freight buses and the corresponding system without
freight bus. Preliminary numerical results on
randomly generated instances show that the system
with freight buses can significantly reduce
transportation costs compared with the system
without freight buses.
However, in the paper, we have not quantitatively
analyzed the timeliness of freight bus. In the future,
we need to propose an effective optimization
algorithm to solve the freight bus routing problem
proposed in this paper for large instances, and
consider more practical issues to operate freight buses
in a city.
ACKNOWLEDGEMENTS
This work is supported by the French National
Research Agency (ANR) under the project ANR-14-
CE22-0017 entitled “Collaborative Transportation in
Urban Distribution”.
REFERENCES
Amaral, R.R., and Aghezzaf, E.H, 2015. City Logistics
and Traffic Management: Modelling the Inner and
Outer Urban Transport Flows in a Two-Tiered
System. Transportation Research Procedia, 6, 297 –
312.
Ann, M. C. and Jill, H. W., 2014. Forty Years of Periodic
Vehicle Routing .Networks, 63 (1), 2-15.
Beltrami, E.J., and Bodin, L.D. ,1974. Networks and
vehicle routing for municipal waste collection.
Networks, 4 (1), 65-94.
Chang, Z., Chen, H.,2017. Freight Buses in Three-Tiered
Distribution Systems for City Logistics: Modeling and
Evaluation. 7
th
International Conference on Industrial
Engineering and Systems Management, Saarbrucken,
Germany.
Christofides, N., and Beasley, J.E. ,1984. The period
routing problem. Networks, 14 (2), 237-256.
Dayarian, I., Crainic, T.G., Gendreau, M., and Rei, W.
,2015. A branch-and-price approach for a multi-period
vehicle routing problem. Computers and Operations
Research,55, 167-184.
Gaudioso.M, and Paletta.G. ,1992. A heuristic for the
periodic vehicle routing problem. Transport Science,
26(2), 86-92.
Gill, L.E., and Allerheiligen, R.P. ,1996. Co-operation in
channels of distribution: physical distribution leads the
way. International Journal of Physical Distribution
and Logistics Management, 26(5), 49-63.
Hao, Y., and Su, Y. ,2014. The research on joint
distribution mode of the chain retail enterprises. 2014
International Conference on Mechatronics,
Electronic, Industrial and Control Engineering, MEIC
2014, 1694-1697.
Russell, R., and Igo, W. ,1979. An assignment routing
problem. Networks, 9(1), 1-17.
Shize, X. ,1973. Introductions of joint distribution.
Circulation and economic study, 8 (3), 87-94.
Trentini, A., Campi, A., Malhene, N., and Boscacci, F.
,2011. Shared passengers and goods urban transport
solutions: new ideas for milan through en international
comparison. Territorio, 59, 38-44.
Tsai, J.T., Liu, T.-K., and Chou, J.H. ,2004. Hybrid
Taguchi-Genetic Algorithm for Global Numerical
Optimization. IEEE Transactions on Evolutionary
Computation, 8 (4), 365-377.
Xu, L., and Yang, D. ,2017. Research on joint distribution
cost allocation model. Boletin Tecnico/Technical
Bulletin, 55(10), 291-297.
ICORES 2019 - 8th International Conference on Operations Research and Enterprise Systems
298
