
Remote Over-saturation Amplification of Optical Fiber Monitoring
Pulses
Breno Perlingeiro
1,∗
, Pedro Tovar Braga
1
, Felipe Calliari
1
, Guilherme P. Temporão
1
,
Gustavo C. Amaral
1,2
and Jean Pierre von der Weid
1
1
Center for Telecommunication Studies, Pontifical Catholic University of Rio de Janeiro, 22451-900 Rio de Janeiro, Brazil
2
QuTech and Kavli Institute of Nanoscience, Delft University of Technology, 2600 GA Delft, The Netherlands
Keywords:
FPGA, Coherent Optical Amplification, Semiconductor Optical Amplifier, Optical Network Supervision.
Abstract:
Optical fibers constitute a staggering portion of the physical layer underlying modern communication net-
works. To extend the reach of such networks around the globe, long-haul links are necessary. In this context,
establishing a connection between two remote locations is only possible due to signal booster stations inter-
spersed along the way. Supervision of such long distance links is of the utmost importance for their reliable
operation. For multiplexed networks, high-ratio optical splitters are necessary to distribute the optical signal to
multiple users, diminishing severely the transmitted power for each network. In this work, an automated sig-
nal boosting remote station for monitoring signals is presented. A Field Programmable Gate Array (FPGA) is
part of the remote station and grants its autonomous operation. Making use of a topology capable of reaching
over-saturation amplification of semiconductor optical amplifiers (SOA), a higher portion of the optical loss
experienced in the splitter is precompensated in the remote node allowing for supervision reach-extension.
Approximately 0.5 dB of increased dynamic range is experimentally achieved when comparing the proposed
remote station with another one using the same optical amplifier. Even though the obtained extra gain is
a minor improvement, the proposed topology paves the way for scalable amplification, allowing for longer
reaches.
1 INTRODUCTION
The globalization process creates the urge for long-
haul physical layer links that connect distant locations
with high data rates. Due to the broad bandwidth and
low attenuation provided by fiber-optic links, these
are often the choice when designing long-haul com-
munication systems (Yu and Zhang, 2016). This at-
tenuation, however low, is not zero and, even in an
unperturbed link, the optical signal must be boosted
to reach its destination with the expected power level.
The uppermost advantage of using optical amplifiers
for signal boosting is that the amplification occurs
entirely in the optical domain, without the need for
any electrical conversion, the price of which scales
abruptly (Simmons, 2005).
Even with the inclusion of such signal boosters,
link maintenance is limited by power loss events usu-
ally associated with the mechanical fragility of the
fiber, and robust operation can only be achieved with
physical layer supervision (Urban et al., 2013). Un-
fortunately, the amount of Rayleigh backscattered
power, onto which most supervision methods depend,
is extremely faint: the Rayleigh coefficient of stan-
dard telecommunication single-mode optical fibers is
-72 dB/m (Bergman et al., 2016). In the case of in-
tegrity tests of an optical fiber with a standard Opti-
cal Time Domain Reflectometry (OTDR) device, the
power of the monitoring pulse can eventually be less
than the required to reach a desired distance (Lai et al.,
1994). In such cases, an optical amplifier can be used
in a remote node to amplify the OTDR pulse, thus
making it capable of reaching longer distances.
As far as optical amplifiers are concerned, the op-
tical amplification method can be classified, with re-
spect to the pumping, in two (Govind, 2002): Semi-
conductor Optical Amplifiers (SOAs) make use of
electrical pumping, i.e., the injection of current into a
semiconductor heterostructure junction induces pop-
ulation inversion; and Fiber Amplifiers (such as Er-
bium Doped Fiber Amplifiers – EDFAs), on the other
hand, make use of optical pumping, i.e., population
inversion is achieved through the excitation of a dif-
ferent optical transition inside the material that decays
Perlingeiro, B., Braga, P., Calliari, F., Temporão, G., Amaral, G. and von der Weid, J.
Remote Over-saturation Amplification of Optical fiber Monitoring Pulses.
DOI: 10.5220/0007365401390146
In Proceedings of the 7th International Conference on Photonics, Optics and Laser Technology (PHOTOPTICS 2019), pages 139-146
ISBN: 978-989-758-364-3
Copyright
c
2019 by SCITEPRESS – Science and Technology Publications, Lda. All rights reserved
139

into the transition of interest. In both cases, for given
input and pump powers, all the population from the
excited state will be consumed in the amplification
before the pump can once again repopulate this tran-
sition, what leads to a steady-state condition known
as saturation.
For multiplexed passive optical networks (PON),
such as wavelength division multiplexing (WDM) or
time division multiplexing (TDM), high-ratio splitters
are necessary to distribute the optical signal to multi-
ple users, which accompanies an intrinsic substantial
reduction of the signal power. Therefore, being able
to preamplify the monitoring signal to the absolute
limit of the optical amplifier is interesting in order to
compensate a following a priori known high loss. The
network design in which the amplifier is placed before
the splitter allows for the amplification of the pulses
that monitor each of the users’ fibers connected to it,
i.e., centralization of the amplification, and extension
of the supervision reach.
Recently, an architecture that provides gain above
saturation of SOAs in the pulsed regime has been
presented (Amaral et al., 2016), with a subsequent
design simplification and optimization in (Resende
et al., 2017). The underlying concept for both im-
plementations is multiplexing one optical pulse into
two or more pulses, amplifying them separately until
the SOA’s saturation level, and later demultiplexing
the amplified pulses into a single one, thus granting
an amplification gain above the saturation gain of a
single SOA. There, however, the design was strictly
local, i.e., not suited for remote applications; fur-
thermore, its polarization alignment dependency pre-
sented a significant challenge for remote deployment.
In this work, a remote over-saturation amplifica-
tion node is assembled and its operation is verified
making use of off-the-shelf components and the de-
sign of (Resende et al., 2017). Using the simplest
implementation of the over-saturation system, with a
single multiplexing stage, a ∼ 0.5 dB dynamic range
gain could be achieved when compared to a standard
amplification system. Even though this is still a neg-
ligible factor, the successful remote operation of the
system represents an important step towards its ap-
plication in a scalable system, with more than one
multiplexing stage. The paper is organized as fol-
lows. Section 2 details the system architecture and
each of its constituents: the over-saturation amplifica-
tion system; the synchronization of the remote node
with respect to an incoming probe pulse; and the po-
larization stabilization system. In section 3, the re-
sults of photon-counting OTDR monitoring (Herrera
et al., 2016) are presented, demonstrating the trans-
parent adaptation and independent operation of the
presented system; comparative results are also dis-
cussed. Finally, Section 4 concludes the paper, with
further comments and conclusions.
2 EXPERIMENTAL SETUP
Throughout this document, and in previous works
(Resende et al., 2017), SOAs are used in the over-
saturation amplification topology while the aforemen-
tioned fiber amplifiers are not. The reason behind the
employment of the former and not the latter is the fact
that, differently from fiber amplifiers, SOAs can act
as high-speed high-extinction-ratio optical switches
(Amaral, 2014), a feature that allows the SOA to be
triggered in a chosen instant for a short period of
time. This results in a time-localized amplification
peak while also minimizing the emission of amplified
spontaneous emission (ASE), a serious concern espe-
cially for time-domain fiber monitoring solutions.
RemoteNode
Central
Office
AWG
2
1
3
1
2
3
Users
AmplificationSystem
Figure 1: Conceptual high-level block diagram of the im-
plemented system architecture. High peak power polarized
and narrow-bandwidth supervision pulses are generated in
the central office (CO) and launched into the feeder fiber.
In reaching the remote node, the pulse is amplified before
going through a passive optical splitter (in this particular
case, an arrayed waveguide grating (AWG) compatible with
dense-WDM networks. A bypass structure composed of
two circulators allows for the outgoing pulse to be ampli-
fied and the scattered signal to be routed back to the CO
unchanged.
The experimental setup, complete with a central
office and a remote amplification node, is depicted in
detail in Fig. 1. The OTDR probe pulse is generated
in the central office using a polarized and coherent
light source in order to comply both with the amplifi-
cation system requirements and with the requirements
of wavelength-division multiplexing (WDM) optical
networks monitoring. The arrangement of circula-
tors, one at each side of the amplification setup, al-
lows for the incoming light pulse to be routed through
the amplification, and the backscattered light to by-
pass the amplification. In the following sub-sections,
specific parts of the topology are explained in detail,
namely the pulse detection and conditioning, polar-
ization control, and amplification in the remote node.
PHOTOPTICS 2019 - 7th International Conference on Photonics, Optics and Laser Technology
140
2.1 Amplification System Overview
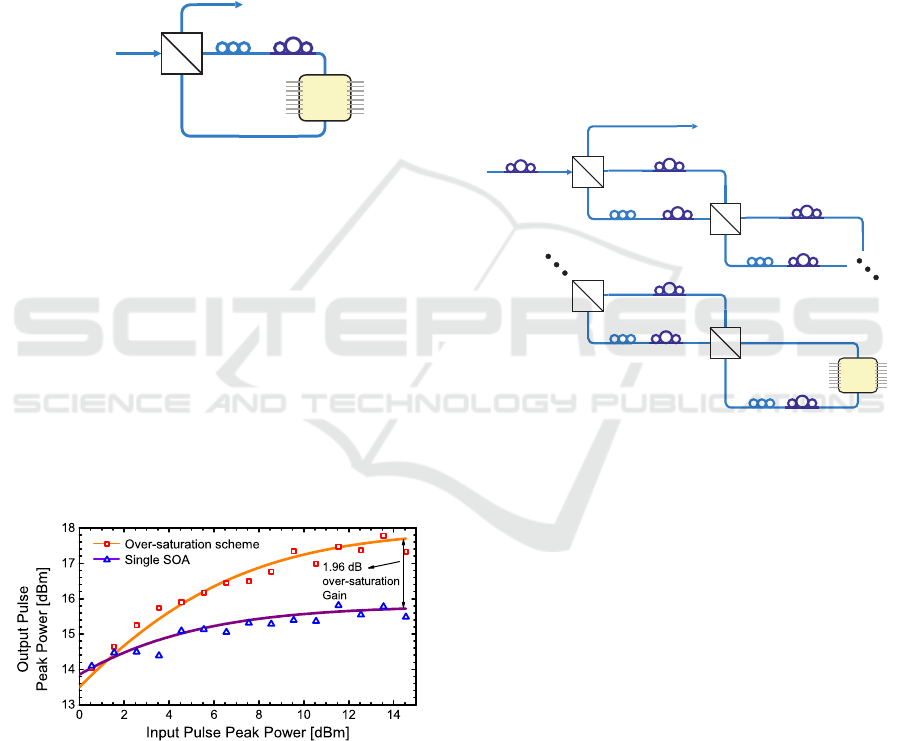
The over-saturation amplification scheme, depicted as
a single unit Fig. 1, has been decomposed into its
most fundamental blocks, namely a polarizing beam
splitter (PBS), an optical delay line, an SOA and a
polarization controller (PC), and is presented in detail
in Fig. 2. In it, a pulsed light signal, polarized such
that an equal ratio division takes place in the PBS,
enters the system; without loss of generality, the PBS
axis is defined as the rectilinear one, i.e., spanned by
the horizontal (H) and vertical (V) polarization states.
SOA
1
R
T
2
PC
Input
Output
Figure 2: Amplification system architecture. Time-
polarization multiplexing is enforced by the optical delay
line connected between the t (transmitted - H) and r (re-
flected - V) arms of the PBS.
Upon splitting, two pulses carrying half of the in-
cident optical power traverse the same looped path in
opposite directions. Time-polarization multiplexing
is enforced by the optical delay line and allows the
SOA to amplify each pulse individually. Finally, the
PC acts on the propagating pulse’s polarization so that
coherent recombination takes place in the PBS and
the amplified pulse exits through the remaining port.
Fig. 3 shows the amplification curves of the single
SOA and the proposed over-saturation amplification
system for different input peak powers.
Figure 3: Saturation curves for a single SOA and for the
over-saturation amplification scheme. Symbols correspond
to experimental data, and solid lines correspond to curve
fitting.
A 1.96 dB over-saturation gain could be achieved
experimentally according to Fig. 3. Note that the pro-
posed amplification system becomes advantageous
for input powers higher than 1.3 dBm, and as the input
power increases above this threshold value, the over-
saturation gain also increases, limited by 2 dB due of
the PBS’ insertion loss.
Another important result from (Resende et al.,
2017) is that this system can be scaled to achieve
even higher over-saturation amplification gains with
the addition of extra PBS’s and delay lines, where
each PBS added contributes with ∼ 2 dB of ampli-
fication gain. Fig. 4 shows the scalability feature of
this system with the use of N PBS’, what leads to a
N×2 dB gain. For instance, in case N = 2, to obtain ∼
4 dB of amplification gain it must be guaranteed that
the input pulse peak power would still be high enough
to saturate the SOA as the number of pulses traversing
the SOA will be doubled and its power halved. Also,
all the polarization alignment constraints should be
met so that the coherent recombination takes place in
the PBS, so extra PCs are necessary.
PCN_1
1
R
T
2
PCN_2ODN
PBSN
Input
Output
PCin
PCN-1_1
1
R
T
2
PCN-1_2ODN-1
PBSN-1
SOA
1
R
T
2
PC1
PBS1
OD1
PC2_1
1
R
T
2
PC2_2OD2
PBS2
Figure 4: Block diagram showing the scalability feature
of the amplification system architecture. One optical de-
lay line (OD) and a pair of polarization controllers (PC) is
needed for each PBS added.
2.2 Pulse Detection and Conditioning
The core concept of this work is to develop a low-cost
remote amplification unit which surpasses the satura-
tion limits of an SOA working in the pulsed regime,
the block diagram of which is presented in Fig. 5.
Due to the pulsed nature of the application, the electri-
cal pulses sent to the amplifier must be synchronized
to the arrival of the monitoring pulses for optimal per-
formance. The pulse emission rates and instants may
differ based on the scenario (link length and whether
the monitoring is performed at the same time as the
data transmission), so a synchronization mechanism
is implemented in an embedded electronic structure,
a Field Programmable Gate Array (FPGA). As it will
become clear in the next section, the FPGA is also
responsible for part of the polarization stabilization,
so the two functionalities are delegated to the same
processing unit.
Remote Over-saturation Amplification of Optical fiber Monitoring Pulses
141

SOA
PT
polarizer
A/D
FPGA
combiner
D/A
1
R
T
2
Input
Output
99
1
BS
feedbacksignal
PC PC
Over-saturation
AmplificationSetup
Polarizationand
Synchronization
Unit
Figure 5: Block diagram of Remote Amplification Unit.
A polarization and synchronization unit is responsible for
pulse detection, maintaining the polarization stable at |45
◦
i,
and triggering the SOA for pulse amplification. The over-
saturation amplification setup (Resende et al., 2017) per-
forms pulse amplification over the saturation limit of the
SOA. A/D: Analog-to-Digital converter; BS: arbitrary split-
ting ratio fibred beam splitter; D/A: Digital-to-Analog con-
verter; FPGA: Field Programmable Gate Array; PC: po-
larization controller; PT: Polarization Tracker; SOA: Semi-
conductor Optical Amplifier.
The synchronization between light pulses and
electrical pulses at the remote node is performed as
follows. A fibred beamsplitter with very high split-
ting ratio (99:1) is used to collect a small portion of
the incoming light signal, which passes through a po-
larizing fibred device (more details in the next sec-
tion) and is detected in a photodector. The analog
signal from the photodetector is converted to digital
in an analog-to-digital converter (ADC) and sent to
the FPGA, which implements a discrete derivative al-
gorithm that allows to transform the detected pulses
into narrow pulses that indicate the start and end of
a pulse based on whether its polarity is positive or
negative, respectively. In case of a positive transi-
tion, the FPGA imposes different time delays inter-
nally and generates two electrical pulses at its output
which are calibrated to match to the optical delay ex-
perienced by the incoming optical pulse. The delays
created by the FPGA must be different in order to trig-
ger the SOA at the exact moments when each of the
optical pulses pass through it.
In a real case scenario, where noise contribu-
tions from different sources affect the measured data,
thresholds for a transition in the discrete derivative al-
gorithm must be defined. Otherwise, false transitions
will be identified and the system will trigger the SOA
in times uncorrelated to the propagation of a monitor-
ing pulse, which translates to increased noise in the
fiber probing measurement. Therefore, the sensitivity
of pulse detection can be controlled in advance when
the specifications of devices involved in the detection
of the light pulse, the link length and losses, and the
input pulse power are known a priori.
Mathematical methods to implement an adap-
tive identification of transition thresholds, although
present in the literature (Harrison, 2003), have not
been implemented in this work but are a subject of
future study. Furthermore, it is interesting to notice
that the discrete derivative is DC-proof, i.e. it identi-
fies a transition due to the arrival of a pulse regardless
of the voltage value of its amplitude. This feature is
related to the fact that, when the signal is subtracted
by a one-cycle delayed version of itself (as it is done
in the discrete derivative), the DC component is elim-
inated.
2.3 Polarization Control
Operation in the pulsed regime has, as commented in
previous sections, a number of desired effects both
for time-domain optical fiber supervision and over-
saturation amplification; the former would be ex-
tremely complex in the continuous-wave case (in-
cluding a de-convolution algorithm) while the for-
mer would be impossible. Polarization control, on
the other hand, does not benefit from pulsed opera-
tion and becomes more complex: measuring the po-
larization state of the incoming light pulse can only
be performed during said pulse duration. Further-
more, in order to make use of available components,
a Polarization Tracker module (PT) (General Photon-
ics, 2013) is employed in the experimental realization
of the amplification remote node, the system within
which does not operate under the pulsed regime.
Making use of the synchronization scheme pre-
sented in the last section, it was possible to close the
feedback loop and ensure polarization stability. Based
on the arrival of an incoming light pulse, heralded by a
positive transition of discrete derivative, an embedded
electronic structure initializes acquisition of the pulse
amplitude until this signal outputs a negative transi-
tion, heralding the end of the light pulse; the ampli-
tude within the pulse duty cycle is thus acquired and
its average is stored in a memory structure. The out-
put is then calculated based on a convex combination
between the instantaneous acquired pulse amplitude
and the averaged value over the last N pulse detection
events, i.e.,
y(k) = α · u(k) +
(1 − α)
N
·
N
∑
i=1
u(k − i), (1)
where y (k) denotes the output amplitude, u (k) de-
notes the input average amplitude within the pulse
duty cycle, and α is the relative weight between the
instantaneous and accumulated acquired values.
The output value translates the evolution of the
pulse amplitude as the polarization is changed, and
PHOTOPTICS 2019 - 7th International Conference on Photonics, Optics and Laser Technology
142
can then be fed into the PT closing the feedback loop.
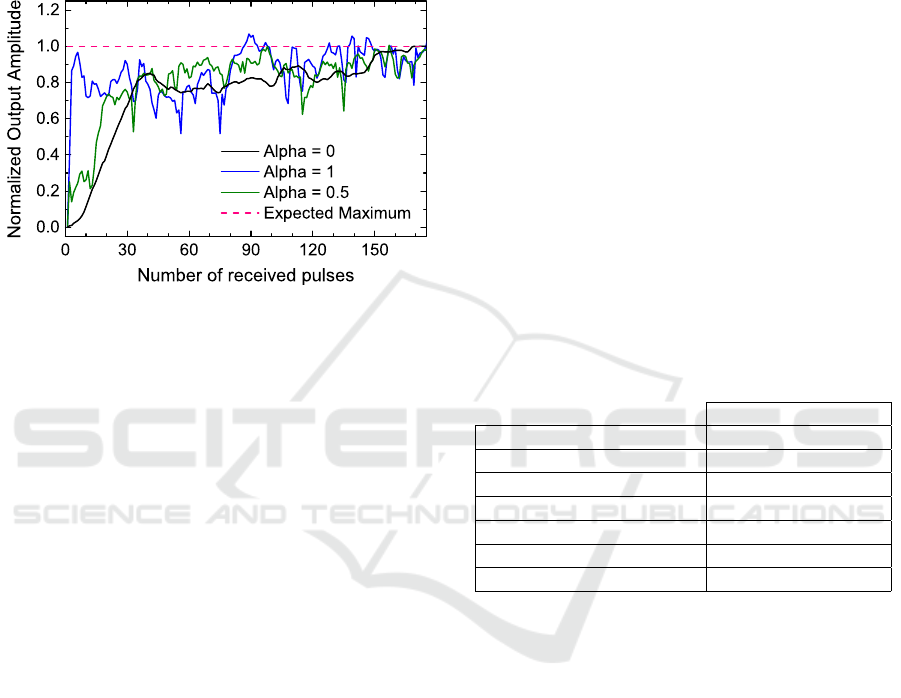
Adjusting the parameters α and N is no trivial task,
and the results of the automatic polarization control
for different values of α and a fixed value of N = 32
are presented in Fig. 6. Based on empirical result
analysis, N = 32 and α = 0.6 have been set as stan-
dard experimental parameters.
Figure 6: Polarization stabilization signal evolution as the
number of received probing pulses increases for different
values of α. Distinct characteristics in the curves’ be-
haviours can be identified: when the instantaneous mea-
sured value represents a higher contribution to the output
signal (α = 1), the system reaches saturation faster but with
sharper oscillations; when the accumulated measured val-
ues contribute more (α = 0), the system takes longer to
reach convergence but with a steadier evolution.
The facts that the full control of the polarization
state is not necessary (note that any polarization state
at the equator of the Poincaré Sphere that yields an
equal division of the input optical power between the
arms of the PBS can be used) and that the polarization
drift is expected to be a low-frequency process (ther-
mal effects that lead to change in the fiber birefrin-
gency) allow the polarization stabilization to be im-
plemented with state-of-the-art technology specific to
this application, which can reduce the cost of the pro-
posed system. Furthermore, the fact that the FPGA is
an integral part of the design and that FPGA-based
algorithms for polarization tracking have been pro-
posed (Garcia and Amaral, 2016) and implemented
in the literature (Lima et al., 2017) indicates that this
possibility is within the technological reach; this de-
velopment, however, is left as a future point of in-
vestigation and the proof of principle implementation
presented here is conducted with manufactured com-
ponents (General Photonics, 2013), which are avail-
able experimentally.
2.4 Power Consumption and Autonomy
The implementation of a remote amplification unit
would not be complete without the assessment of
its power consumption, and the reason for that is
twofold. Firstly, it enables one to determine which
type of supply is going to be necessary, i.e., a con-
nection to the power grid, or a simple battery. This
point is relevant in the case that the remote node is
placed in a location where access to the power grid
is costly. Secondly it enables the network operator to
balance the cost added by the addition of such remote
amplification unit and the advantages introduced by
its employment. This last point can indeed become
the most relevant one since it is not scarcely that the
operation expenditures (OPEX), the cost associated
to keeping the system running – to which the power
supply costs would be added –, overcome the capi-
tal expenditures (CAPEX), the cost of implementing
the system. In Table 1, the power consumption of the
proposed system, stratified with respect to each indi-
vidual component, is presented.
Table 1: Power consumption of each individual device that
composes the proposed remote amplification unit.
Power supply (mW)
ADS805 (ADC) 300
DAC7541A (DAC) 300
Polarization Tracker 7800
Spartan-3E (FPGA) 154
SOA and Driver 4100
New Port 2011 (Detector) 360
Total 13014
When applicable, the data on Table 1 was ac-
quired through the devices datasheet (ADS805 (Texas
Instruments, 2002), DAC7541A (Farnell, 1993),
Polarization Tracker (General Photonics, 2013),
SOA1013SXS (ThorLabs, 2011), and New Port 2011
(New Port, 2009)) based on a pessimistic estimate,
where the devices are fully operational (driving the
maximum nominal current) at all times. In the case of
the FPGA, the Xilinx Power Estimator was employed,
and, for the combination of the SOA and its electronic
driver, the power consumption was acquired experi-
mentally. Among the devices listed, the PT exhibits
the by far higher power consumption since it inte-
grates many functionalities that, as commented in the
previous Section, might not be necessary for the im-
plementation of the proposed system. It is within the
future project’s goal of developing an FPGA-based
polarization tracker to substantially reduce its power
consumption.
Considering the pessimistic estimate, an off-the-
Remote Over-saturation Amplification of Optical fiber Monitoring Pulses
143

shelf 12V battery (Expert Power, 2012) with 18000
mAh capacity could supply the system for around 16
days, an extremely limited autonomy. If one consid-
ers, however, that the CO is not arguing the fibre con-
stantly and does so four times per day during the span
of an hour, which constitutes a conservative rate, the
autonomy of the system would reach 100 days, i.e.,
a mobile team would only be scheduled every three
months to recharge the battery. It is interesting to note
that this calculation is still pessimistic in the sense
that, in general, the devices are not operating at their
full capacity and, thus, the practical power consump-
tion could be expected to reach much lower values.
The power consumption analysis of the proposed
remote unit yields, therefore, positive results with re-
spect to the previously mentioned first point, i.e., its
autonomy. With respect to the second point, it is in-
teresting to analyze, for a more complete balance be-
tween cost and advantage, the gain in monitoring ef-
ficiency when the amplification is present. For this, it
is useful to consider the monitoring time spent by the
supervision technique – where we consider, as in all
the experimental results, the photon-counting OTDR
of (Herrera et al., 2016) – to achieve a given mea-
surement accuracy in a specific scenario. In order to
maintain consistency with respect to the experimental
results of the next Section, a 24 km fiber with a 6 dB
power drop – that can be compensated by the imple-
mentation of the proposed remote over-saturation am-
plification – at kilometer 12 is considered as the sce-
nario; furthermore, an accurate measurement is de-
fined as a minimum of 10 dB signal-to-noise ratio
(SNR), which, for the fiber measurement, translates
into achieving a 10 dB SNR in the last position of the
fiber.
Under these conditions, it is possible to estimate
the total monitoring time in case the proposed system
is implemented and when no amplification is present.
Following the calculations of (Amaral, 2014), i.e.,
with a 500 ns separation between 20 ns gates in the
photon-counting OTDR, an accurate fiber measure-
ment with no amplification in the remote node would
take about 45 minutes. In great contrast with this
result, the elapsed time of an accurate measurement
in presence of remote node amplification would only
take 5 minutes, a nine times gain in measurement
time. With this margin, the network operator can
either supervise more fibers in less time, or activate
the monitoring system during a much shorter time; in
both cases, the implementation of the proposed sys-
tem is advantageous with respect both to the power
consumption in the CO side, which figures as a mi-
nor advantage, and in the data transmission downtime
necessary to supervise the fiber (in case in-service
monitoring is not possible), therefore reducing the
OPEX of the network operator.
3 OTDR MEASUREMENT
RESULTS
As shown in section 2.1, the proposed amplifica-
tion system will over-perform an amplification sys-
tem consisting of a single SOA for pulses with in-
put peak power above ∼ 1.3 dBm. In the remote
over-saturation scheme, however, this limit is ∼ 1 dB
higher because of extra insertion losses imposed by
the PT and the beam splitter (99:1). This 2.3 dBm
limit represents the turning point where the additional
losses introduced by extra devices are compensated
for the multiplexed amplification of the pulses. There-
fore, for values below this limit, the over-saturation
amplification system will cause power losses. At the
same time, if the input power is extremely high, even
the over-saturation system will reach saturation. En-
suring the correct input power balance is a crucial as-
pect of the network design using the proposed sys-
tem, a feature which is pictorially presented in Fig. 7,
where OTDR traces of the same fiber with different
input peak powers and making use of the amplifica-
tion system are depicted.
Figure 7: OTDR traces of the same optical fiber link com-
posed of a ∼ 12 km and a ∼ 4 km fibers connected in be-
tween to the amplification system. The peak power levels
depicted are measured at the CO’s output. Measurement
times for each trace were 6 minutes.
The black trace corresponds to a condition where
the input peak power saturates the over-saturation am-
plification system and the power after the remote node
drops slightly. The red and blue traces, on the other
hand, are within the input peak power level region that
allows for over-saturation amplification gain. Finally,
the green trace corresponds to a power level below
the over-saturation limit and a slight power drop is
observed. Even though the over-saturation amplifica-
tion system can indeed saturate, this limit can be in-
PHOTOPTICS 2019 - 7th International Conference on Photonics, Optics and Laser Technology
144
creased by scaling the topology as suggested in (Re-
sende et al., 2017).
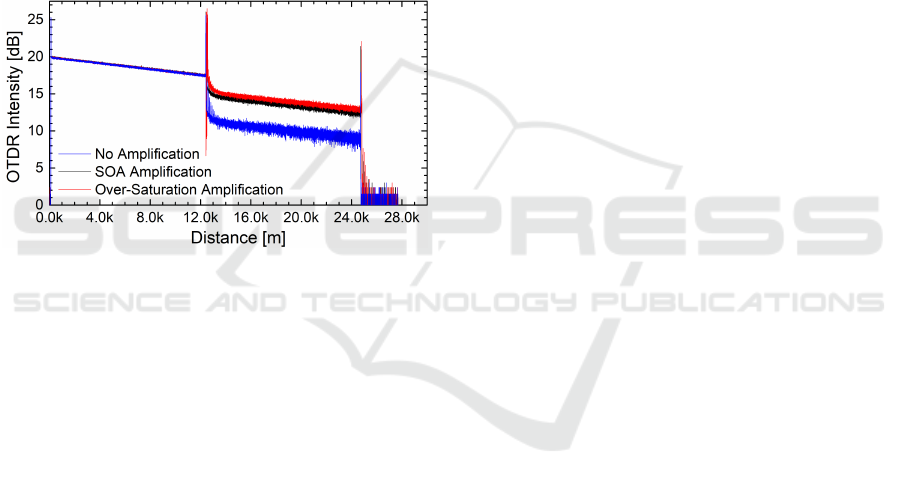
In order to provide a fair and practical compara-
tive analysis of the capabilities of the presented sys-
tem, fiber profiles acquired using a photon-counting
OTDR system are presented. The test for which the
results are depicted in Fig. 2 simulate a simple WDM
network composed of a ∼ 12 km feeder fiber, a remote
splitting node, and a single ∼ 12 km fiber directed to
the user. The remote node includes an AWG with an
experimentally measured ∼ 6 dB insertion loss. The
three traces correspond to: the fiber profile without
amplification in the remote node; the fiber profile with
an SOA as remote node amplification; and the over-
saturation amplification system as remote node am-
plification.
Figure 8: OTDR traces acquired using a photon-counting
OTDR monitoring system (Herrera et al., 2016). The link
follows the diagram of Fig. 1, with an AWG right after the
amplification system. Both the feeder and user fibers are
∼ 12 km-long. The over-saturation system achieved higher
AWG loss compensation than the one achieved with a single
SOA, confirming the system’s application proposal. Mea-
surement times for each trace were 30 minutes.
It is important to note that amplification with the
SOA also requires pulse synchronization but not po-
larization control (the SOA presents negligible polar-
ization dependent loss (PDL)), therefore, the excess
loss of the polarization tracker is not present in this
measurement. The bypassing structure, however, is
unnecessary in both cases since amplification is uni-
directional. Even though, in the results of Fig. 8,
a ∼ 0.5 dB difference is measured between the two
traces, this represents a ∼ 1.0 dB over-saturation gain,
which is halved by the round-trip factor of the OTDR.
It is also interesting to note that, apart from peaks
and troughs in the resulting trace in the vicinities of
the amplification setup, the profile of the fibers is un-
altered, showcasing the transparent adaptation of the
system to monitoring applications. These peaks and
troughs are associated to reflections present in the am-
plification setup that can be neglected while analyzing
the resulting profile.
Extending the reach of OTDR measurement have
been given a considerable amount of attention in the
past decade, and the Coded OTDR (Park et al., 2007)
has been, without a doubt, one of the most successful
propositions. However, the implementation complex-
ity of such technique is considerably higher and the
impact on the transmitted data in case of in-service
monitoring can be higher than for the single-pulse
OTDR, which has been shown to induce negligible
noise (Amaral et al., 2014). Furthermore, the present
limitation of 0.6dB over a single SOA is expected to
be extended in a scalable design.
4 CONCLUSION
Losses in optical fiber links are extremely detrimen-
tal to network operation and single-ended link super-
vision figures as a solution for robust and centralized
network management. Within this context, fiber faults
can be located and repaired, but intrinsic losses due to
passive elements necessary for the network operation,
such as splitters, must be otherwise compensated for.
In this work, a remote automated amplification unit
capable of operating at over-saturation is presented as
a mean of compensating the loss of such splitters. The
structure of the remote amplification node, including
optical and electronic parts, is discussed and experi-
mentally verified.
The results from photon-counting OTDR monitor-
ing systems are consistent with respect to the dynamic
range gain factor, i.e., ∼ 0.5 dB when compared to a
regular amplifier. Even though this is still a small gain
factor, the scalability of the over-saturation amplifi-
cation would allow for even higher gain factors, and
the present work paves the way towards such imple-
mentation. When compared to the case where no re-
mote amplification is present, a considerable increase
in dynamic range is observed, enforcing the hypothe-
sis that the strategical placement of amplification sys-
tems in the vicinities of high a priori known power
losses is advantageous. Not only that, but this par-
ticular network design allows for centralized and re-
mote amplification of the probing pulses sent from the
Central Office before they are split into different user
fibers. At the same time, as the results of (Amaral
et al., 2016; Resende et al., 2017) show, the gain of
over-saturation amplification systems decreases dra-
matically when the input power is not sufficient to sat-
urate the amplifier, so planning the system’s location
is crucial for its optimal performance.
Remote Over-saturation Amplification of Optical fiber Monitoring Pulses
145

ACKNOWLEDGMENT
The authors would like to thank brazilian agencies
CNPq, Capes and FAPERJ for financial support.
REFERENCES
Amaral, G. C. (2014). FPGA applications on single photon
detection systems. MsC Thesis.
Amaral, G. C., Herrera, L. E., Vitoreti, D., Temporão, G. P.,
Urban, P. J., and der von Weid, J. P. (2014). Wdm-pon
monitoring with tunable photon counting otdr. IEEE
Photonics Technology Letters, 26(13):1279–1282.
Amaral, G. C., Herrera, L. E. Y., Resende, M. M., Tem-
porão, G. P., Urban, P. J., and von der Weid, J. P.
(2016). Time-polarization multiplexing for increased
output power of Semiconductor Optical Amplifiers in
the pulsed regime. Appl. Opt., 55(28):7878–7884.
Bergman, A., Davidi, R., Shalev, A. I., Ovadia, L., Langer,
T., and Tur, M. (2016). Increasing the measurement
dynamic range of Rayleigh-based OFDR interrogator
using an amplifying add-on module. IEEE Photonics
Technology Letters, 28(22):2621.
Expert Power (2012). EXP12180. https://cdn.shopify.
com/s/files/1/2364/9089/files/EXP12180-Specs.pdf?1
0653271711015005675.
Farnell (1993). DAC7541A. http://www.farnell.com/data
sheets/673292.pdf.
Garcia, J. D. and Amaral, G. C. (2016). An optimal polar-
ization tracking algorithm for lithium-niobate-based
polarization controllers. In Sensor Array and Mul-
tichannel Signal Processing Workshop (SAM), 2016
IEEE, pages 1–5. IEEE.
General Photonics (2013). Polarization Tracker. http://
www.generalphotonics.com/downloads/manuals/POS
-002-Manual-V2-1-9-27-13.pdf.
Govind, P. A. (2002). Fiber-Optic Communication Systems.
John Wiley, New York.
Harrison, R. R. (2003). A low-power integrated circuit for
adaptive detection of action potentials in noisy sig-
nals. In Engineering in Medicine and Biology Society,
2003. Proceedings of the 25th Annual International
Conference of the IEEE, volume 4, pages 3325–3328.
IEEE.
Herrera, L. Y., Calliari, F., Garcia, J. D., Amaral, G. C., and
von der Weid, J. P. (2016). High Resolution Auto-
matic Fault Detection in a Fiber Optic Link via Photon
Counting OTDR. In Optical Fiber Communication
Conference, page M3F.4. Optical Society of America.
Lai, Y. W., Chen, Y. K., and Way, W. I. (1994). Novel
supervisory technique using Wavelength-Division-
Multiplexed OTDR in EDFA repeatered transmis-
sion systems. IEEE Photonics Technology Letters,
6(3):446–449.
Lima, V. M., Amaral, G. C., Calliari, F., Temporão, G. P.,
von der Weid, J. P., Garcia, J. D., and Garcia, J. P.
(2017). Fast polarization switch for polarization-
based quantum communication. In Proceedings of
the 5th International Conference on Photonics, Op-
tics and Laser Technology - Volume 1: PHOTOPTICS,
pages 288–293. SciTePress.
New Port (2009). Model 2011. https://www.newport.
com/medias/sys_master/images/images/hc5/hb2/8796
990341150/2001-2011-User-Manual-RevB.pdf.
Park, N., Lee, J., Park, J., Shim, J. G., Yoon, H., Kim,
J. H., Kim, K., Byun, J.-O., Bolognini, G., Lee, D.,
et al. (2007). Coded optical time domain reflectom-
etry: Principle and applications. In Passive Compo-
nents and Fiber-based Devices IV, volume 6781, page
678129. International Society for Optics and Photon-
ics.
Resende, M. M., Tovar, P., Amaral, G. C., and von der Weid,
J. P. (2017). Overcoming the maximum amplification
limit of coherent optical pulses in Semiconductor Op-
tical Amplifiers with time-polarization multiplexing.
Optical Engineering, 56(11):110502.
Simmons, J. M. (2005). On determining the optimal optical
reach for a long-haul network. Journal of Lightwave
Technology, 23(3):1039.
Texas Instruments (2002). ADS805. http://www.ti.com/lit/
ds/symlink/ads805.pdf.
ThorLabs (2011). C-band Semiconductor Optical Ampli-
fier. Accessed: 2010-09-30.
Urban, P. J., Vall-Llosera, G., Medeiros, E., and Dahlfort,
S. (2013). Fiber plant manager: An OTDR-and OTM-
based PON monitoring system. IEEE Communica-
tions Magazine, 51(2):S9–S15.
Yu, J. and Zhang, J. (2016). Recent progress on high-
speed optical transmission. Digital Communications
and Networks, 2(2):65 – 76.
PHOTOPTICS 2019 - 7th International Conference on Photonics, Optics and Laser Technology
146
