
Field of Interest Proposal for Augmented Mitotic Cell Count:
Comparison of Two Convolutional Networks
Marc Aubreville
1
, Christof A. Bertram
2
, Robert Klopfleisch
2
and Andreas Maier
1
1
Pattern Recognition Lab, Computer Sciences, Friedrich-Alexander-Universit
¨
at Erlangen-N
¨
urnberg, Germany
2
Institute of Veterinary Pathology, Freie Universit
¨
at Berlin, Germany
Keywords:
Mitotic Figure, Cell Segmentation, Digital Histopathology, Tumor Grading.
Abstract:
Most tumor grading systems for human as for veterinary histopathology are based upon the absolute count of
mitotic figures in a certain reference area of a histology slide. Since time for prognostication is limited in a
diagnostic setting, the pathologist will oftentimes almost arbitrarily choose a certain field of interest assumed
to have the highest mitotic activity. However, as mitotic figures are commonly very sparse on the slide and
often have a patchy distribution, this poses a sampling problem which is known to be able to influence the
tumor prognostication. On the other hand, automatic detection of mitotic figures can’t yet be considered
reliable enough for clinical application. In order to aid the work of the human expert and at the same time
reduce variance in tumor grading, it is beneficial to assess the whole slide image (WSI) for the highest mitotic
activity and use this as a reference region for human counting.
For this task, we compare two methods for region of interest proposal, both based on convolutional neural
networks (CNN). For both approaches, the CNN performs a segmentation of the WSI to assess mitotic activity.
The first method performs a segmentation of mitotic cells at the original image resolution, while the second
approach performs a segmentation operation at a significantly reduced resolution, cutting down on processing
complexity.
We evaluate the approach using a dataset of 32 completely annotated whole slide images of canine mast cell
tumors, where 22 were used for training of the network and 10 for test. Our results indicate that, while
the overall correlation to the ground truth mitotic activity is considerably higher (0.936 vs. 0.829) for the
approach based upon the fine resolution network, the field of interest choices are only marginally better. Both
approaches propose fields of interest that contain a mitotic count in the upper quartile of respective slides.
1 INTRODUCTION
Mitotic figures, i.e. cells undergoing cell division,
are an important marker for tumor prognostication, as
their density within tissue on a histology slide is as-
sumed to be correlated with the proliferative rate of
the tumor (Elston and Ellis, 1991). Hence it is not
surprising, that detection of mitotic figures has been
the target of several object detection challenges in re-
cent time (Roux et al., 2013; Veta et al., 2015; Veta
et al., 2018). Detection of mitotic figures in digi-
tal whole slide images (WSI) is, however, not only
a time-consuming task (as WSIs typically have very
large image dimensions), but also a task presently
not solved with a clinical applicable accuracy. This
can be related to a number of factors: Firstly, the
very definition of mitotic figures in histology slides
is tricky, as their morphology is vaguely described
as being without a nuclear membrane (post prophase)
with hairy extensions of nuclear material around the
chromosomes (Van Diest et al., 1992). Depending
on factors such as inferior tissue quality often deriv-
ing from delayed tissue fixation, it is not always pos-
sible to unambiguously differentiate mitotic figures
from mitotic-like structures such as pyknotic tumor
cells of overstained nuclei. This leads to a high intra-
observer variance (Boiesen et al., 2000) in grading of
cells between labs, schools and even individuals that
are likely to reflect in data sets of mitotic figures ap-
plied for current developments of algorithms. Sec-
ondly, histology slides are subject to staining in or-
der to make important details visible to the human
eye. This dying procedure is however also subject to
a number of influencing factors, including concentra-
tion and purity (Horobin, 1969) of coloring agents,
slice thickness, the dying protocol and the dyed tis-
30
Aubreville, M., Bertram, C., Klopfleisch, R. and Maier, A.
Field of Interest Proposal for Augmented Mitotic Cell Count: Comparison of Two Convolutional Networks.
DOI: 10.5220/0007365700300037
In Proceedings of the 12th International Joint Conference on Biomedical Engineering Systems and Technologies (BIOSTEC 2019), pages 30-37
ISBN: 978-989-758-353-7
Copyright
c
2019 by SCITEPRESS – Science and Technology Publications, Lda. All rights reserved

sue itself. This leads to a significant color variance in
hematoxylin and eosin stained tissue sections, which
poses a challenge to pattern recognition methods, es-
pecially when color nuances may be a determining
factor for cell classification. Lastly, mitotis is a sparse
event in histology slides, which in turn leads to low
numbers of events across databases and one can hy-
pothesize, that not the complete biological variance
spread is represented in current mitosis data sets like
the Mitos (Roux et al., 2013) or TUPAC (Veta et al.,
2018) data set.
Since mitotic figures can not be assumed as being
evenly spread over the image, manual count within
the usual diagnostic area of 10 consecutive High-
Power-Fields (HPF, field of view at magnification of
400×) leads to an inherent sampling problem, as
also assumed by Bonert and Tate (Bonert and Tate,
2017). It is thus strongly dependent on the actual re-
gion chosen intuitively by the pathologist, how many
mitotic figures will be present within that area. Most
grading schemes incorporate the mitotic count (MC,
number of mitotic figures within 10 HPF) into the
tumor grade, often using a direct thresholding ap-
proach. Especially for tumors with borderline MC
around these thresholds, the area selection thus leads
to a significant additional variance in the process of
grading.
We assume that, in order to be clinical applicable,
one interesting methodological approach would not
be the direct recognition and fully automated count of
mitotic figures in slides, as commonly performed, but
rather the determination of a region of interest with
a high mitotic figure density, assuming that this is
also the region with highest proliferation. It is gener-
ally assumed that the region with highest proliferation
has the strongest prognostic value for tumor grading
(Martin et al., 1995; Baak et al., 2008; Edmondson
et al., 2014).
As such, the primary output of our approach will
be the mitotic density of a given WSI. In order to
do so, we depend on an intermediate mitotic fig-
ure segmentation map, which will be predicted by a
deep convolutional network. In previous work, we
have shown that the U-Net network architecture by
Ronneberger et al. (Ronneberger et al., 2015) is a
very good candidate for this approach (Aubreville
et al., 2018b). This model, however, comes with a
quite high inherent complexity, and we wondered if
a smaller version of the same approach directly tar-
geting at a subsampled image map could yield similar
overall performance.
2 MATERIAL
We annotated 32 whole slide images of canine cu-
taneous mast cell tumor, dyed with standard hema-
toxylin and eosin stain. All specimen was taken for
routine tumor diagnostics, therefore no IRB approval
was needed for this study. All slides were digitized
using a linear scanner (Aperio ScanScope CS2, Le-
ica Biosystems, Nussloch, Germany) at a magnifica-
tion of 400×, resulting in a digital resolution of 0.25
microns per pixel. We used the open source soft-
ware solution — (Aubreville et al., 2018a) to attain
a complete annotation map of all 32 WSI. The anno-
tation process was performed in a partly computer-
aided procedure, where the software would suggest
partly overlapping segments of the whole slide im-
age to the expert to annotate mitotic figures. In this
process, we did not only annotate mitotic figures, but
also granulocytes and other interesting cell types. It
should be noted that also non-mitotic cells with simi-
lar appearance to mitotic figures were annotated with
a designated class assigned to them. A second expert
was asked to rate all cells blindly (i.e. not knowing the
assigned class by the first expert). We only consider
mitotic figures where both experts agreed on it being
a mitosis for our data set, however, for hard negative
examples, also mitotic figures annotated from one ex-
pert only or the aforementioned mitosis-like cells will
be part of our training process. Following this defi-
nition of mitotic figure, our data set includes a total
of 45,811 mitotic cells. To increase generalization,
the data set purposefully includes cell tumors of dif-
ferent sizes and tumor grade, and thus the MC varies
tremendously across cases.
3 METHODS
Mitosis detection is often considered an object de-
tection approach, where singular events on an image
have to be counted (Veta et al., 2015; Li et al., 2018;
Cires¸an et al., 2013, and others..). This is due to
the fact that mitotic events are often seen as a sin-
gular occurrence that can be described using a single
(x,y) tuple. This is also reflected in several data sets
such as MICCAI AMIDA 2013 (Veta et al., 2015),
ICPR MITOS-ATYPIA 2014 and TUPAC 16 (Veta
et al., 2018), which use this for annotation. Other
data sets, such as the Mitos 2012 data set (Roux et al.,
2013), provide segmentation information for mitotic
cells, which is, however, a tedious process. In gen-
eral, dataset creation for mitotic figure detection tasks,
is a labour-intensive task, which might be one of the
reasons for the limited data set size. To reduce the
Field of Interest Proposal for Augmented Mitotic Cell Count: Comparison of Two Convolutional Networks
31
whole slide
image
Mitosis
detector
network
RGB to
grey
MA
w,h
closing
threshold
constrained
arg max
center
of region
proposal
MA
w,h
Otsu
thres.
patch
extraction
concatate
mitotic figure
map
mitotic activity estimation branch
valid mask generation
V
M
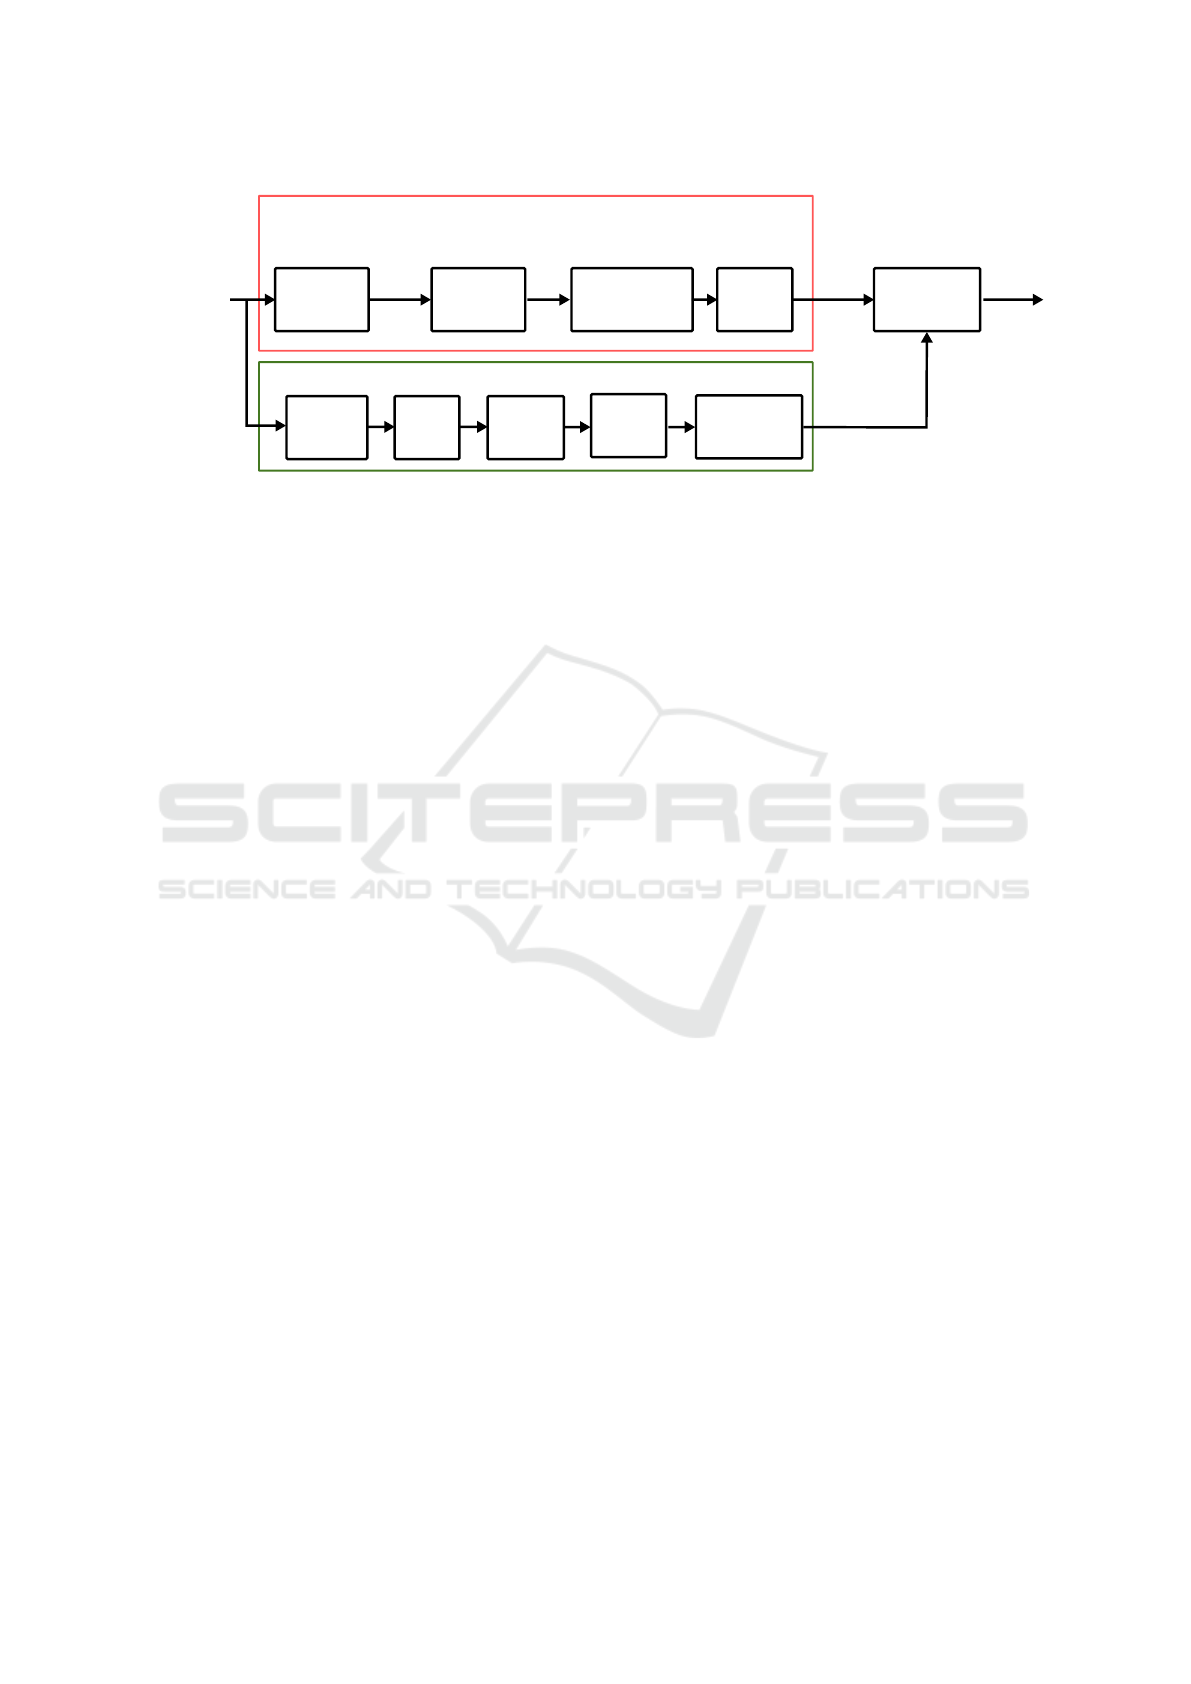
Figure 1: Overview of the proposed approach for mitotic count region proposal (Aubreville et al., 2018b). The upper path
will derive singular mitotic annotations, followed by a moving average (MA) filter. The lower path derives an activity map of
the image to exclude border regions of the image. This paper compares two mitosis detector CNNs, as further detailed in Fig.
2 and Fig. 3.
impact of this, we decided to use our own data set
of canine mast cell tumors for this work. Addition-
ally to an unprecedented size, our data set provides
us with complete annotations of whole-slide-images,
so border regions of the tumor as well as regions not
containing tumor tissue will be included and enable
an increased robustness of the approach.
3.1 Field of Interest Proposal
The goal of the algorithm is to suggest an area of the
size of 10 adjacent High Power Fields with the high-
est mitotic count. Following Meuten et al., we as-
sume this area to be a total of 2.37 mm
2
(Meuten et al.,
2016). We use an aspect ratio of 4 : 3 for this rectan-
gular selection.
As depicted in Fig. 1, our approach consists of
the generation of a map of mitotic figures on the WSI
M as well as a map of valid tissue V . For estimation
of the mitotic count we utilize a convolutional neural
network for generation of segmentation maps of mi-
totic figures. In order to retrieve the mitotic activity
in a certain area, a moving average operator is used.
3.1.1 Mitotic Activity Estimation
For estimation of mitotic activity, the image is di-
vided into overlapping (margin: 64 px) patches with
a size of 512 × 512 px. Due to the structure of the net-
work, also other sizes would be applicable, reducing
efforts for not covering the overlapping margins mul-
tiple times, but increasing memory footprint on the
graphics card. The prediction of the network is be-
ing concatenated to yield an overall map M of mitotic
figure activity.
3.1.2 Valid Mask Estimation
In order to exclude regions of the image that are partly
uncovered by specimen, we construct a binary mask
of tissue presence from the WSI at a low magnifica-
tion. The image is converted to grey-scale, then a
binary threshold is performed using Otsu’s adaptive
method (Otsu, 1979). A closing operator is applied
to reduce thin interruptions of the tissue map, and fi-
nally a moving average filter according to the size of
the desired field of view (equivalent to 10 HPF) is be-
ing applied. Next, a thresholding with 0.95 is applied
to retain only areas that are covered to at least 95 %
with tissue, resulting in the valid mask V .
Lastly, both maps M and V are used to find the
position of the maximum value, constrained to im-
age areas where the valid mask is nonzero. We ex-
pect that these coordinates represent the center of ten
high power fields with the highest mitotic count of the
WSI.
3.2 Comparison of Two Network
Architectures
Ronneberger’s U-Net architecture (Ronneberger
et al., 2015) has been successfully used in a large
number of segmentation tasks throughout med-
ical imaging, such as aortic stent segmentation
(Breininger et al., 2018), organ segmentation (Chen
et al., 2018) or bone and tumor segmentation (Kay-
alibay et al., 2017). We have shown previously
(Aubreville et al., 2018b), that this architecture can
also be used for direct mitotic figure segmentation.
However, in this approach, we generate a fine (i.e.
in the same resolution as the original image) segmen-
tation map of the image, where a much more coarse
version of the same map would be sufficient for the
BIOIMAGING 2019 - 6th International Conference on Bioimaging
32
WSI patch
Mitosis Det. CNN
prediction
ground truth
IoU
L
IoU
conv 3x3x8
conv 3x3x8
conv 3x3x16
conv 3x3x16
conv
3x3x32
conv
3x3x32
conv
3x3x64
conv
3x3x64
conv 3x3x128 conv 3x3x128
512x512x3
32x32x1
conv 1x1x1
conv 1x1x4
32x32x1
pool
pool
pool
pool
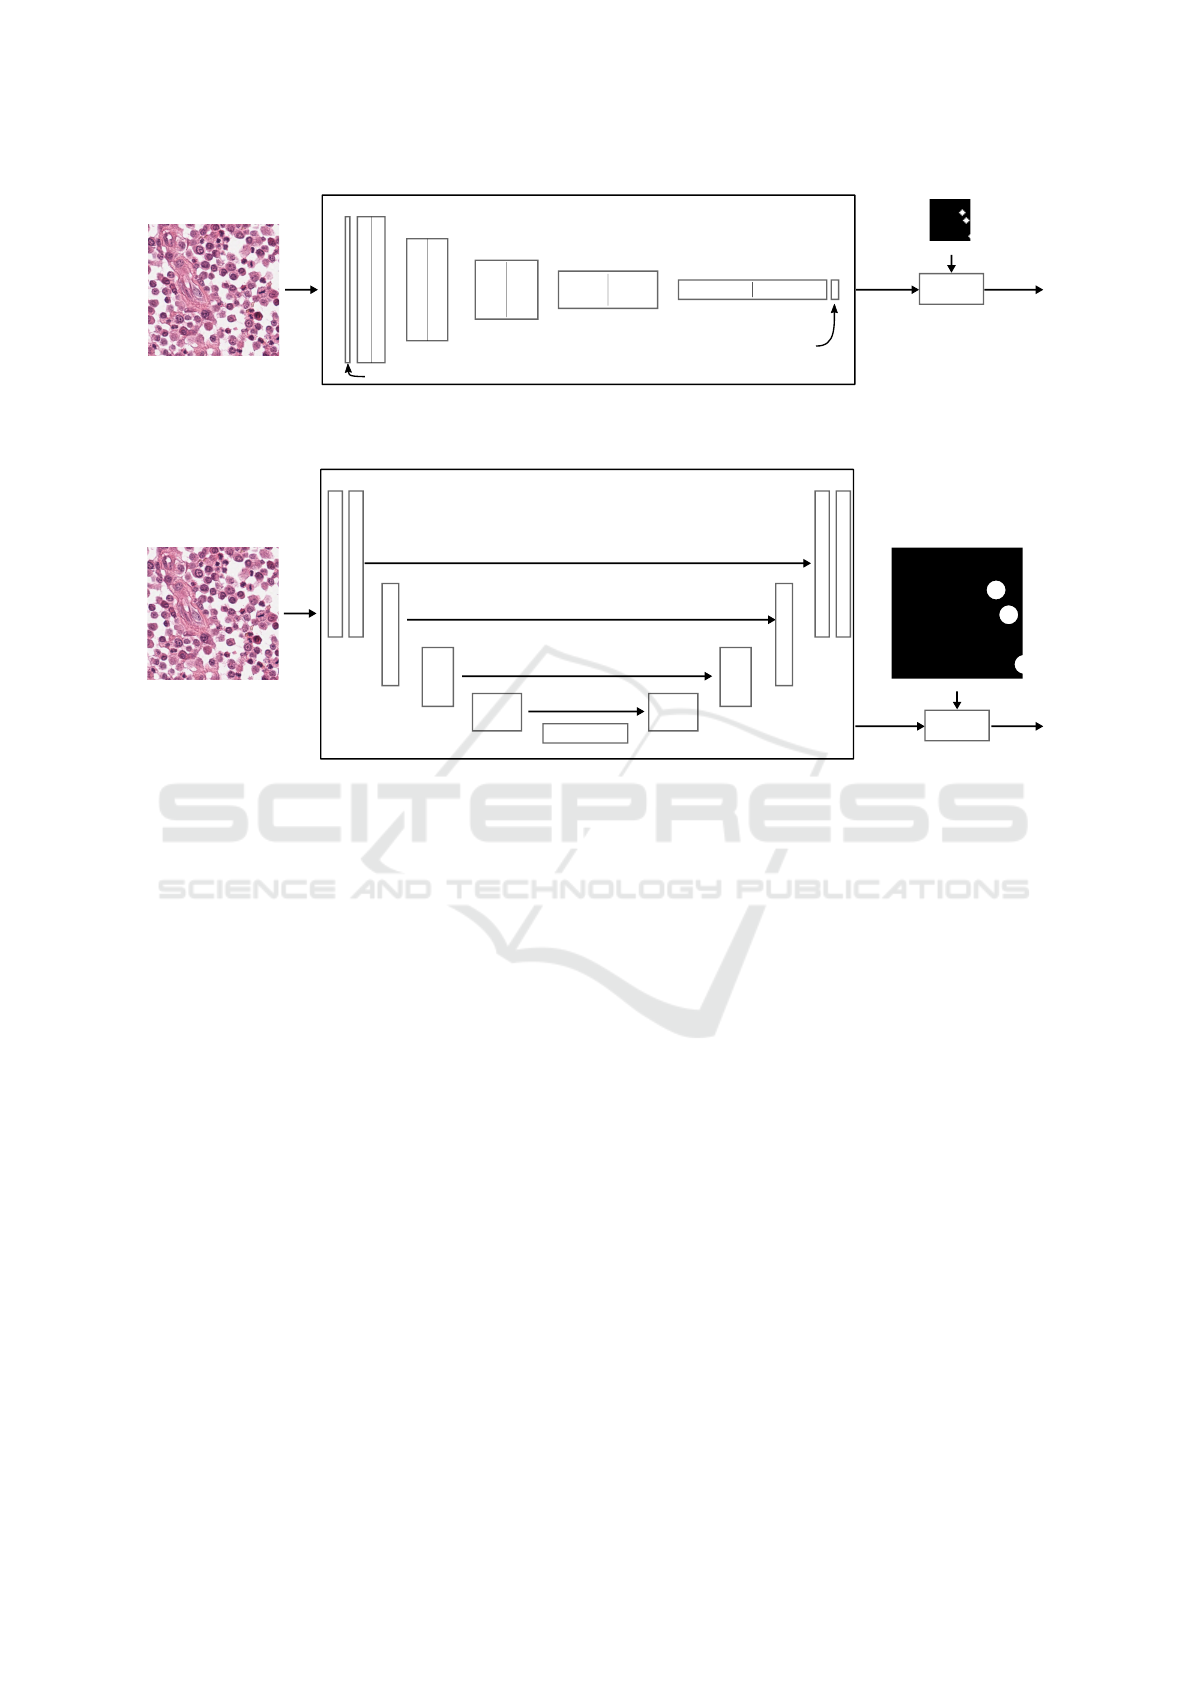
Figure 2: Overview of the coarse mitosis detection network (CMDN) and its training. The network predicts a 32×32 map,
i.e. a subsampling of 16, where mitotic figures are represented by filled circles. Intersection-over-Union (IoU) is used for
optimization.
WSI patch
Mitosis Det. CNN
prediction
ground truth
IoU
L
IoU
2x conv
3x3x32
2x conv
3x3x64
2x c 3x3x128
512x512x3
512x512x1
512x512x1
2x conv
3x3x64
2x conv
3x3x32
2x conv 3x3x8
pool
pool
pool
2x conv 3x3x16
pool
up
up
2x conv 3x3x16
up
2x conv 3x3x8
up
conv 1x1x1
conv 1x1x4
Figure 3: Overview of using U-Net as a mitosis detector. The network predicts a 512×512 full-resolution map, where mitotic
figures are represented by filled circles. Intersection-over-Union (IoU) is used for optimization.
subsequent steps of forming a map of mitotic density
estimates. We thus investigated the question if the
downsampling path of the U-Net architecture might
be sufficient for the given task, in effect removing the
complete upsampling path with its skip connections
and adding a simple 1×1 convolution layer. We will
denote this approach in the following as coarse mito-
sis detection network (CMDN).
3.2.1 Coarse Mitosis Detection Network
The coarse network (see Fig. 2) consists of 5 stages
of pairs of 2D convolution layers (filter kernel size:
3x3) followed by a maximum pooling operation (fil-
ter kernel size: 2x2) each. As in the approach by
Ronneberger et al., the filter depth (or number of fil-
ter channels) doubles with each layer. A 1x1 convo-
lution is being used at the input of the network for
colour space adjustment, and another 1x1 convolu-
tion to generate the output mask with a dimension of
32 × 32 × 1. Batch normalization and rectifying lin-
ear units (ReLU) as nonlinearities are used after each
convolutional layer. The final convolution layer uses
a sigmoid activation function. As described in earlier
works (Aubreville et al., 2018b), we utilize negative
Intersection over Union (IoU) as a loss function for
the task, and we minimize this using Adam Optimizer
(Kingma and Ba, 2014) with Tensorflow. The use of
IoU as a loss function, as proposed by Rahman and
Wang (Rahman and Wang, 2016), has the advantage
of helping with the strong imbalance problem intro-
duced by the sparsity of mitotic figures in WSI. The
IOU operator is being applied on the network output
and a ground truth estimate of mitotic figures (see Fig.
2). Here, since in the subsampled map, centers of mi-
totic figures will typically not be in the center of the
sampling grid, we use sub-coordinate drawing of the
mask (using the shift parameter of OpenCV’s circle
operation). This results in a more acurrate downsam-
pled representation of the mitotic figure mask.
3.2.2 U-Net as Mitosis Detection Network
For comparison, we segment the same input images
with a full-resolution mitotic figure map using Ron-
neberger’s U-Net approach (Ronneberger et al., 2015)
(see Fig. 3). We assume that, as in other evaluations,
the skip-connections between the downsampling path
and the respective same resolution of the upsamling
path will help the network to find more accurate re-
sults. Admittedly, this network will have approxi-
mately twice the parameters of the original network,
so it could potentially perform better due to its bigger
capacity.
Field of Interest Proposal for Augmented Mitotic Cell Count: Comparison of Two Convolutional Networks
33
3.2.3 Training of the Networks
Both networks have been trained for the exact same
number of iterations. We observed that for both net-
works, the training had converged, as visible in a sta-
ble validation loss. For both networks, training sam-
ples were drawn randomly from the complete train-
ing set consisting of 22 Whole Slide Images. In these
training images, the upper 80% was used for training,
while the lower 20% was used for validation.
We employed a strategy, where in each mini-batch
of three images, one image would contain at least one
mitotic figure, another would be drawn completely
randomly, and one would be the hard example pick,
containing at least one cell where either the experts
did not agree on being a mitotic figure or it being clas-
sified as mitotic-figure-similar but not being a mitotic
figure. Each of these images was taken as a crop with
random rotation from the original WSI. For valida-
tion, images were drawn completely at random from
the respective image region in order to be statistically
as close as possible to the actual test set. Due to this
approach of random sampling, we were not able to
determine a training epoch as by the classical defini-
tion of the network having seen all training images
once. Thus, we consider a run of 15,000 image iter-
ations a pseudo-epoch. As our validation set is com-
paratively large, we chose a random pick of 6,000 im-
ages to be run after each epoch to evaluate the per-
formance. Both networks have been trained for 150
pseudo-epochs.
4 RESULTS
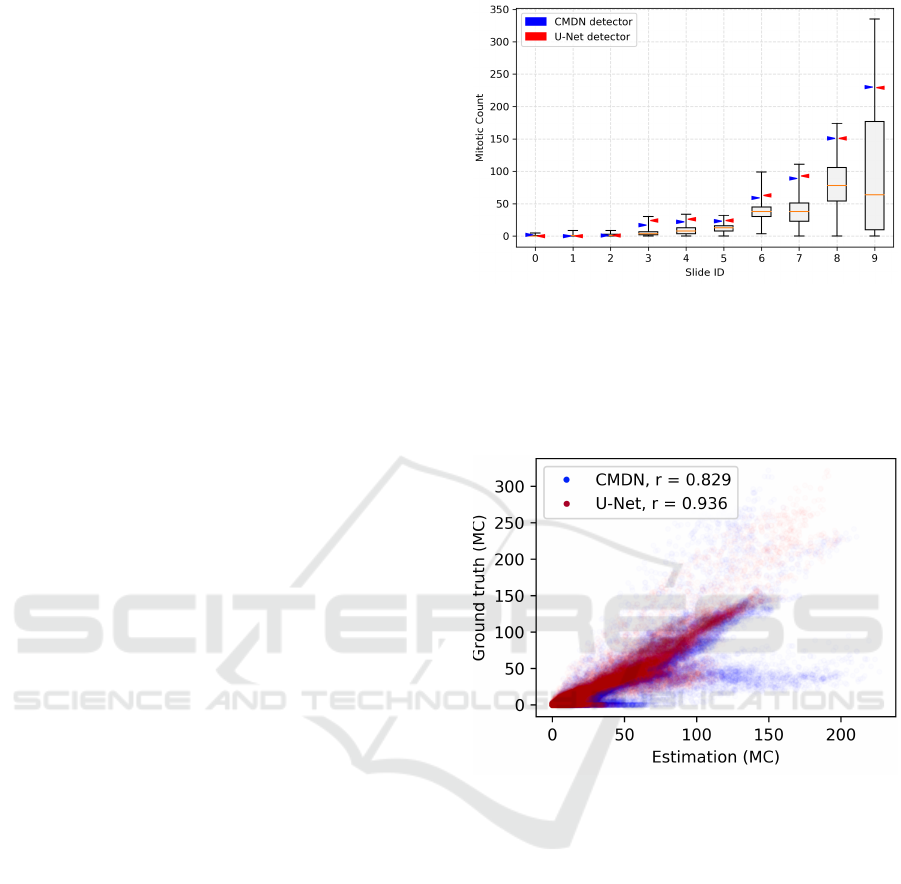
Evaluating both approaches, we find a much higher
correlation coefficient between the ground truth mi-
totic count map and the estimated map when using
the U-Net architecture (r = 0.936) compared to the
coarse CMDN approach (r = 0.829). As visible from
Fig. 5 the CMDN had a tendency to overestimate mi-
totic activity in the slides.
This also reflects in an overall better performance
in predicting a proper field of interest, as seen in
Fig. 4. Although for most test slides, the differences
were minor, we find a better region proposal for some
slides, e.g. for test slide 3, which is a relevant bor-
derline slide. As visible in Fig. 6(a), this slide has a
rather unequal distribution of mitotic figures (and thus
of MC) in the tissue. For all approaches, however, the
position chosen in the relevant slides (3-9), yields a
value in the upper quartile of mitotic count distribu-
tion (Fig. 4).
The evaluation of individual slides (Fig. 7 and Ta-
Figure 4: Box-whisker plots of mitotic count in all slides
of our test data set. Only tumor tissue was included in
this analysis. The arrows indicate the mitotic count (as of
ground truth labels) of the proposed position by the U-Net
detector (red) and the CMDN detector (blue) in the slide,
i.e. the closer it is to the maximum value of the distribution,
the better the estimate.
Figure 5: Relationship between ground truth mitotic count
and estimate for approaches using the coarse network
(CMDN, blue) and the U-Net (red) as mitotic figure detec-
tion network. Clearly, using the U-Net architecture leads
to an overall better correlation to the ground truth mitotic
count.
ble 1) shows, that correlation between mitotic count
estimate and ground truth is rather weak for slides
with very low mitotic activity (test slides 0 to 2).
Here, both networks tend to overestimate the presence
of mitotic figures. For borderline (3 to 5) and slides
with high mitotic activity (6 to 9), the correlation is
generally good.
For all individual test slides, the proposed region
reflects a region of high mitotic activity on the given
WSI.
BIOIMAGING 2019 - 6th International Conference on Bioimaging
34
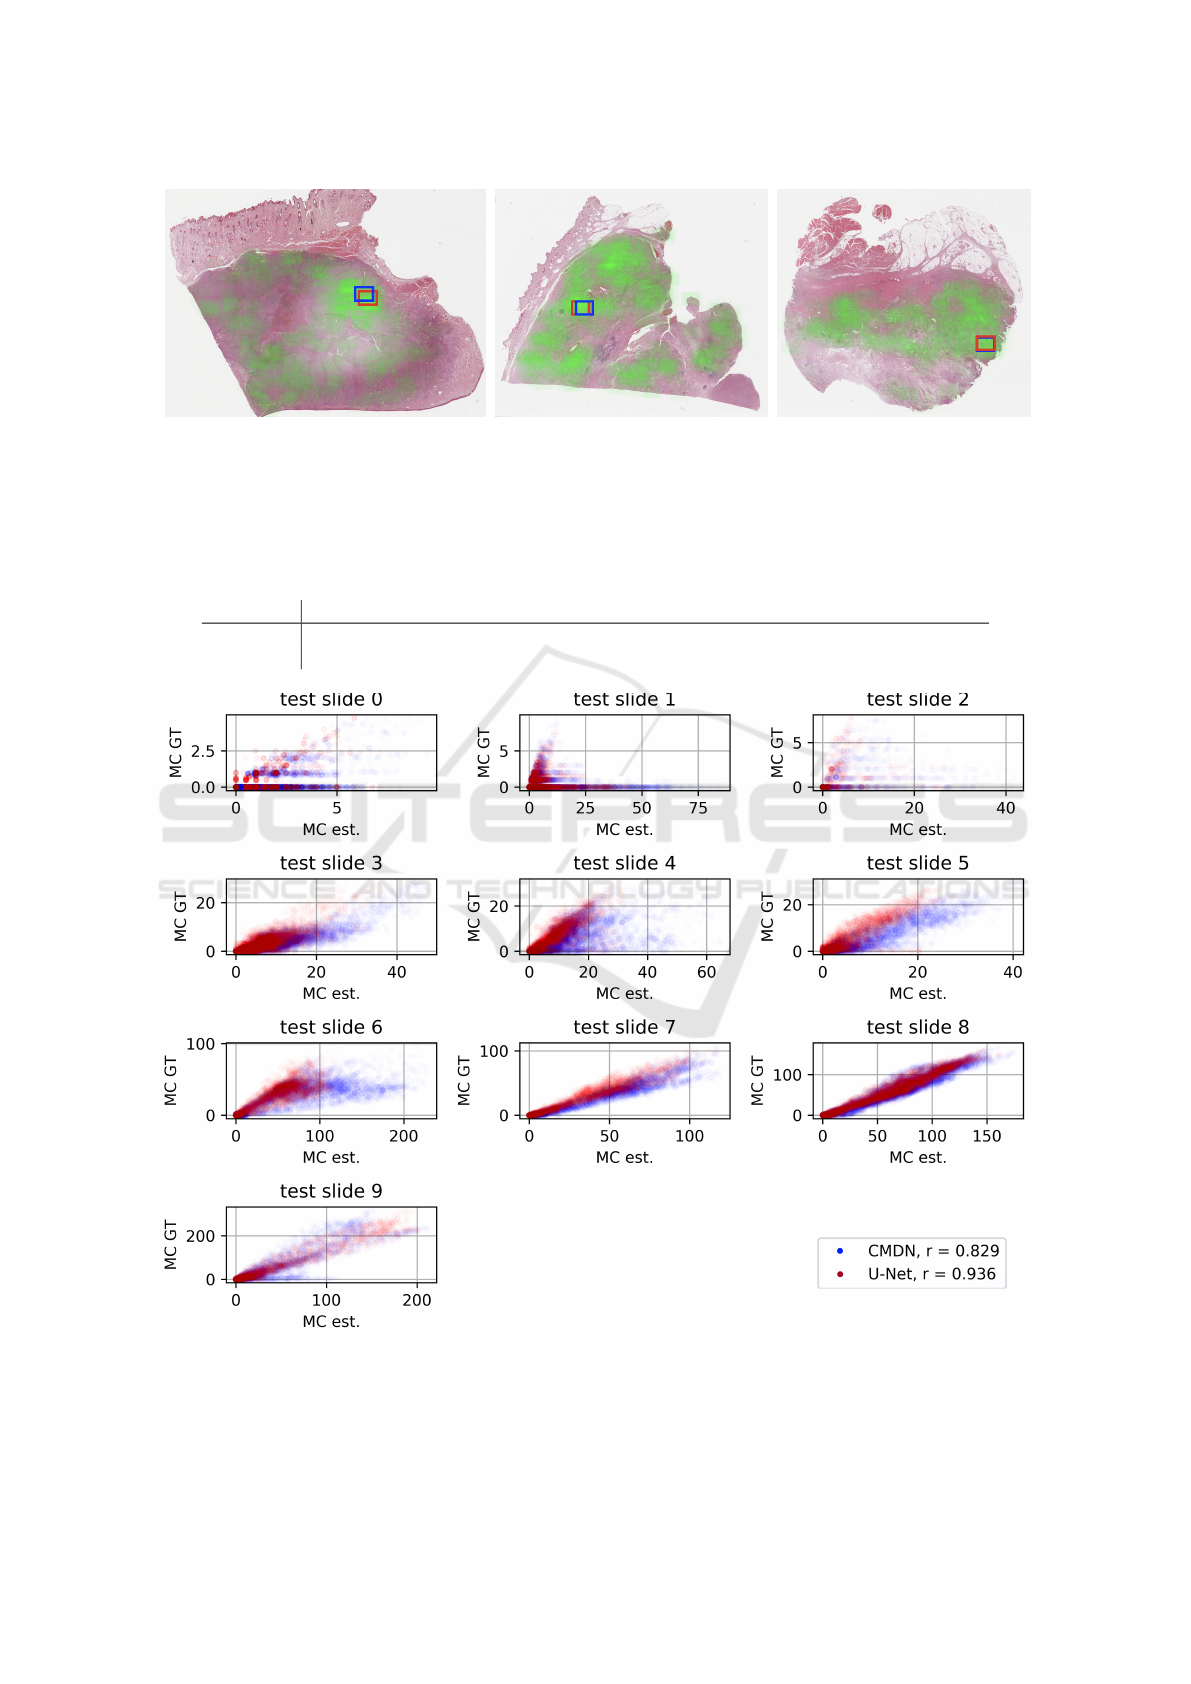
(a) Test slide 3 (b) Test slide 4 (c) Test slide 5
Figure 6: Ground truth distribution of MC (green overlay, where higher opacity indicates higher MC) and region proposal of
the approaches using U-Net (red) and CMDN (blue) for three slides of our test set. For all three slides, the proper choice of
field of view has a high influence on the prognostication.
Table 1: Correlation coefficients between estimated and ground truth mitotic count (MC) in the complete WSI for individual
slides in the test set. While for many slides, performance between both approaches is comparable, slide 0, 4, 6 and 9 yield a
clear advantage for the approach utilizing U-Net.
Test slide 0 1 2 3 4 5 6 7 8 9
CMDN 0.545 0.019 0.354 0.895 0.713 0.932 0.858 0.971 0.974 0.911
U-Net 0.617 0.111 0.322 0.848 0.872 0.919 0.924 0.976 0.983 0.973
Figure 7: Semitransparent scatter plots of individual test slides with the U-Net detector in red and the CMDN detector in
blue. As obvious from slides 3,4 and 5, the CMDN detector tends to overestimate the mitotic count especially in slides with
borderline specimen.
Field of Interest Proposal for Augmented Mitotic Cell Count: Comparison of Two Convolutional Networks
35

5 DISCUSSION
We demonstrated that, while the general problem of
identifying mitotic figures in whole slide images with
high accuracy, is still far from being achieved, the
outcomes of mitosis detection approaches might well
serve as an intermediate step. In preselecting the field
of interest containing the highest mitotic figure den-
sity, the algorithm can help the pathologist in deter-
mining the area of the tumor where the proliferation
is the highest. Hence, we expect that such approaches
can lead to a more reproducible grading and thus po-
tentially better tailored treatment of the patient.
The most crucial slides for the approach are slides
3 to 5, as also shown in Fig. 6(a) to 6(c). Because
the mitotic figure distribution in these slides is rather
patchy i.e. with strong regional differences (see also
Fig. 4 for absolute numbers) an arbitrary selection is
likely to not yield the area with highest mitotic count,
and thus the grading is subject to a possible strong
variance. For all of these cases, both approaches were
well able to pick an area with very high mitotic ac-
tivity, with only minor differences in performance.
The U-Net approach, while leading to a considerably
higher correlation coefficient on the overall data set,
did not lead to a significantly better overall perfor-
mance.
Our approach did not employ stain normalization
methods, as done in the majority of recent mitosis de-
tection approaches (Veta et al., 2018). This was done
in part, because the staining quality of our dataset is
relatively stable due to the usage of a tissue stainer
(ST5010 Autostainer XL, Leica, Germany) and all
slides being created and scanned in the same lab. Ad-
ditionally, we assume that with the high number of
included WSI in the present study, natural variance of
stain becomes less relavant. For application of this
approach on another (possibly smaller) data set, how-
ever, we would recommend investigating a positive
influence of such methods.
It is important to state that the results of this work
were achieved on a limited test data set for canine
mast cell tumors. While, theoretically, we would not
assume different performance on different tumors, tis-
sues or species, this should certainly be investigated.
Another important question is to what degree the im-
proved stability of region proposal, as shown in this
work, would lead to a lower inter-rater-variability in
grading, which we aim to deal with in future work.
REFERENCES
Aubreville, M., Bertram, C., Klopfleisch, R., and Maier, A.
(2018a). SlideRunner - A Tool for Massive Cell Anno-
tations in Whole Slide Images. In Maier, A., Deserno,
T. M., Handels, H., Maier-Hein, K. H., Palm, C., and
Tolxdorff, T., editors, Bildverarbeitung f
¨
ur die Medi-
zin 2018. Proceedings des Workshops vom 11. bis 13.
M
¨
arz 2018 in Erlangen, pages 309–314.
Aubreville, M., Bertram, C. A., Klopfleisch, R., and Maier,
A. (2018b). Augmented mitotic cell count using field
of interest proposal. Bildverarbeitung f
¨
ur die Medizin
2019 (accepted), arXiv:1810.00850.
Baak, J. P. A., Gudlaugsson, E., Skaland, I., Guo, L.
H. R., Klos, J., Lende, T. H., Søiland, H., Janssen, E.
A. M., and zur Hausen, A. (2008). Proliferation is the
strongest prognosticator in node-negative breast can-
cer: significance, error sources, alternatives and com-
parison with molecular prognostic markers. Breast
Cancer Research and Treatment, 115(2):241–254.
Boiesen, P., Bendahl, P. O., Anagnostaki, L., Domanski,
H., Holm, E., Idvall, I., Johansson, S., Ljungberg, O.,
Ringberg, A.,
¨
Ostberg, G., and Fern
¨
o, M. (2000). His-
tologic grading in breast cancer: reproducibility be-
tween seven pathologic departments. Acta Oncolog-
ica, 39(1):41–45.
Bonert, M. and Tate, A. J. (2017). Mitotic counts in breast
cancer should be standardized with a uniform sample
area. BioMedical Engineering OnLine, 16(1):28.
Breininger, K., Albarqouni, S., Kurzendorfer, T., Pfister,
M., Kowarschik, M., and Maier, A. K. (2018). Intra-
operative stent segmentation in X-ray fluoroscopy for
endovascular aortic repair. Int. J. Computer Assisted
Radiology and Surgery.
Chen, S., Roth, H., Dorn, S., May, M., Cavallaro, A., Lell,
M., Kachelrie
¨
s, M., Oda, H., Mori, K., and Maier, A.
(2018). Towards Automatic Abdominal Multi-Organ
Segmentation in Dual Energy CT using Cascaded 3D
Fully Convolutional Network. In Noo, F., editor, the
fifth edition of The International Conference on Im-
age Formation in X-ray Computed Tomography, pages
395–398.
Cires¸an, D. C., Giusti, A., Gambardella, L. M., and Schmid-
huber, J. (2013). Mitosis detection in breast can-
cer histology images with deep neural networks. In-
ternational Conference on Medical Image Computing
and Computer-Assisted Intervention (MICCAI), 16(Pt
2):411–418.
Edmondson, E. F., Hess, A. M., and Powers, B. E. (2014).
Prognostic Significance of Histologic Features in Ca-
nine Renal Cell Carcinomas. Veterinary Pathology,
52(2):260–268.
Elston, C. W. and Ellis, I. O. (1991). Pathological prog-
nostic factors in breast cancer. i. the value of his-
tological grade in breast cancer: experience from a
large study with long-term follow-up. Histopathology,
19(5):403–410.
Horobin, R. W. (1969). The impurities of biological dyes:
their detection, removal, occurrence and histological
significance? A review. The Histochemical Journal,
1(3):231–265.
BIOIMAGING 2019 - 6th International Conference on Bioimaging
36

Kayalibay, B., Jensen, G., and van der Smagt, P. (2017).
Cnn-based segmentation of medical imaging data.
arXiv preprint arXiv:1701.03056.
Kingma, D. P. and Ba, J. (2014). Adam: A method for
stochastic optimization.
Li, C., Wang, X., Liu, W., and Latecki, L. J. (2018). Deep-
Mitosis: Mitosis detection via deep detection, veri-
fication and segmentation networks. Medical Image
Analysis, 45:121–133.
Martin, A. R., Weisenburger, D. D., Chan, W. C., Ruby,
E. I., Anderson, J. R., Vose, J. M., Bierman, P. J., Bast,
M. A., Daley, D. T., and Armitage, J. O. (1995). Prog-
nostic value of cellular proliferation and histologic
grade in follicular lymphoma. Blood, 85(12):3671–
3678.
Meuten, D. J., Moore, F. M., and George, J. W. (2016). Mi-
totic Count and the Field of View Area. Veterinary
Pathology, 53(1):7–9.
Otsu, N. (1979). A Threshold Selection Method from Gray-
Level Histograms. IEEE Transactions on Systems,
Man, and Cybernetics, 9(1):62–66.
Rahman, M. A. and Wang, Y. (2016). Optimizing
intersection-over-union in deep neural networks for
image segmentation. In International Symposium on
Visual Computing, pages 234–244. Springer.
Ronneberger, O., Fischer, P., and Brox, T. (2015). U-Net
- Convolutional Networks for Biomedical Image Seg-
mentation. International Conference on Medical Im-
age Computing and Computer-Assisted Intervention
(MICCAI), 9351(Chapter 28):234–241.
Roux, L., Racoceanu, D., Lom
´
enie, N., Kulikova, M.,
Irshad, H., Klossa, J., Capron, F., Genestie, C.,
Le Naour, G., and Gurcan, M. N. (2013). Mitosis de-
tection in breast cancer histological images An ICPR
2012 contest. Journal of pathology informatics, 4:8.
Van Diest, P. J., Baak, J. P. A., Matze-Cok, P., Wisse-
Brekelmans, E. C. M., van Galen, C. M., Kurver, P.
H. J., Bellot, S. M., Fijnheer, J., van Gorp, L. H. M.,
Kwee, W. S., Los, J., Peterse, J. L., Ruitenberg, H. M.,
Schapers, R. F. M., Schipper, M. E. I., Somsen, J. G.,
Willig, A. W. P. M., and Ariens, A. T. (1992). Repro-
ducibility of mitosis counting in 2,469 breast cancer
specimens: Results from the Multicenter Morphome-
tric Mammary Carcinoma Project. Human Pathology,
23(6):603–607.
Veta, M., Heng, Y. J., Stathonikos, N., Bejnordi, B. E.,
Beca, F., Wollmann, T., Rohr, K., Shah, M. A., Wang,
D., Rousson, M., et al. (2018). Predicting breast tumor
proliferation from whole-slide images: the tupac16
challenge. arXiv preprint arXiv:1807.08284.
Veta, M., van Diest, P. J., Willems, S. M., Wang, H., Mad-
abhushi, A., Cruz-Roa, A., Gonzalez, F., Larsen, A.
B. L., Vestergaard, J. S., Dahl, A. B., Cires¸an, D. C.,
Schmidhuber, J., Giusti, A., Gambardella, L. M.,
Tek, F. B., Walter, T., Wang, C.-W., Kondo, S., Ma-
tuszewski, B. J., Precioso, F., Snell, V., Kittler, J.,
de Campos, T. E., Khan, A. M., Rajpoot, N. M.,
Arkoumani, E., Lacle, M. M., Viergever, M. A., and
Pluim, J. P. W. (2015). Assessment of algorithms for
mitosis detection in breast cancer histopathology im-
ages. Medical Image Analysis, 20(1):237–248.
Field of Interest Proposal for Augmented Mitotic Cell Count: Comparison of Two Convolutional Networks
37
