
Thermal Comfort and Stress Recognition in Office Environment
Kizito Nkurikiyeyezu, Kana Shoji, Anna Yokokubo and Guillaume Lopez
Graduate School of Science and Engineering, Aoyama Gakuin University,
Keywords:
Personalized Thermal Comfort, Work Stress, Heart Rate Variability, Smart Buildings, Humanized Computing,
Affective Computing.
Abstract:
Work stress and thermal discomfort are some of the hurdles that office workers face every day. Office workers
experience a periodic work stress because work is long and mentally challenging. At the same time, current
thermal comfort provision technologies are inefficient and consume a large amount of energy. In our previ-
ous works, we proposed an efficient thermal comfort provision system that is based on a person
'
s heart rate
variability (HRV). However, because work stress can also affect the person
'
s HRV, this paper investigates the
possibility to distinguish HRV changes that are due to thermal discomfort from changes that emanate from
work stress. We conducted experiments on subjects taking Advanced Trail Making Test (ATMT) and observed
that stress alters HRV and that it is possible to distinguish stressed and non-stressed subjects with a 100%
accuracy. We validated our method on the multimodal SWELL knowledge work (SWELL-KW) stress dataset
and achieved similar results (99.25% accuracy and 99.75% average recall). Further analysis suggests that,
although both thermal comfort and work stress affect HRV, their effect is perhaps non-overlapping, and that
the two can be distinguished with a near-perfect accuracy. These results indicate that it could be possible to
design an automatic and unobtrusive system that delivers thermal comfort and predicts work stress based on
people's HRV
1 INTRODUCTION
Stress and the dissatisfaction in thermal comfort are
among the biggest challenges in modern workplaces.
In Europe, it is estimated that stress affects half of
the workers, is responsible for half of all lost work-
ing days, is the second reason for most work-related
health problems and causes significant losses to busi-
nesses due to absenteeism and high employee turnover
(EU-OSHA, 2017). As for thermal comfort dissatisfac-
tion, although thermal comfort has been actively stud-
ied for almost a century, currently, its provision mech-
anisms are based on fundamentally flawed assump-
tions, achieve a lackluster performance and require an
excessive energy to operate (Nicol and Roaf, 2017;
Brager et al., 2015). Indeed, thermal comfort is de-
fined as “the condition of mind that expresses satisfac-
tion with the thermal environment and is assessed by
subjective evaluation” (ANSI/ASHRAE, 2013). Thus,
it is a personal psychological sensation. On the con-
trary, HVAC systems are based on heat and energy
transfer principles; thus, can only influence the per-
son
'
s thermal comfort. However, they fail to account
for the complexity and the dynamics of people
'
s ther-
moregulation and cannot assess the satisfaction of the
provided thermal comfort. Further, they ignore some
important precursors to thermal comfort such as peo-
ple
'
s psychophysics, their genders, their thermal adap-
tation, their physiological makeup, and their age dif-
ferences. Consequently, prominent researchers have
urged a paradigm shift in the way thermal comfort is
provided (Nicol and Roaf, 2017; Brager et al., 2015).
Unfortunately, in the future, if nothing is done to
deal with the above issues, work-related stress and
thermal discomfort can only increase. On one hand,
modern workplaces require stressful, high workload
and long working hours. On the other hand, recently,
there are policies to curtail agents of anthropogenic cli-
mate change that impose, inter-alia, strict reductions
in energy use in buildings. These policies, given the
limitations of current thermal comfort provision tech-
nologies, can only aggravate the level of thermal dis-
comfort in offices. Hence, this dilemma entails alterna-
tive thermal comfort delivery mechanisms that provide
higher quality thermal comfort at lower energy.
In our previous works (Nkurikiyeyezu et al., 2017),
we proposed to provide thermal comfort based on a
person
'
s physiological changes due to their surround-
256
Nkurikiyeyezu, K., Shoji, K., Yokokubo, A. and Lopez, G.
Thermal Comfort and Stress Recognition in Office Environment.
DOI: 10.5220/0007368802560263
In Proceedings of the 12th International Joint Conference on Biomedical Engineering Systems and Technologies (BIOSTEC 2019), pages 256-263
ISBN: 978-989-758-353-7
Copyright
c
2019 by SCITEPRESS – Science and Technology Publications, Lda. All rights reserved
ing thermal environment and discussed the benefits
and approaches to designing a personalized, real-time
and energy efficient thermal comfort delivery appara-
tus that is based on the person’s estimated thermal
comfort sensation (Nkurikiyeyezu et al., 2018). Our
system (Lopez et al., 2018; Nkurikiyeyezu and Lopez,
2018) consists of an unobtrusive wrist-wearable de-
vice that records a person’s photoplethysmogram
(PPG) signal. The person’s heart rate variability (HRV)
is calculated from the PPG signal and is used to pre-
dict, in real-time, the person’s thermal comfort with an
accuracy greater than 90%. There were, however, con-
cerns about the system
'
s performance in real-world set-
tings. Certainly, HRV can change dues to other reasons
including physiological, pathological, neuropsycho-
logical, lifestyle factors, and, most importantly, stress
(Kim et al., 2018). This is because both thermal com-
fort and stress are regulated via a complementary ac-
tion of the sympathetic nervous system (SNS) and the
parasympathetic nervous system (PSN). Succinctly,
when the brain perceives a danger, the SNS ushers
a release of hormones to prepare the body to swiftly
react to life-threatening situations (for example, faster
heartbeat and an increase in airways for easier breath-
ing) and inhibits some non-urgent physiological needs
(e.g., digestion and sexual arousal). When the per-
ceived danger finally recedes, the PSN restores the
normal hormonal balance (Harvard Health, 2011). In
the case of thermal comfort, the brain’s hypothala-
mus serves as a “thermostat” of the body (Figure 1).
In a nutshell, the hypothalamus receives sensory in-
puts from thermo-receptors located in the skin, liver
and skeletal muscles and initiate appropriate processes
to keep constant the body
'
s core temperature. For
instance, when it is hot, the hypothalamus activates
heat dissipating and body cooling mechanisms such as
sweating and vasodilation. Conversely, when it is cold,
the hypothalamus activates thermogenesis mechanism
(e.g., shivering in skeletal muscle and heat generation
in brown adipose tissues) and other mechanisms to re-
duce heat dissipation (e.g.,cutaneous vasoconstriction
and piloerection) (Morrison, 2011). The human ther-
moregulation can be indirectly monitored via e.g., the
person’s heart rate variability (HRV). There is indeed
evidence that the very-low-frequency (VLF) band of
the HRV power spectra mirrors thermoregulatory vaso-
motor control activities (Thayer et al., 1997) and that
thermal discomfort generally alters heartbeat patterns
(Liu et al., 2008). Likewise, when in a stressful situa-
tion, the brain’s amygdala decodes the stress and sends
an appropriate message to the hypothalamus. The hy-
pothalamus, in turn, facilitates the release of hormones
such as adrenaline in the blood; thus, increases the per-
son’s heart rhythms, his respiration rate, his blood pres-
sure, and his pulse rate. Due to this hormonal changes,
the person becomes alert, his hearing and sight be-
come sharper and his blood sugar increases (Harvard
Health, 2011). The PNS restores this hormonal imbal-
ance when the stressor abates. However, if the stressor
persists for a long time, the hypothalamus keeps the
person on an enduring high alert by activating the cen-
tral stress response system —the hypothalamic pitu-
itary adrenal (HPA) axis —which releases cortisol, a
well-known biomarker of chronic stress (Schulz et al.,
1998).
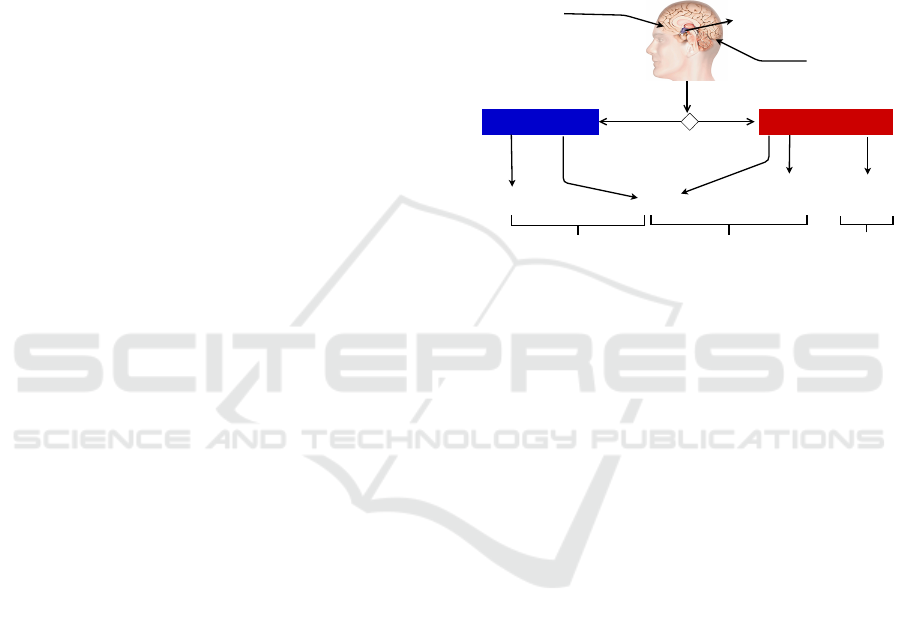
Hypothalamus
Central
thermoreceptors
Peripheral
thermoreceptors
[Cold][Hot]
Thermal comfort decision
Temperature reduction
mechanisms
Temperature generation
mechanisms
Sweat glands
Vascular smooth
muscles
Brown adipose
tissues
Somatic
muscles
Transpiration VasodilatationVasoconstriction Heat production Shiver
Cholinergic neurons of the
sympathetic nervous system
Noradrenergic neurons of the
sympathetic nervous system
Somatic motor
neurons
Figure 1: A simplified process of human thermal regulation
—the hypothalamus checks the body’s core temperature and
starts necessary thermogenesis or heat dissipating processes
to maintain the core temperature [adapted from (Wikilivres,
2018)].
Over the past decade, there have been numerous
attempts to automate stress recognition. (Lopez et al.,
2014) developed an adaptive method that uses phys-
iological indices integrated into an intelligent multi-
steps discrimination process to predict stress occur-
rence and other workplace stress type. Their meth-
ods predicts workplace stress type with an accuracy
of 64%. In their review article, Alberdi and his coau-
thors (Alberdi et al., 2016) discuss various modalities
for stress recognition. They further propose a frame-
work for an automatic stress recognition system that
records a person’s physiological signals (e.g., elec-
troencephalogram (EEG), electrocardiography (ECG),
blood volume pulse(BVP), pupil diameter, eye gaze,
blinking, electrodermal activity (EDA), electromyo-
gram (EMG), respiration, etc..), behavioral (keystroke,
mouse usage, posture, facial expression, speech, mo-
bile phone usage, etc), environmental and contextual
(calendar events, location and ambiance) data to pre-
dict the likelihood of the person’s stress. Koldijk
(Koldijk et al., 2018) analogously used an amalgam
of sensor data (e.g., computer logging, posture, facial
expression and physiological features) and developed
a stress classifier that achieves a 90% accuracy. This is
an important achievement—especially since the stress
prediction was based on data recorded in realistic of-
fice settings. Nevertheless, in their paper, they failed
Thermal Comfort and Stress Recognition in Office Environment
257

to use physiological signal to reliably predict stress;
thus, concluded that physiological reaction to office
stress is not a strong and reliable indicator of stress in
an office setting. However, while it could be possible
to predict stress using a fusion of many sensors data,
this approach raises both practical challenges (e.g.,
multimodal data acquisition, data fusion and, data in-
tegration) and user privacy concerns (e.g., the impli-
cation of user’s computer keystroke logging, video
and speech recording), and, may not be used in real-
world settings because of company-wide computer se-
curity policies or due to international workplace pri-
vacy laws.
This paper aims to address two research questions:
1)
Is it possible to distinguish stressful from non-
stressful situations in a typical workplace using only
a single unobtrusive sensor? and
2)
Is it possible to
distinguish HRV due to thermal distress and that due
to work stress? Concretely, with this paper, we make
the following contributions:
1.
We achieve a 99.25% stress prediction accuracy.
We believe this is the first published work that
achieves such a high stress prediction accuracy.
Further, our approach is based on only the person’s
HRV; thus, it could be possible to detect stress in
workplace using a single unobtrusively sensor (for
example by using a commercial photoplethysmo-
gram (PPG) wrist-worn smart-watch)
2. We show that, although both thermal comfort and
work stress affect HRV, their effect on a person
'
s
HRV is perhaps non-overlapping and that the two
can be distinguished with a 99.25% accuracy,
99.27% precision, and a 99.60% micro-average re-
call.
2 METHODS
2.1 HRV Indices Calculations
HRV indices listed in Table 1 were computed as fol-
lows: First, we extracted an inter-beat interval (IBI)
signal from the peaks of the Electrocardiography
(ECG) of each subject. Then, each HRV index is com-
puted on a 5 minutes IBI array. A new IBI sample is
appended to the IBI array while the oldest IBI sample
is removed from its beginning. The new resulting IBI
array is used to compute the next HRV index. This pro-
cess is repeated until the end of the entire IBI signal.
Unlike other HRV computation methods proposed by
other researchers —which mostly consist of comput-
ing HRV on the whole signal— in our previous studies,
we noticed that this approach allows a more granular,
detailed and accurate study of how each heartbeat in-
fluences the person’s HRV.
2.2 Datasets
The study is based on three datasets described below:
2.2.1 PHRENIC Dataset
The PHRENIC (so named because it aims at under-
standing the mind) is based on an experiment we con-
ducted on 20 subjects. The aim of the experiment
was to study the subjects’ mental fatigue. The sub-
jects were randomly divided into two groups and as-
signed the same number of tasks. Subjects in group A
were told the number of tasks they have to complete,
while subjects in group B were not aware of the exact
number of tasks they will complete. During the ex-
periment, each subject took an advanced trail making
test (ATMT), a neuropsychological test of visual atten-
tion and task switching (Mizuno and Watanabe, 2008).
The objective was to evaluate their performance dur-
ing mental fatigue. We developed an application that
runs on a tablet with a touchscreen. The application
generates a random set of number on the subject’s
tablet’s screen, and the subject is requested to connect
them in sequence as fast as he can. Additionally, the
app logs the subject’s performance on the test. Each
experiment ended when the subject completed all the
assigned tasks. During the experiment, each subject
wore myBeat (Union Tool Co., Ltd), a small (41mm x
35.5mm x 10mm), light (25g) and unobtrusive wear-
able sensor to record the subject’s heartbeats at 1000
Hz. The study reported in this paper was approved by
the Aoyama Gakuin University’s Institutional Ethic
Review Board (No. M1-15, 2015/7/9).
2.2.2 SWELL Dataset
The SWELL knowledge work (SWELL-KW) dataset
was collected by researchers at the Institute for Com-
puting and Information Sciences at Radboud Univer-
sity and is described in details in (Koldijk et al., 2014).
It is a result of experiments conducted on 25 subjects
doing typical office work (for example writing reports,
making presentations, reading e-mail and searching
for information). The subject went through typical
working stressors such as receiving unexpected emails
interruptions and pressure to complete their work on a
tight schedule. The experiment recorded various data
including computer logging, facial expression, body
postures, ECG signal and skin conductance. Each par-
ticipant went through three different working condi-
tions:
HEALTHINF 2019 - 12th International Conference on Health Informatics
258

Table 1: Description of the selected HRV indices.
HRV index Short description Equation/Reference
MEAN_RR Mean of all RR intervals
MEDIAN_RR Median of all RR intervals
SDRR Standard deviation of all interval
RMSSD
Square root of the mean of the sum of the squares of the difference
between adjacent RR intervals
√
∑
N−1
i=1
(RR
i+1
−RR
i
)
2
N−1
SDSD
Standard deviation of all interval of differences between adjacent
RR intervals
SDRR_RMSSD Ratio of SDRR over RMSSD
HR Heart Rate (beats per minute)
pNN25 % of adjacent RR intervals differing by more than 25 ms
∑
N
i=1
|
R
i
−R
i+1
|
>25ms
N−1
pNN50 % of adjacent RR intervals differing by more than 50 ms
∑
N
i=1
|
R
i
−R
i+1
|
>50ms
N−1
SD1 Poincaré plot descriptor of the short-term HRV
q
variance(
RR
i
−RR
i+1
√
2
)
SD2 Poincaré plot descriptor of the long-term HRV
q
variance(
RR
i
+RR
i+1
√
2
)
KURT Kurtosis of all RR intervals
SKEW Skewness of all RR intervals
MEAN_REL_RR Mean of all relative RR intervals see. (Vollmer, 2015)
MEDIAN_REL_RR Median of all relative RR intervals see. (Vollmer, 2015)
SDRR_REL_RR Standard deviation of all relative RR interval see. (Vollmer, 2015)
RMSSD_REL_RR
Square root of the mean of the sum of the squares of the difference
between adjacent relative RR intervals
see. (Vollmer, 2015)
SDSD_REL_RR
Standard deviation of all interval of differences between adjacent
relative RR intervals
see. (Vollmer, 2015)
SDRR_RMSSD_REL Ratio of SDRR_REL over RMSSD_REL
KURT_REL_RR Kurtosis of all relative RR intervals see. (Vollmer, 2015)
SKEW_REL_RR Skewness of all relative RR intervals see. (Vollmer, 2015)
VLF
Very low (0.003Hz - 0.04Hz) frequency band of the HRV power
spectrum
see (Malik et al., 1996)
LF
Low (0.04Hz - 0.15Hz) frequency band of the HRV power spec-
trum
see (Malik et al., 1996)
HF
High (0.15Hz - 0.4Hz) frequency band of the HRV power spec-
trum
see (Malik et al., 1996)
TP Total HRV power spectrum see (Malik et al., 1996)
LF/HF Ratio of LF to HF see (Malik et al., 1996)
HF/LF Ratio of HF to LF see (Malik et al., 1996)
sampen Sample entropy of the RR signal see (Sassi et al., 2015)
higuci Higuchi Fractal Dimension see(Gomes et al., 2017)
1.
no stress: the subjects are allowed to work on the
tasks as long as they needed for a maximum of 45
minutes but they are not aware of the maximum
duration of their tasks.
2.
time pressure: during this time, the time to finish
the task was reduced to 2/3 of the time the partici-
pant took in the “no stress” condition.
3.
interruption: the participants received eight emails
in the middle of their assigned tasks. Some emails
were relevant to their tasks —and the participant
was requested to take specific actions—while oth-
ers were just irrelevant to their tasks.
The experiment lasted for about 3 hours for each sub-
ject. We make available the computed HRV dataset
and it can be used by other researchers to validate our
findings
1
.
2.2.3 COMFORT Dataset
This dataset is a result of our previous work on ther-
mal comfort prediction(Nkurikiyeyezu et al., 2017). In
summary, we recorded ECG signals of 17 subjects in
three different thermal chambers whose thermal set-
tings correspond to cold, a neutral, and a hot sensation
on the American Society of Heating, Refrigerating and
Air-Conditioning Engineers (ASHRAE) thermal sen-
sation scale. The experiment lasted for about 30 min-
utes. From the recorded ECG, we extracted HRV in-
1
The dataset available at https://bit.ly/2RZWJ3Z
Thermal Comfort and Stress Recognition in Office Environment
259

dices that were used to predict the thermal comfort.
2.2.4 Datasets Merging
One of the objectives of the study is to investigate
the possibility to distinguish variation in HRV due to
thermal comfort from that due to work stress. There-
fore, we merged together the three datasets (SWELL,
PHRENIC, COMFORT) to see if the resulting HRV
datasets would allow distinguishing stress from ther-
mal comfort. Generally, there are pitfalls in merging
two datasets that were recorded in different environ-
ments because there could be unknown bias. In our
case, however, because the functionality of the heart
does not depend much on the physical location (as-
suming other variables stay the same) of where the ex-
periment was conducted, we surmised that, unless the
person is both stressed and thermally dis-comfortable,
any momentary aberration in HRV are due to either
work stress or thermal discomfort. We tested this as-
sumption by adding a dataset_id as a control predic-
tion feature to the datasets in order to indicate the
parent dataset of each HRV value before merging the
datasets. This would allow us to probe how much the
model is biased by analyzing how much the dataset_id
contributes to the classification model. This evaluation
was done by comparing dataset_id’s mean decrease in
impurity (MDI) (Equ.1) to that of other features of the
model.
G
k
=
K
∑
k=1
p
k
1 −p
k
(1)
where K is the total number of HRV indices used for
classification and
p
k
the proportion of a single HRV
feature k. After merging the datasets, we obtained two
new datasets:
1.
PHRENIC plus SWELL —dataset resulting from
combining the PHRENIC and the SWELL
datasets. In this case, for the PHRENIC dataset, we
assumed that subjects in group A were under time
pressure and those in group B were not stressed.
2.
SWELL plus PHRENIC plus COMFORT —
dataset resulting from combining the SWELL, the
PHRENIC and the COMFORT dataset
2.2.5 Dataset Re-sampling
The dataset resulting in merging the PHRENIC and
the SWELL dataset and that resulting from merging
the PHRENIC, the SWELL and COMFORT dataset
are inherently unbalanced because they have differ-
ent duration —thus, have different number of samples.
We addressed this issue by oversampling the minority
classes using synthetic minority over-sampling tech-
nique (SMOTE) (Chawla et al., 2002). The new over-
sampled dataset may, however, contain noisy samples.
Thus, it was, in turn, under-sampled using edited near-
est neighbor rule (ENN). The under-sampling consists
in discarding any samples whose class label differs
from at least two of its three nearest samples (Wilson,
1972).
2.3 Machine Learning Models
Each HRV dataset was divided into a training and
a test set. Thereafter, a machine learning model was
trained on a 10-folds cross validation of the training
set, i.e. each of the 10 folds is used to train a random
forest classifier on the remaining 9 folds. We tested
various machine learning classifiers (and their predic-
tion performances were similar) but settled to using
a Decision Jungle (DJ) (Shotton et al., 2013) because
DJ models tend to generalize better and require less
memory; thus, can run on limited computing devices
such as a user’s smart-phone. We evaluated the perfor-
mance of the model by computing its accuracy, preci-
sion, recall and the support of each class.
3 RESULT AND DISCUSSION
We observed that, in general, there is a visible change
in HRV between stressed and relaxed subjects. For ex-
ample, on the PHRENIC dataset, the subjects in group
A (i.e., the one that knew about the task difficulty
ahead of time) took less time to finish their tasks. We
believe these subjects were more in a hurry compared
to those in group B, who did not know the amount of
work they were supposed to do. However, the subjects
in group A made more mistakes compared to those in
group B because, perhaps, they did not take time to
carefully check their answers before submitting their
work. Unsurprisingly, the HRV power spectra distri-
bution of the two groups is also strikingly different
(Fig. 3). In HRV studies, LF and LF/HF ratio are in-
dicators of the sympathetic component of the nervous
system while HF reflects the cardiac parasympathetic
nerve activity (Malik et al., 1996). Overall, subjects in
group A exhibited a higher LF; thus, a higher sympa-
thetic activity compared to those in group B (Fig. 2).
Our findings are congruent with existing research that
showed that LF increases (Kim et al., 2018) and VLF
decreases (Usui and Nishida, 2017) in stressful situa-
tions. Thus, one can conclude that subjects in group A
are more stressed than those in group B.
After applying the trained machine learning mod-
els on the test datasets, we observed that all models per-
HEALTHINF 2019 - 12th International Conference on Health Informatics
260
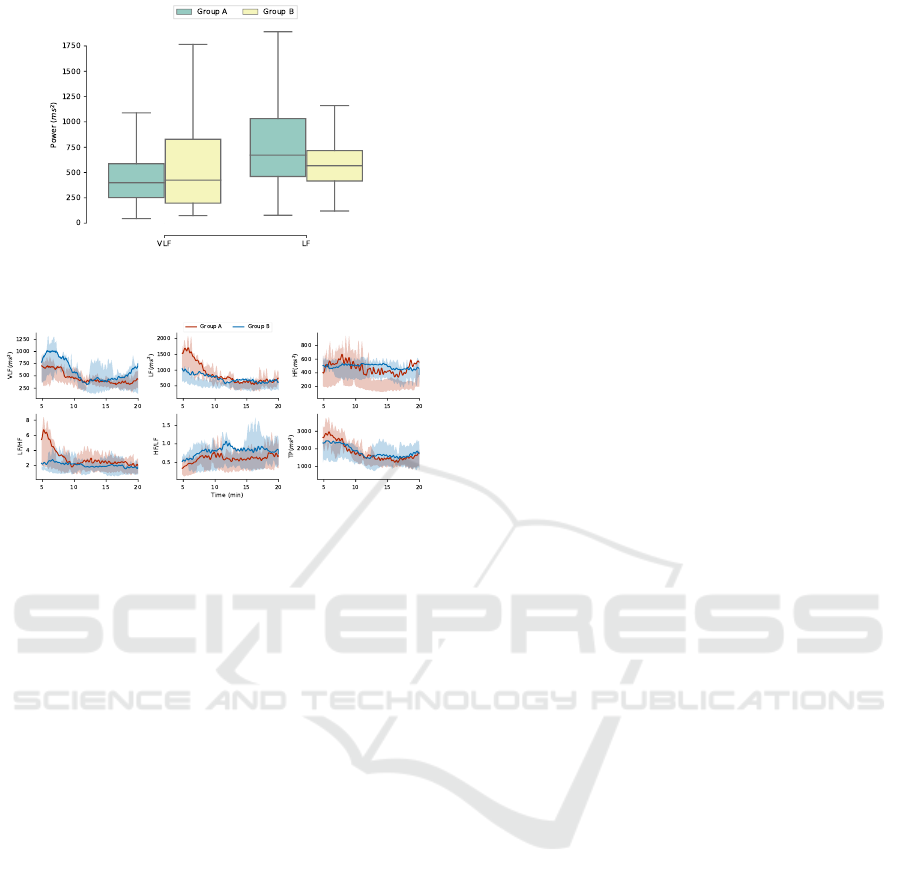
Figure 2: Comparison of LF and VHF component of the
HRV of subjects in groups A and B.
Figure 3: Comparison of spectra HRV between subjects in
groups A and B. The solid line indicates the mean values
while the shaded area represent the data variation ranges
(expressed in terms of the
1
st
and
3
rd
quartile). Subjects
in group A exhibit a higher sympathetic activity (high LF)
while those in group B have a higher stress recovery compo-
nent (higher VLF).
formed well in predicting stress and/or thermal com-
fort (Tables 2). In summary:
•
The stress prediction model on the PHRENIC
dataset achieved a perfect classification accuracy
in distinguishing stressed subjects (group A) and
non-stress subject (group B).
•
The model that predicts the work stress vs non-
stress conditions (i.e., interruption and time pres-
sure vs no stress) achieved a near perfect classifi-
cation both in terms of precision and recall. The
achieved performance is the highest among other
published works, and outperforms, by a large mar-
gin, even sophisticated models that use multimodal
set of sensor data (e.g., (Koldijk et al., 2018)).
•
After merging the PHRENIC and the SWELL
dataset (with the assumption that the subjects in
group A were under “time pressure” and those in
group B were not stressed), the prediction model
achieved equally a good stress prediction accuracy
both in terms of precision and recall. This accu-
racy slightly improves when tested on a model that
was trained on the dataset resulting from the com-
bination of the PHRENIC and SWELL datasets
after being over-sampled using SMOTE and down-
sampled using ENN. Further, after analyzing the
impact of the dataset_id feature that was added to
inspect any bias that might be introduced by merg-
ing the two datasets, we noticed that the dataset_id
has the lowest MDI compared to any HRV fea-
tures. It is 9 lower than that of the highest HRV
feature and 2 times smaller than that of the HRV
feature with next lowest MDI. Thus, we concluded
that there are no significant bias in merging the
SWELL and the PHRENIC datasets.
•
The model trained on the dataset resulting in
merging the PHRENIC, SWELL and COMFORT
datasets also achieved a high accuracy in distin-
guishing thermal comfort (cold, neutral, and hot)
from work stress (no stress, time pressure and
interruption). Nevertheless, there are some mis-
classifications (especially in classifying the “neu-
tral” condition). In this case, we noticed that the
dataset_id’s MDI value is significant. Thus, while
the impact of the dataset_id feature is not the most
decisive stress/comfort prediction attribute, it is
exigent to note that merging the three datasets re-
sulted in some unknown biases, and there is a need
for further studies to elucidate and limit these bi-
ases.
•
The stress/comfort prediction accuracy was notice-
ably improved when using a model trained on the
re-sampled dataset (see section 2.2.5). Notably, it
achieved a near-perfect stress vs. thermal comfort
prediction accuracy both in terms of precision and
recall and the log loss is significantly lower com-
pared to the model that was not sampled. However,
this high prediction performance was achieved at
the cost of a more complex model (a decision
jungle with 50 decision directed acyclic graphs
(DAGs)). Further, this model also suffers from
some dataset merging biases; thus, its performance
should be taken with a grain of salt.
4 CONCLUSION
Modern work culture is stressful and the number of
stressed office workers keeps increasing. At the same
time, current thermal comfort provision methods are
inefficient both in the quality they provide and the
amount of energy they consume. Recent policies to
reduce energy use in buildings can only increase ther-
mal comfort dissatisfaction. In our previous works,
we proposed to provide thermal comfort based on the
person
'
s physiological changes due to his surround-
ing environment. We developed a system that pre-
dicts thermal comfort based on the a person’s HRV.
Thermal Comfort and Stress Recognition in Office Environment
261

Table 2: Stress thermal comfort prediction model performance evaluation.
Dataset name
PHRENIC
α
SWELL
β
PHRENIC
plus SWELL
γ
SWELL plus
PHRENIC
plus COMFORT
δ
SMOTEENN SWELL
plus PHRENIC
plus COMFORT
ζ
overall accuracy 100.00 99.8 99.25 97.28 99.25
average accuracy 100.00 99.86 99.5 99.09 99.75
macro-averaged precision 100.00 99.84 99.31 95.99 99.27
macro-averaged recall 100.00 99.76 99.09 95.49 99.60
α see dataset description in section 2.2.1
β see dataset description in section 2.2.2
γ
the dataset was obtained by combining the SWELL and the PHRENIC
dataset as described in section 2.2.4
δ
the dataset is a combination of the SWELL, PHRENIC and the thermal
comfort datasets as described in section 2.2.4
ζ
an oversampled version of the dataset described in δ above using SMOTEENN method
and noise cleaning using ENN. See detailed explanations in section 2.2.5
There were, however, concerns about its performance
because work stress can also affect HRV. This paper
investigated the possibility to distinguish HRV due to
thermal distress from that due to work stress. The fol-
lowing findings emerged from our study:
•
We predicted stress with a near perfect accuracy
(99.25% accuracy and 99.5% recall)
•
Although both thermal comfort and work stress af-
fect HRV, we surmise that, in an office environ-
ment, unless a person is both stressed and ther-
mally dis-comfortable, most ephemeral changes
in HRV are due to either work stress or thermal
discomfort. Although we believe there are biases
in our models, it is possible to differentiate stress-
ful working conditions (interruption and time pres-
sure) from non-stressful ones with a high accuracy
(99.25% accuracy and 99.75% average recall).
•
Our result suggests that it could be possible to de-
sign an unobtrusive system that delivers thermal
comfort and predicts work stress based on people
'
s
variation in their HRV. The system may predict a
person
'
s stress and thermal comfort from his pho-
toplethysmogram (PPG) signal recorded using an
unobtrusive wristband device. In the case of ther-
mal comfort, thermal comfort/energy constrained
optimization algorithms could be used to control
the most suitable thermal comfort provision mech-
anism in order to achieve a optimum thermal com-
fort at lowest energy consumption. Further, the
person’s stress level is continuously monitored
and the system could give adequate stress reduc-
tion recommendations. A practical system, how-
ever, needs further improvements. For example,
our approach does not address situations in which
a person is stressed and thermally dis-comfortable
and it fails to address other potential factors that
can affect a person’s HRV (e.g., anger, anxiety,
fear, sadness, sickness, happiness, etc ...). Further,
a generic, one-size-fits-all model may not work in
a real-world office environment because of individ-
ual differences that should not be ignored (Koldijk
et al., 2018). Instead, a personalized system could
be considered since people have different physi-
ologies. A generic model could only be used as a
baseline that must be further tweaked to satisfy the
uniqueness of each office worker.
REFERENCES
Alberdi, A., Aztiria, A., and Basarab, A. (2016). Towards
an automatic early stress recognition system for office
environments based on multimodal measurements: A
review. J. Biomed. Inform., 59:49–75.
ANSI/ASHRAE (2013). Thermal environmental conditions
for human occupancy standard 55-2013. Ashrae.
Brager, G. S., Zhang, H., and Arens, E. (2015). Evolving
opportunities for providing thermal comfort. Build.
Res. Inf., 43(3):274–287.
Chawla, N. V., Bowyer, K. W., Hall, L. O., and Kegelmeyer,
W. P. (2002). Smote: Synthetic minority over-sampling
technique. J. Artif. Intell. Res., 16:321–357.
EU-OSHA (2017). Psychosocial risks and stress at work -
safety and health at work.
Gomes, R. L., Vanderlei, L. C. M., Garner, D. M., Vanderlei,
F. M., and Valenti, V. E. (2017). Higuchi fractal analy-
sis of heart rate variability is sensitive during recovery
from exercise in physically active men. Med. Express,
4(3):1–8.
Harvard Health (2011). Understanding the stress response.
Kim, H.-g., Cheon, E.-j., Bai, D.-s., Lee, Y. H., and Koo, B.-
h. (2018). Stress and heart rate variability: A meta-
analysis and review of the literature. Psychiatry Inves-
tig., 15(3):235–245.
Koldijk, S., Neerincx, M. A., and Kraaij, W. (2018). Detect-
ing work stress in offices by combining unobtrusive
sensors. IEEE Trans. Affect. Comput., 9(2):227–239.
Koldijk, S., Sappelli, M., Verberne, S., Neerincx, M. A., and
Kraaij, W. (2014). The swell knowledge work dataset
HEALTHINF 2019 - 12th International Conference on Health Informatics
262

for stress and user modeling research. Proc. 16th Int.
Conf. Multimodal Interact. - ICMI ’14, pages 291–298.
Liu, W., Lian, Z., and Liu, Y. (2008). Heart rate variability at
different thermal comfort levels. Eur. J. Appl. Physiol.,
103(3):361–366.
Lopez, G., Ide, H., Shuzo, M., Warisawa, S., and Yamada,
I. (2014). Workplace stress estimation from physio-
logical indices in real situation. In Lect. Notes Inst.
Comput. Sci. Soc. Telecommun. Eng. LNICST, volume
100, pages 13–22. Springer International Publishing.
Lopez, G., Takahashi, K., Nkurikiyeyezu, K., and Yokokubo,
A. (2018). Development of a Wearable Thermo-
Conditioning Device Controlled by Human Factors
Based Thermal Comfort Estimation. In 2018 12th
France-Japan and 10th Europe-Asia Congress on
Mechatronics, pages 255–259. IEEE.
Malik, M., Bigger, J. T., Camm, A. J., Kleiger, R. E.,
Malliani, A., Moss, A. J., and Schwartz, P. J. (1996).
Heart rate variability: Standards of measurement, phys-
iological interpretation, and clinical use. Eur. Heart J.,
17(3):354–381.
Mizuno, K. and Watanabe, Y. (2008). Utility of an advanced
trail making test as a neuropsychological tool for an
objective evaluation of work effi ciency during mental
fatigue. Fatigue Sci. Hum. Heal., pages 47–54.
Morrison, S. F. (2011). Central neural pathways for ther-
moregulation. Front. Biosci., 16(1):74.
Nicol, J. F. and Roaf, S. (2017). Rethinking thermal comfort.
Build. Res. Inf., 45(7):1–5.
Nkurikiyeyezu, K. and Lopez, G. (2018). Toward a real-
time and physiologically controlled thermal comfort
provision in office buildings. In Intell. Environ., pages
168–177. IOS Press.
Nkurikiyeyezu, K., Suzuki, Y., Maret, P., Lopez, G., and Itao,
K. (2018). Conceptual design of a collective energy-
effi cient physiologically-controlled system for ther-
mal comfort delivery in an o ffi ce environment. SICE
J. Control. Meas. Syst. Integr., 11(4):1–9.
Nkurikiyeyezu, K. N., Suzuki, Y., and Lopez, G. F. (2017).
Heart rate variability as a predictive biomarker of ther-
mal comfort. J. Ambient Intell. Humaniz. Comput.,
pages 1–13.
Sassi, R., Cerutti, S., Lombardi, F., Malik, M., Huikuri, H. V.,
Peng, C. K., Schmidt, G., and Yamamoto, Y. (2015).
Advances in heart rate variability signal analysis: Joint
position statement by the e-Cardiology ESC Working
Group and the European Heart Rhythm Association
co-endorsed by the Asia Pacific Heart Rhythm Society.
Europace, 17(9):1341–1353.
Schulz, P., Kirschbaum, C., Prüßner, J., and Hellhammer, D.
(1998). Increased free cortisol secretion after awak-
ening in chronically stressed individuals due to work
overload. Stress Med., 14(2):91–97.
Shotton, J., Sharp, T., Kohli, P., Nowozin, S., Winn, J., and
Criminisi, A. (2013). Decision jungles: Compact and
rich models for classification. Adv. Neural Inf. Process.
Syst. 26, pages 234–242.
Thayer, J. F., Nabors-Oberg, R., and Sollers, J. J. (1997).
Thermoregulation and cardiac variability: a time-
frequency analysis. Biomed. Sci. Instrum., 34:252–6.
Usui, H. and Nishida, Y. (2017). The very low-frequency
band of heart rate variability represents the slow recov-
ery component after a mental stress task. PLoS One,
12(8):1–9.
Vollmer, M. (2015). A robust, simple and reliable measure
of heart rate variability using relative rr intervals. In
2015 Comput. Cardiol. Conf., volume 42, pages 609–
612. IEEE.
Wikilivres (2018). Neurosciences/La thermorégulation —
Wikilivres.
Wilson, D. L. (1972). Asymptotic properties of nearest
neighbor rules using edited data. IEEE Trans. Syst.
Man Cybern., 2(3):408–421.
Thermal Comfort and Stress Recognition in Office Environment
263
