
Land Use Land Cover Classification
from Satellite Imagery using
mUnet: A Modified Unet Architecture
Lakshya Garg
1
, Parul Shukla
2
, Sandeep Kumar Singh
2
, Vaishangi Bajpai
2
and Utkarsh Yadav
2
1
Electrical and Electronics Engineering, Delhi Technological University (DTU), Delhi, India
2
Strategic Operations and Research, RMSI Pvt Ltd Noida, Delhi, India
utkarsh.yadav@india.rmsi.com
Keywords:
Satellite Imagery, Land-use-classification, Convolutional Networks, Remote Sensing, Deep Learning.
Abstract:
Land-use-land-cover classification(LULC) is used to automate the process of providing labels, describing
the physical land type to represent how a land area is being used. Many sectors such as telecom, utility,
hydrology etc need land use and land cover information from remote sensing images. This information pro-
vides an insight into the type of geographical distribution of a region with providing low level features such
as amount of vegetation, building area, and geometry etc as well as higher level concepts such as land use
classes. This information is particularly useful for resource-starved rapidly developing cities for urban plan-
ning and resource management. LULC also provides historical changes in land-use patterns over a period
of time. In this paper, we analyze patterns of land use in urban and rural neighborhoods using high reso-
lution satellite imagery, utilizing a state of the art deep convolutional neural network. The proposed LULC
network, termed as mUnet is based on an encoder-decoder convolutional architecture for pixel-level semantic
segmentation. We test our approach on 3 band, FCC satellite imagery covering 225 km
2
area of Karachi.
Experimental results show the superiority of our proposed network architecture vis-
`
a-vis other state of the art
networks.
1 INTRODUCTION
Recent advancements in remote sensing have re-
sulted in easy accessibility of satellite imagery of
Earth. Among many applications of satellite ima-
gery, Land-use-land-cover (LULC) forms an in-
tegral part. LULC plays a pivotal role in ur-
ban planning, land resource management and pro-
vides a useful insight into the growth rate indexes
of different population spectrum. LULC models
also highlight the historical changes in an area by
quantitatively showcasing the changes in habita-
tion, vegetation, water areas over a span of years.
Recent breakthroughs in deep learning have resul-
ted in LULC’s application to various new versa-
tile domains such as development of smart cities,
urban planning, environmental monitoring and di-
saster recovery. The remote sensing community
benefited the most with the use of deep convo-
lutional neural networks for various tasks such as
automatic feature extraction for classifying road,
building footprints, grasslands etc (Mnih, 2013).
Land use classification refers to the consolidation of
physical land attributes defining a region and what
the cultural and socio-economic function that the land
serves. In this paper, we address LULC classification
by modifying the Unet (Ronneberger et al., 2015) ar-
chitecture for pixel level segmentation. The propo-
sed model is henceforth referred to as mUnet. mUnet
consists of a ladder-like structure consisting of con-
volutional encoder layers followed by a series of de-
coding convolutional layers. Our method has the fol-
lowing advantages as compared to the traditional seg-
mentation methods.
• mUnet provides classification at pixel level.
• mUnet consists of less number of trainable para-
meters as compared to original Unet.
• mUnet outperforms other state of the art segmen-
tation architectures.
Our paper consist of the following sections: In
section-II we review the studies which adopt deep
learning methods to the problem of land-use-
classification. In section-III, we present the dataset
Garg, L., Shukla, P., Singh, S., Bajpai, V. and Yadav, U.
Land Use Land Cover Classification from Satellite Imagery using mUnet: A Modified Unet Architecture.
DOI: 10.5220/0007370603590365
In Proceedings of the 14th International Joint Conference on Computer Vision, Imaging and Computer Graphics Theory and Applications (VISIGRAPP 2019), pages 359-365
ISBN: 978-989-758-354-4
Copyright
c
2019 by SCITEPRESS – Science and Technology Publications, Lda. All rights reserved
359

curated. In Section-IV, we examine the proposed met-
hodology including network architecture and training
details. In section-V we showcase our results and fin-
dings henceforth followed by a conclusion in section-
VI.
2 RELATED WORK
The literature on land-use-land-cover classification
can be broadly classified into two categories: patch-
based and pixel-based methods. Patch-based ap-
proach (Papadomanolaki et al., 2016) (Albert et al.,
2017) (Tong et al., 2018) is based on predicting la-
bels for an image-patch whereas pixel-based appro-
ach (Kussul et al., 2017) (Torres et al., 2017) the la-
bels are predicted for each underlying pixel of the
image. Patch-based approaches are primarily based
on neural-networks such as VGG (Deng et al., 2009),
ResNet (He et al., 2016), AlexNet (Krizhevsky et al.,
2012) for classifying the image. Pixel-based approa-
ches on the other hand use Deep convolutional Neural
nets combined with many up-sampling layers in order
to accomplish semantic segmentation of images in an
end to end manner.
2.1 Patch-based-Approach
Papadomanolaki et al (Papadomanolaki et al., 2016)
evaluated deep learning frameworks based on convo-
lutional neural networks for the accurate classification
of spectral remote sensing data. A patch-based appro-
ach was utilized with a patch size of 28 28 pixels,
consisting of 4 and 6 band images. The publicly avai-
lable data of SAT-4 and SAT-6 images were utilized to
fine tune the three different models Alexnet (Krizhev-
sky et al., 2012), Alexnet-small(Iandola et al., 2016),
VGG(Deng et al., 2009). SAT-4 images were clas-
sified into four different classes (barren land, trees,
grassland, water bodies) while SAT-6 consisted of 6
different classes (barren land, trees, grasslands, road,
buildings and water bodies). Similarly Albert et al
(Albert et al., 2017) utilized a pre-trained Resnet (He
et al., 2016) and VGG-16 (Deng et al., 2009) to clas-
sify patches into 10 predefined classes (water, airport,
sports and leisure, low, medium, high density urban,
green urban, forest, agriculture). Google maps ima-
gery was utilized to train the networks and the data
were taken across six European countries. A patch
size of 224 224 3, 1.2m/px was given as input to
the model. Xin-Yi et al (Tong et al., 2018) utilized
a Patch-based CNN classification using a re-trained
Resnet-50 network. The network had a total of 49
convolution layers, consisting of 16 bottleneck struc-
tures. 50 Gaofen-2 imagery of 1m/px resolution were
used to train the network. The original images were
divided into patches of 256 256 and 512 512 patches
respectively and were given as input to the model.
It may be noted that misclassification is high in case
of patch-based approach. Patch-based approach clas-
sifies an entire patch as a single label which may be
incorrect if the patch consists of pixels belonging to
other classes as well
2.2 Pixel-based-Approach
Pixel based approach mitigates the limi-
tations of patch-based approach by pre-
dicting labels for each pixel in an image,
thus reducing the misclassification rate.
Kussul et al (Kussul et al., 2017) used unsuper-
vised neural network techniques on hyper-spectral
imagery. The authors used 1D and 2D CNN ensem-
ble. 1D CNN ensemble looked across the pixel values
along the spectral domain, while the 2D network
architecture performed the spatial convolutions.
Dataset used was a multi temporal, multi-Source
data of the Kyiv region acquired from Landsat-8
and Sentinel 1-A. Eleven pre-distinguished classes
were defined to classify the temporal bounds of the
image. The authors use an unsupervised learning
approach which inherently requires a large amount
of training data. Torres et al (Torres et al., 2017)
utilized a supervised learning approach, which
involves training a fully convolutional neural (FCN)
network in order to perform LULC classification at
pixel-level on Dar Es Salaam dataset. The Images
were broken down into 440 440 pixel tiles and
then classified into 10 pre-defined classes. The
authors used a FCN network which consist of an
encoder architecture followed by a final up-sampling
layer succeeded by a classifier, however it has
been found that an encoder followed by a decoder
which consists of trainable convolutional layers
performs better in segmentation tasks (Ronneberger
et al., 2015). Additionally, (Torres et al., 2017)
(Kussul et al., 2017) used low resolution satellite
imagery (30m/px, 10m/px) for LULC classification.
In this paper we propose an encoder-decoder archi-
tecture for LULC classification on a high resolution
satellite imagery (2m/px).
3 DATASET USED
Data used for training the network is Resourcesat
2 Satellite imagery of Karachi covering 225 km
2
.
LISS IV merged with Cartosat Satellite imagery was
VISAPP 2019 - 14th International Conference on Computer Vision Theory and Applications
360

used in the study because of its finer spatial reso-
lution than other commonly used images such as
Multi-Spectral Scanner (MSS). Figure 5 shows the
full-scene FCC (false color composite) satellite ima-
gery (7506 columns, 7475 rows). The 3 band ima-
gery was acquired from National Remote Sensing
Agency, Department of Space, Government of In-
dia. The image quality was rather good with relati-
vely no cloud cover over the study area. The images
have a spatial resolution of 2 m and 8 bit pixel depth.
In this paper four classes are considered for Land use
land cover classification, namely Habitation, Vegeta-
tion, Open and water. The training data is prepared for
26 km
2
and prediction is done over a complete study
area covering 225 km
2
of Karachi. The image pre-
processing and post processing is done using ArcGIS
software.
4 METHODOLOGY
In the following section we detail our proposed ap-
proach.
4.1 Image Pre-processing
The ground truth thematic image consisting of four
land use land cover classes is used as ancillary data
for creating labels and validating as seen in figure 6.
Vectors are generated corresponding to each class by
raster to polygon conversion. These vectors are furt-
her used for preparing training datasets for 26 km
2
area of Karachi. The false color composite (FCC) sa-
tellite imagery is tilled to 36 images of 850 850 pixels
wide and corresponding WKT (well known text) file
is generated by superimposing vectors over the tiles
figure 4 shows the training data labels as binary ima-
ges generated from WKT file. The WKT file con-
tains polygons co-ordinate information corresponding
to each of the four classes and for each of the 36 tiles
used for training.
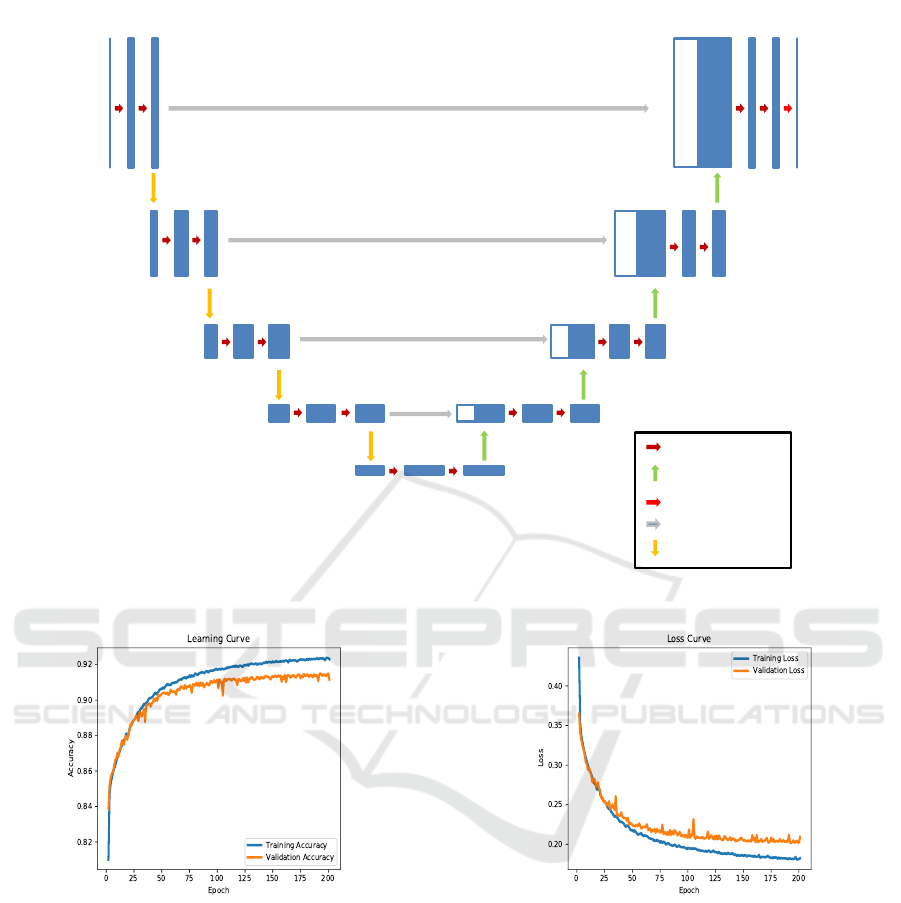
4.2 Network Architecture
We propose a modified encoder-decoder network ba-
sed on the Unet model which was was originally utili-
zed for bio-medical segmentation (Ronneberger et al.,
2015). The structure resembles, as the name signi-
fies, alphabet U. Unet concatenates the encoder fea-
ture maps to up-sampled feature maps from the de-
coder at every stage to form a ladder-like structure.
Our network (mUnet) starts with a 5-block convoluti-
onal base of neural units alternated with a max pool-
ing layer. Each convolutional layer is followed by a
ReLU activation function. The obtained feature maps
are fed into a decoder. The decoder up samples the
feature maps to produce predictions at the original
spatial resolution. The decoder starts with a 5 block
convolutional base of neural units with each convolu-
tional layer preceded by an up-sampling layer. Each
convolutional layer is followed by a ReLU activation
function. Thus the feature maps finally obtained are
fed into a fully 2D convolutional layer consisting of 4
classes with sigmoid activation function as shown in
the figure 1.
Our network (mUnet) is inherently different from
the traditional (Unet) in the following ways.
• mUNet has 19 convolutional layers as compared
to UNet which has 23 convolutional layers.
• Filter size of 5 5 is used in mUNet while the tra-
ditional UNet has a filter size 3x3.
• The total number of trainable parameters in mU-
net are less as compared to the Unet.
• The convolution operations used in mUnet are
padded convolutions while in Unet there is spa-
tial reduction between subsequent convolutional
layers.
These features make our model much more suitable
for LULC classification. For training the model a
TITAN-XP GPU with CUDA Core 3840 was used.
We tested our model on 32 Core, 2.10 GHz CPU.
4.3 Training Details
For training the model, cross-entropy loss function is
used. Given a class c, the cross-entropy loss is com-
puted as:
L = −(y
i jc
ln(p
i jc
) + (1 − y
i jc
) ln(1 − p
i jc
)) (1)
where the total number of classes are C (in our case
4). mUnet generates predicted binary map for each
class. c. p
i jc
represents the predicted activation value
for pixel I(i, j) and class c. For a given image I, of
height H and width W , the ground truth consists of
a tensor y of size H x W x C such that y
i jc
= 1 if
pixel I(i, j) belongs to class c, otherwise y
i jc
= 0.
The network is trained using Adam optimizer
(Kingma and Ba, 2014) for 200 epochs. A batch size
of 64 is used along with a learning rate of 0.001.
4.4 Post Processing
The model returns binary png and pgw (geo-reference
information) files corresponding to four classes (habi-
tation, water, vegetation and open). Each binary file
is then converted into corresponding four feature class
Land Use Land Cover Classification from Satellite Imagery using mUnet: A Modified Unet Architecture
361
160 X 160
80 X 80
40
2
20
2
10
2
20
2
40
2
80
2
160 X 160
5 32 32
64 64
128
128
256 256
512 512
768
256 256
384
128
128
192
64
64
96
32 32
C
Conv, 5x5, ReLu
Upsample, 2x2
Conv, 1x1, Sigmoid
Copy to merge
Downsample, 2x2
Figure 1: mUnet architecture.
Figure 2: Learning curve.
vectors. The different feature vectors are clustered ac-
cording to a labeled priority setting (1.Water, 2.Ha-
bitation, 3.Vegetation, 4.Open) in order to produce a
singular vector containing lowest priority feature at
the lowest layer and highest priority feature at the top
most layer. The shape regularization is done using
ArcGIS (simplify polygon tool) by eliminating unde-
sirable artifacts in polygons geometry. The vector is
then converted into thematic raster based on the prio-
rity set labels resulting in final LULC map generation.
Figure 4 shows the output binary images of the mUnet
model for all the four classes
Figure 3: Loss curve.
5 RESULTS AND ANALYSIS
The result evaluation is done by calculating kappa
coefficient and by calculating the overall classifica-
tion accuracy. The classification accuracy is asses-
sed by comparing the ground truth thematic map with
the classified map generated by the mUnet model.
A systematic comparison of our model is done with
two deep convolutional networks (Unet, FCN). A
FCN architecture consisting of first 5 convolutional
blocks similar to VGG-16 was implemented for com-
parison, however the fully connected layers were re-
VISAPP 2019 - 14th International Conference on Computer Vision Theory and Applications
362
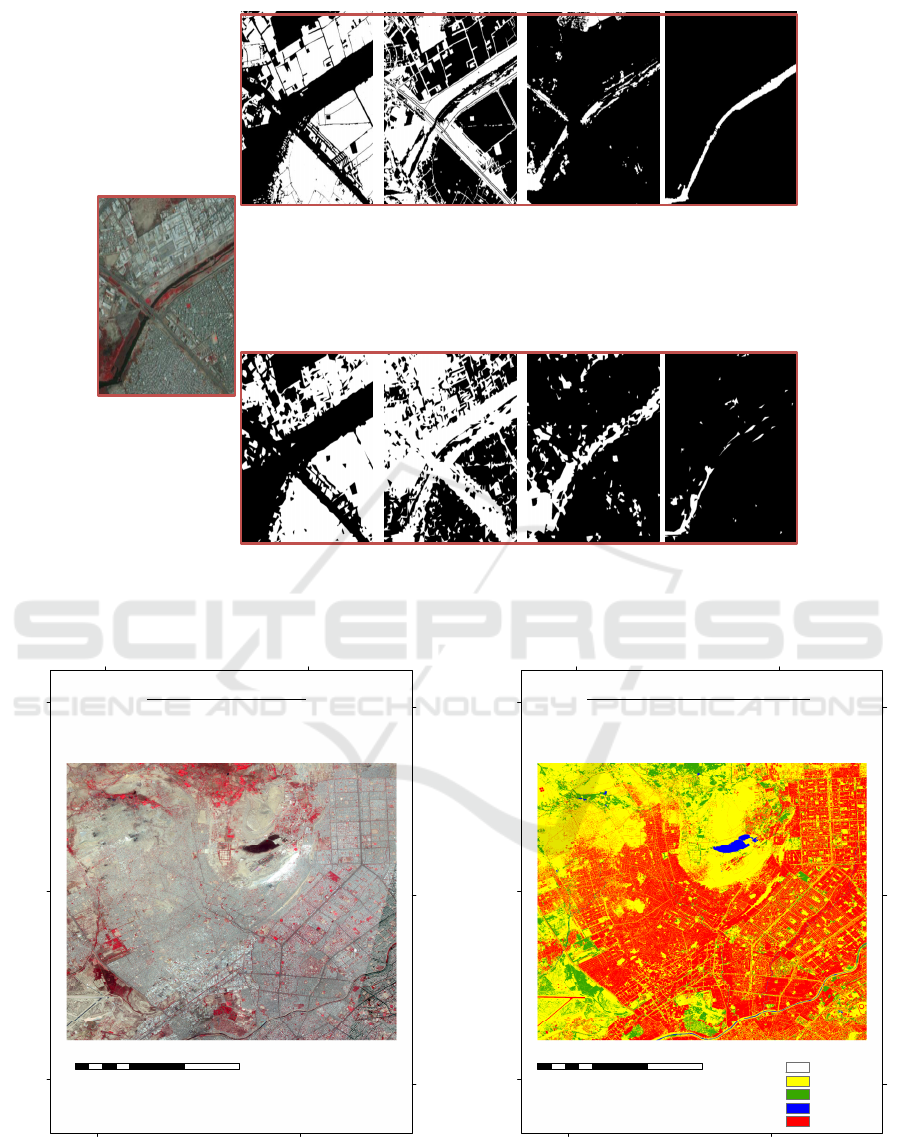
(a)
(b)
(c)
Figure 4: Karachi study area: (a) Satellite image, (b) (left to right) Ground truth for classes habitation, open, vegetation, water,
(c) (left to right) predicted map for classes habitation, open, vegetation, water.
67°2'30"E66°57'0"E
25°2'30"N
24°57'0"N
24°51'30"N
FCC Satellite Image
²
0 2.5 5 7.51.25
Kilometers
Figure 5: FCC satellite imagery of study area.
placed by convolutional layers. Both the models
(Unet, FCN) were implemented using Keras with the-
ano as back end. Table 1 shows the comparison of
67°2'30"E66°57'0"E
25°2'30"N
24°57'0"N
24°51'30"N
Ground Truth LULC Image
²
0 2.5 5 7.51.25
Kilometers
Legend
Unclassified
Open
Vegetation
Water
Habitation
Figure 6: Thematic ground truth map.
all three models using three evaluation criterion that
are: number of trainable parameters, kappa coeffi-
cient, overall accuracy. The model using the least pa-
Land Use Land Cover Classification from Satellite Imagery using mUnet: A Modified Unet Architecture
363
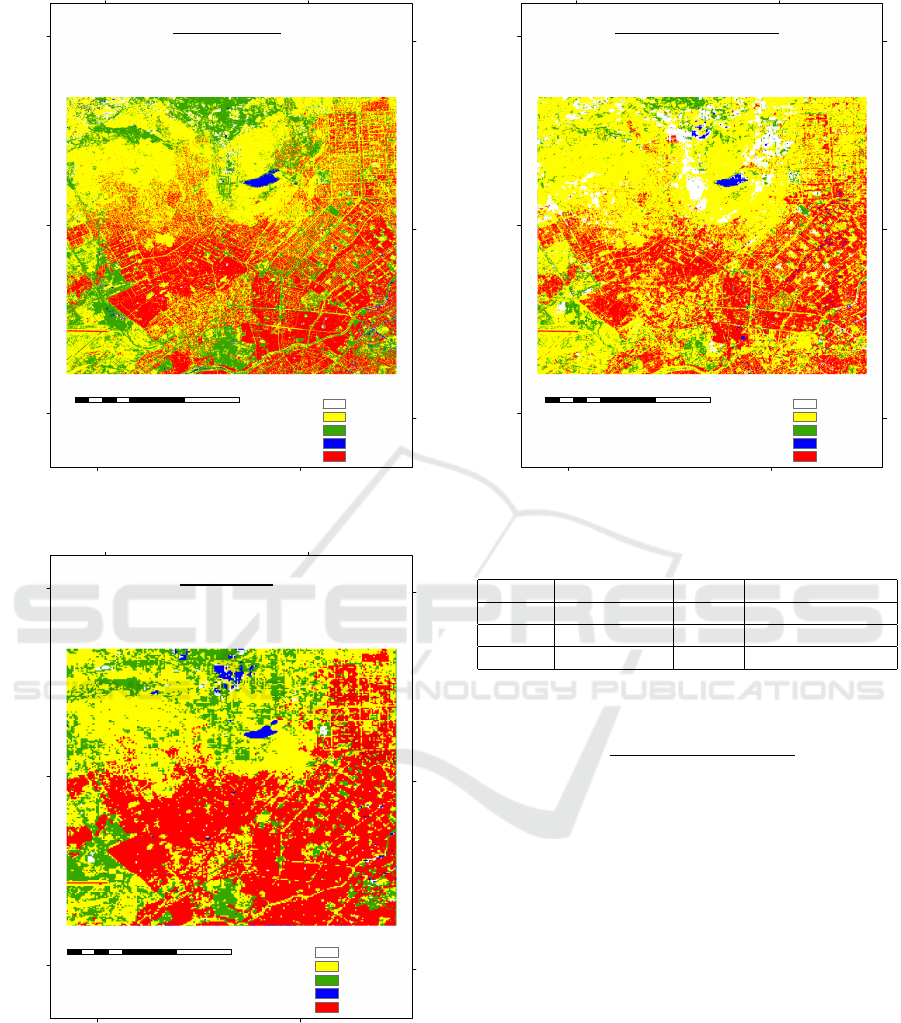
67°2'30"E66°57'0"E
25°2'30"N
24°57'0"N
24°51'30"N
mUnet LULC
²
0 2.5 5 7.51.25
Kilometers
Legend
Unclassified
Open
Vegetation
Water
Habitation
Figure 7: Output of mUnet model.
67°2'30"E66°57'0"E
25°2'30"N
24°57'0"N
24°51'30"N
FCN LULC
²
0 2.5 5 7.51.25
Kilometers
Legend
Unclassified
Open
Vegetation
Water
Habitation
Figure 8: Output of FCN model.
rameters for training and higher value of kappa coef-
ficient and overall accuracy is considered as the best.
Figure 2, 3 also showcase the learning curve and the
loss curves for our model.
Kappa coefficient measures the agreement between
truth values and classification. A kappa value of 1
represents a perfect agreement while a value of 0 re-
67°2'30"E66°57'0"E
25°2'30"N
24°57'0"N
24°51'30"N
Original Unet LULC
²
0 2.5 5 7.51.25
Kilometers
Legend
Unclassified
Open
Vegetation
Water
Habitation
Figure 9: Output of Unet model.
Table 1: Comparison between different segmentation net-
works.
$Parameters kappa OverallAccuracy
FCN 134,281,029 .3908 62.446%
Unet 31,379,205 .3558 62.1077%
mUnet 21,791,109 .5501 70.2857%
presents no agreement. Kappa coefficient is measured
as:
k =
N
∑
C
i=1
m
ii
−
∑
C
i=1
G
i
D
i
N
2
−
∑
N
i=1
G
i
D
i
(2)
where N is the total number of pixels and C is the
total number of classes. m
ii
represents the number
of pixels of class i classified as class i. G
i
are the
total number of pixels in ground truth belonging to
class i. D
i
is the total number of pixels predicted in
class i. Accuracy for class c is computed as m
ii
/G
i
.
It is observed that despite having less number of
parameters mUnet outperforms other architectures
in terms of kappa coefficient and overall accuracy.
Figure 8, 9, 7 show the spatial comparison of
LULC classified map generated using all three
models. As seen in the figure 7, mUnet per-
forms better than the other two models with
providing more accurate results when compa-
red with the ground truth image (figure 6).
Original Unet has misclassified open area with ha-
bitation and vegetation while some of the areas
remain unclassified as seen in figure 6, 9. On
VISAPP 2019 - 14th International Conference on Computer Vision Theory and Applications
364

the other hand classification done by the FCN
model as seen in figure 6, 8 has reduced the
unclassified area but has misclassified pixels be-
longing to open, vegetation and water classes.
When comparing mUnet with other two models the
classification results are more accurate with respect
to the ground truth (figure 6). Hence we can con-
clude that our proposed model has performed better
for LULC classification than the previously defined
models.
6 CONCLUSIONS
This paper has showcased the use of convolutional
neural networks for predicting different land use clas-
ses from satellite imagery. We study the topographi-
cal land use distribution of Karachi using a new
CNN architecture, mUnet. We benchmark mUnet
with other state-of-the-art models such as FCN, Unet.
The experimental results demonstrate that our novel
approach outperforms FCN and Unet. It is observed
that mUnet achieves a higher overall accuracy and
kappa coefficient than the other two models. Additio-
nally, mUnet has the advantage that it uses less num-
ber of trainable parameters. It can further be taken
into consideration that while evaluating our model we
utilized a dataset pre-trained to a developing country
counterpart to the other studies conducted in the area
which have only utilized developed country datasets.
As future directions of this work we plan to address
the problem of LULC by utilizing more classes in our
model, improve and further curate the Karachi dataset
and extend this type of analysis to more developing
cities across other geographical locations.
REFERENCES
Albert, A., Kaur, J., and Gonzalez, M. C. (2017). Using
convolutional networks and satellite imagery to iden-
tify patterns in urban environments at a large scale.
In Proceedings of the 23rd ACM SIGKDD Internati-
onal Conference on Knowledge Discovery and Data
Mining, KDD ’17, pages 1357–1366.
Deng, J., Dong, W., Socher, R., Li, L.-J., Li, K., and Fei-
Fei, L. (2009). ImageNet: A Large-Scale Hierarchical
Image Database. In CVPR09.
He, K., Zhang, X., Ren, S., and Sun, J. (2016). Deep resi-
dual learning for image recognition. 2016 IEEE Con-
ference on Computer Vision and Pattern Recognition
(CVPR), pages 770–778.
Iandola, F. N., Moskewicz, M. W., Ashraf, K., Han, S.,
Dally, W. J., and Keutzer, K. (2016). Squeezenet:
Alexnet-level accuracy with 50x fewer parameters and
<0.5MB model size. CoRR, abs/1602.07360.
Kingma, D. P. and Ba, J. (2014). Adam: A method for
stochastic optimization. CoRR, abs/1412.6980.
Krizhevsky, A., Sutskever, I., and Hinton, G. E. (2012).
Imagenet classification with deep convolutional neu-
ral networks. In Advances in Neural Information Pro-
cessing Systems 25, pages 1097–1105.
Kussul, N., Lavreniuk, M., Skakun, S., and Shelestov, A.
(2017). Deep learning classification of land cover and
crop types using remote sensing data. IEEE Geos-
cience and Remote Sensing Letters, 14:778–782.
Mnih, V. (2013). Machine learning for aerial image labe-
ling.
Papadomanolaki, M., Vakalopoulou, M., Zagoruyko, S.,
and Karantzalos, K. (2016). Benchmarking deep le-
arning frameworks for the classification of very high
resolution satellite multispectral data. ISPRS Annals
of Photogrammetry, Remote Sensing and Spatial In-
formation Sciences, III-7:83–88.
Ronneberger, O., P.Fischer, and Brox, T. (2015). U-
net: Convolutional networks for biomedical image
segmentation. In Medical Image Computing and
Computer-Assisted Intervention (MICCAI), volume
9351 of LNCS, pages 234–241.
Tong, X.-Y., Lu, Q., Xia, G.-S., and Zhang, L. (2018).
Large-scale land cover classification in gaofen-2 sa-
tellite imagery. IGARSS 2018 - 2018 IEEE Internati-
onal Geoscience and Remote Sensing Symposium, pa-
ges 3599–3602.
Torres, M. T., Perrat, B., Alfano, V., Goulding, J., and Val-
star, M. (2017). Automatic pixel-level land-use pre-
diction using deep convolutional neural networks.
Land Use Land Cover Classification from Satellite Imagery using mUnet: A Modified Unet Architecture
365
