
Micro-expression Recognition Under Low-resolution Cases
Guifeng Li
1
, Jingang Shi
2
, Jinye Peng
1,∗
and Guoying Zhao
1,2
1
Department of Information Science and Technology, Northwest University, Xi’an, China
2
Center for Machine Vision and Signal Analysis, University of Oulu, Oulu, Finland
Keywords:
Micro-expression Recognition, Surveillance Video, Low-resolution, Super-resolution, Fast LBP-TOP.
Abstract:
Micro-expression is an essential non-verbal behavior that can faithfully express the human’s hidden emotions.
It has a wide range of applications in the national security and computer aided diagnosis, which encourages
us to conduct the research of automatic micro-expression recognition. However, the images captured f r om
surveillance video easily suffer from the low-quality problem, which causes the difficulty in real applicati-
ons. Due to the low quality of captured images, the existing algorithms are not able to perform as well as
expected. For addressing this problem, we conduct a comprehensive study about the micro-expression re-
cognition problem under low-resolution cases with face hallucination method. The experimental results show
that the proposed framework obtains promising results on micro-expression recognition under low-resolution
cases.
1 INTRODUCTION
Facial expression is one of the most significant re-
flection for human emotion information. In r e cent
years, the analysis of facial expression ha s attracted
more and more attention in the field of computer vi-
sion. Different from the general facial expressions,
micro-expr ession is spontan eous, involuntary and is
an instinct of human beings. Commonly, the du-
ration of micro-expression is o nly from 1/25 to 1/2
second, while the intensity of expression is also at
a low level. Because of the above characteristics,
micro-expr ession an a lysis bec omes very challenging.
The ap plication of micro-expression analysis is p e r-
vasive and could be utilized in the security, judicial
system, clinical diagnosis, public management and
auxiliary education. At present, resear chers have col-
lected a variety of high-quality datasets to evaluate
micro-expr ession recognition algorithms, and achie-
ved reasonab le recognition accur acies on these data-
sets. In the real world, however, very often we can
have only low-quality video clips from tradition a l de-
vices e.g. surveillance cameras or closed-circuit tele-
vision. Therefore, it is especially c rucial to conduct
micro-expr ession an a lysis in such harsh cases.
The main tasks of micro-expre ssion analy sis are
spotting and recognition. The spotting is to find the
fragments of the micro-expression from the input vi-
deo sequence, and the recog nition is to determine the
types of micro-expression fragment (e.g., happiness,
disgust, repression or surprise). Because the rese-
arch in this paper focu ses on the recognition of micro-
expression, it is assumed that the video clips mentio-
ned here are already spotted and only contain micro-
expression.
In recent years, researchers have proposed many
methods for spontaneous micro-expression recogni-
tion. Pfister et al. (Pfister et al., 2011) proposed the
first automatic micro-expression recognition system
on spontaneous micro-expression dataset, which uti-
lized temporal interpolation model (TIM) (Zhou et al.,
2011) together with Multiple Kernel Learning (MKL)
to capture the main variation of image sequences, and
employed the Local Binary Patterns from Three Ort-
hogonal Planes (LBP-TOP) (Zhao and Pietik¨ainen,
2007) to extract the feature descriptors and Random
Forest (RF) as the classifiers. Since the n, many rese-
archers have developed various versions and variants
of descriptors to improve the micro-expression recog-
nition accuracies (Ruiz-Hernandez and Pietik¨ainen,
2013; Wang et a l., 2014 b; Wang et al., 2014c; Wang
et al., 2015). Wang et al. (Wang et al., 2014a) em-
ployed Tensor Independent Color Space (TICS) to ex-
tract discriminative features for recognition. Ngo et
al. (Le Ngo et al., 2014) utilized the Selective Trans-
fer M a chine (STM) for micro-expression s image se-
quences pre-pro cessing in order to solve imbalance
and different facial morphology in the dataset. Liong
et al. ( Liong et a l., 2014) obtain ed the subtle displace-
ment of the faces within a tem poral interval fro m op-
Li, G., Shi, J., Peng, J. and Zhao, G.
Micro-expression Recognition Under Low-resolution Cases.
DOI: 10.5220/0007373604270434
In Proceedings of the 14th International Joint Conference on Computer Vision, Imaging and Computer Graphics Theory and Applications (VISIGRAPP 2019), pages 427-434
ISBN: 978-989-758-354-4
Copyright
c
2019 by SCITEPRESS – Science and Technology Publications, Lda. All rights reserved
427
d/D
&ĞĂƚƵƌĞ
ĞdžƚƌĂĐƚŝŽŶ
ůŝŐŶŵĞŶƚ
Θ
^ĞŐŵĞŶƚĂƚŝŽŶ
ůĂƐƐŝĨŝĐĂͲ
ƚŝŽŶ
濟瀂瀊激瀅濸瀆瀂濿瀈瀇濼瀂瀁澳
濼瀀濴濺濸澳瀆濸瀄瀈濸瀁濶濸瀆
濥濸濶瀂瀁瀆瀇瀅瀈濶瀇濸濷澳
濼瀀濴濺濸澳瀆濸瀄瀈濸瀁濶濸瀆
^ƵƉĞƌͲ
ƌĞƐŽůƵƚŝŽŶ
ƌĞĐŽŶƐƚƌƵĐƚŝŽŶ
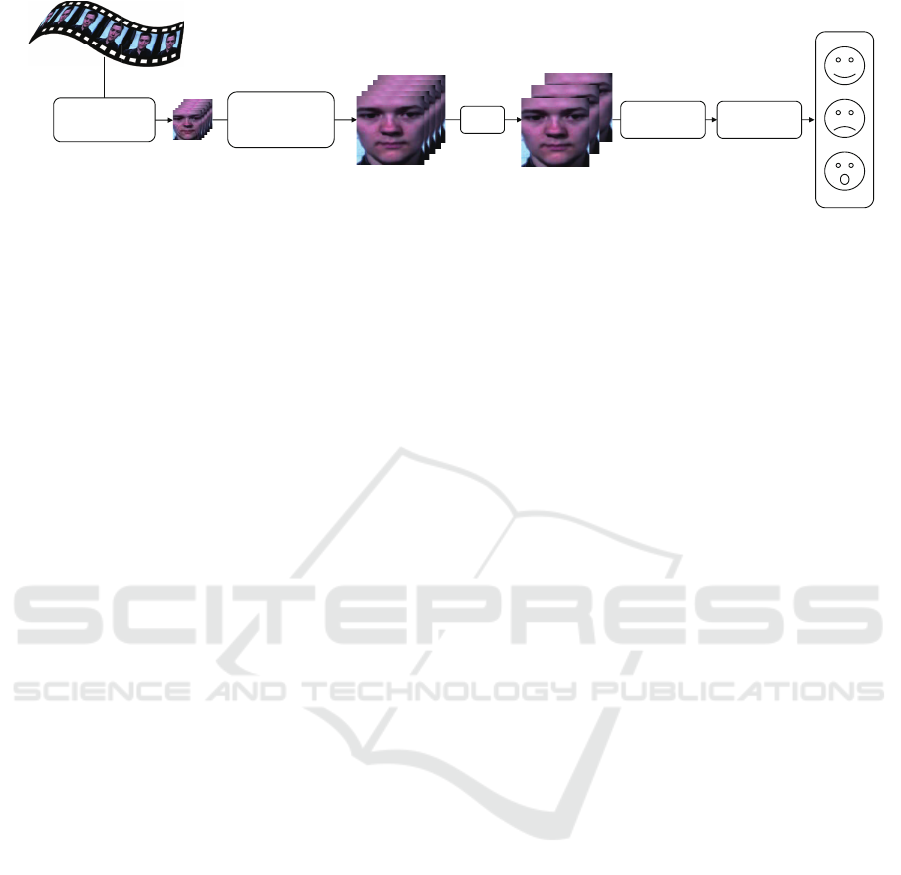
Figure 1: The flowchart of the proposed recognition system.
tical strain magnitudes and assigned different weights
to the local features to form a new feature. Lu et al.
(Lu et al., 2014) introd uced Delaunay-based tempo-
ral coding model (DTCM) to normalize the image se-
quences in the spatiotemporal domain. O h et al. (Oh
et al., 2015) a cquired m ulti-scale monogenic signals
through the Riesz wavelet transform, and combined
the feature s of m agnitude, phase, and orientation for
micro-expr ession recognition. Liu et al. (Liu et al.,
2016) developed the Main Directional Mean Optical-
flow ( MD MO) to explore th e discriminative fea tu-
res from micro-expression. It simultan e ously consi-
ders local statistic motion and spatial position infor-
mation by the use of a robust optical flow model. Li
et al. (Li et al., 2017) extended Histograms of Or ien-
ted Gradients ( HO G ) and Histograms of Image Gra-
dient Orientation (HIGO) on three orthogonal p lanes,
and proposed HOG-TOP and HIGO-TOP based on
the idea of LBP-TOP. Xu et al. (Xu et al., 2017) ex-
ploited o ptical flow estimation to conduct pixel-level
alignment in the chosen granularity for the micro-
expression image seque nces, and obtained principal
optical flow d irection, as the subtle facial dynamic fe-
ature descriptor. Th e proposed micro-expression des-
criptor is also called the Facial Dynamics Map. He
et al. (He et al., 2017) introduced a multi-task mid-
level feature learning method for feature extraction,
which has the ability to obtain more discriminative
mid-level features with more generalization a bility.
Recently, some r esearchers utilized the n ovel p opu-
lar deep learning algorithm to learn deep features for
micro-expr ession recognition, but the results are far
away from satisfactory. The prima ry reason is that
deep lear ning algorithm requires a lot of training sam-
ples, but the scale of the current dataset is extremely
limited (Patel et al., 2016).
Although re c ent micro-expression recognition al-
gorithm achieves reasonable results, the perform ance
highly depends on the quality of facial video clip.
Once the quality of facial video clip used for recog-
nition is poor (such as the low-resolution), the above
algorithm will not work well. The reason mainly lies
in two aspects: (i) The low-resolution images lose
a lot of detail information, which induces the diffi-
culty to extract the available features from the low-
resolution im age sequences (Lei et al., 2011). (ii)
The low-resolution images are not homogeneous with
the high-resolution ones (e.g., different re solution and
different clarity), which pr events us to direc tly use the
low-resolution images as input in the testing phase. In
the real world, the facial image captu red from the sur-
veillance video usually on ly accounts for a small part
of the en tire picture. For example, th e SMIC data-
set for micro-expression recognition has a facial re-
solution of 190 × 230. However, th e captured facial
image sequences by the surveillance videos are of-
ten under the resolution of 50 × 50 (or lower). This
means that the previous micro-expression re c ognition
methods cannot be directly utilized to deal with the
low-resolution case. Therefore, micro-expression re-
cognition research under low-resolution cases is vital
and challenging.
To solve the a bove problems, we perfo rm the rese-
arch of low-resolution micro-expression recognition
with the help of recent facial hallu c ination meth ods.
We first hallucinate the low-quality facial image se-
quence to recover the lost dynamic characteristics.
Then, we conduct the traditional micro-expression
recogn ition methods to explore low-quality micro-
expression recognition. We evaluate the performance
of micro-expression recognition accuracies under dif-
ferent resolutions to investigate the relationship be-
tween resolution and recognition accuracy. Gene-
rally, the target of this paper is to make a c omprehen-
sive study about the influence of resolution in micro-
expression rec ognition, while also develop a frame-
work to deal with micro-expression recogn ition task
in low-quality co ndition.
The rest of this paper is organized as follows.
In Section 2 we describe our micro-expression re-
cognition framework. Section 3 presents experimen-
tal results and discussion. Conclusions are drawn in
Section 4.
VISAPP 2019 - 14th International Conference on Computer Vision Theory and Applications
428
2 THE PROPOSED
RECOGNITION FRAMEWORK
The low-resolution micr o-expression recognition pro-
cess include image sequence pre-processing, super-
resolution reconstruction, feature extraction and clas-
sification, as shown in Figure 1. More details o f d es-
cription ar e as fo llows:
2.1 Low-resolution Datasets
There are several datasets for micro-expression rec og-
nition, such as SMIC (Li et al., 2013) and CASME
II (Yan et al., 2014). However, all of th e se datasets
are high-definition image sequen c es acquire d by pro-
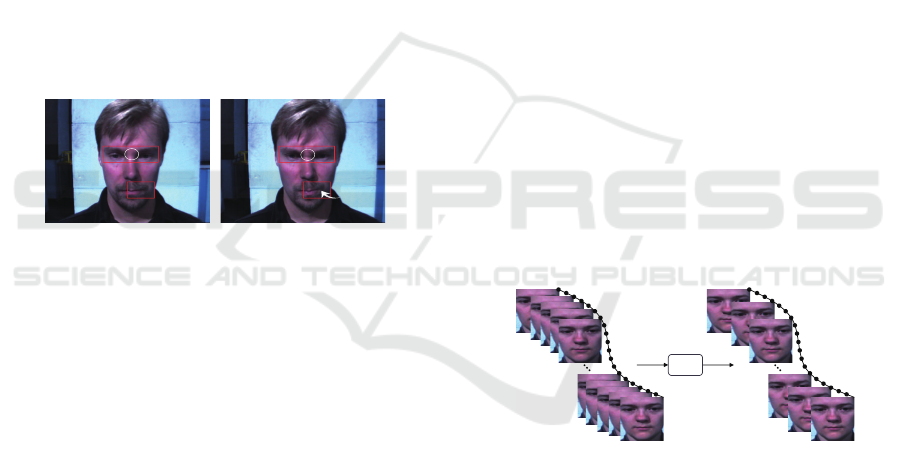
fessional cameras in specific circumstances. Figure 2
shows two frames from a video clip of the SMIC-HS
dataset. We can find subtle changes in facial expres-
sions within the red box. In particular, the movement
in the area of the white ellipse and the position of the
white arrow are more obvious. If th e image resolution
is too low, these details are hard to be no tice d.
Figure 2: Two frames from a video clip of the SMIC-HS
dataset.
Since there is no low-resolution image sequence
in the existing spontaneous micro-expression data-
sets, we use image deterioration processing to obtain
simulated low-resolution micro-expression image se-
quences. In the paper (Wang et al., 2014d), the low-
resolution images are divided in to three categories:
small size, poor quality, an d small size & poor qua-
lity. We conside r the third type of images (small size
& poor quality) that is closer to the situation of the
real ap plications as the simulated image.
In the image reconstruction task, low-resolution
image sequences are obta ined by blurring, down-
sampling, and noising processes from high-resolution
image sequences (Shi et al., 2018):
L
L
L = D
D
DB
B
BH
H
H + n
n
n (1)
where D
D
D and B
B
B are down-sampling and blurring re-
spectively, H
H
H is h igh-resolution image, n
n
n represents
the ad ditive noise, and L
L
L is low-resolution image.
2.2 Image Pre-processing
In our proposed framework, the pre-processing
mainly includes three steps: face alignm ent, face seg-
mentation, and TIM. There a re natural pose varia-
tion and involuntary movement in raw collected vi-
deos. At the same time, micro-expression video clips
are collected from different participants, with diffe-
rent gender, age, and ethnics. Ther efore, to avoid the
interference of the a bove-mentioned non -expression
factors, it is indispensable to condu ct the face align-
ment and face segmentation procedure.
We selec t a frame with fro ntal face and neutral
expression from a particular segmen t as the canoni-
cal template, and manually locate the position of two
eyes. Then, the Active Shape Mode l (ASM) is car-
ried out to detect 68 facial land marks (Cootes et al.,
1995). The relationship between 68 facial landmarks
of canonical frame and 68 facial landmarks o f other
frames is established by the Local Weighted Mean
(LWM) (Goshtasby, 1988), and the micro-expr ession
images are aligned to the canonical frame to minimize
interference caused by non-expression factors.
Micro-expression videos have various length,
from 4 frames to 50 frames (if captured by a ca-
mera with 100 fps). To solve the problem of diffe-
rent lengths in video clips, Li et al. (Li et al., 2017)
used the TIM algorithm to map all the frames of a
sequence onto a curve, sample the newly syn thesised
facial images with a fixed interval, and finally obtai-
ned the same pre-defined sequence length. The expe-
rimental results show that the algorithm has improved
the recognition accuracy. Figure 3 shows the mapping
process of TIM (Zhou et al., 2011).
濜瀁瀃瀈瀇
濧濜濠
濢瀈瀇瀃瀈瀇
Figure 3: The input is the original image sequences, and the
output is the TIM interpolated image sequences.
2.3 Super-resolution Reconstruction
Low-resolution images and high-reso lution images
are heterogen e ous in both quality and resolution.
The micro-expression recognition method of high-
resolution image sequences cannot be directly applied
to low-resolution image sequences. In Section 2.1,
we present the procedure of generating low-resolution
images f rom high-resolution images.
To reconstruct high-resolution images, the paper
(Shi et al., 2018) proposed a novel face hallucination
algorithm . It combines the patch-based regularization
Micro-expression Recognition Under Low-resolution Cases
429
term and the pixel-based regularization term to con-
strain the objective fun c tion. The reconstructed high-
resolution image H
H
H can be obtained by minimizing
the following objective function:
f (H
H
H) = kL
L
L − D
D
DB
B
BH
H
Hk
2
2
+αF
F
F
patch
+ ηF
F
F
pixel
+ λF
F
F
penalty
(2)
where the first item on the right side is the recon-
struction error, and the last three items are patch-
based regularization terms, pixel-based regulariza tion
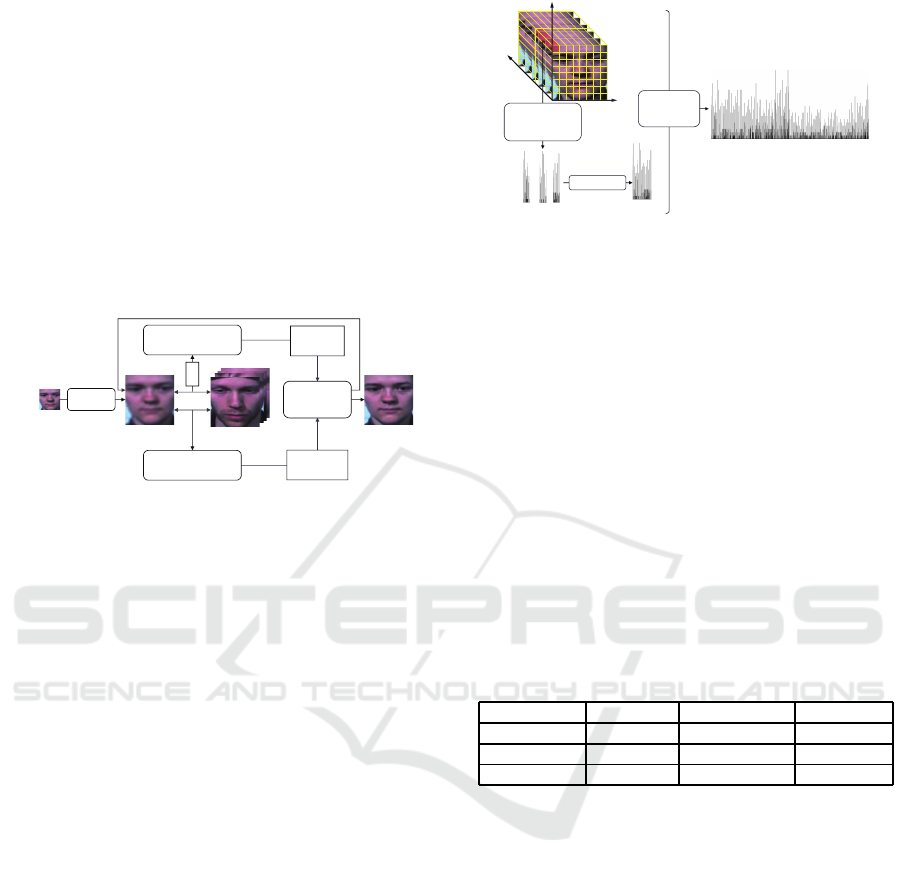
terms, and penalty terms r e spectively. Figure 4 illus-
trates the whole hallucin ation task. For details, plea se
refer to (Shi et al., 2018).
濟瀂瀊激瀅濸瀆瀂濿瀈瀇濼瀂瀁澳
濼瀀濴濺濸
濄濅濋灤濄濅濋澳濼瀀濴濺濸
瀇瀅濴濼瀁濼瀁濺澳瀆濸瀇
WŝdžĞůͲďĂƐĞĚ
WĂƚĐŚͲďĂƐĞĚ
/ŵĂŐĞ
ƚĞdžƚƵƌĞ
>ŽĐĂů
ƐƚƌƵĐƚƵƌĞ
濥濞濛濦
ϭϮϴ灤ϭϮϴ
ŝŵĂŐĞ
濜瀁濼瀇濼濴濿濼瀍濴激
瀇濼瀂瀁
濄濅濋灤濄濅濋澳
濼瀀濴濺濸
Figure 4: Super-resolution Reconstruction.
2.4 Micro-expression Recognition
As shown in Figure 1, the micro-expression recog-
nition is mainly divided into two parts: feature ex-
traction and classification. In the previous micro-
expression analysis methods (Pfister et al., 2011;
Wang et al., 2014b; Wang et al., 2014c; Li et al., 2017;
He et al., 2017), the researchers show the advantages
of LBP-TOP a nd its variants as feature descr iptors.
Different from the traditional LBP feature that
mainly focuses on a single image, LBP-TOP can cap-
ture dynamic variations in both spatial and temp o-
ral domains, which is essential for micro-expression
recogn ition. We first divide the whole facial image
sequence into several cuboids, such as 5 × 5 × 1,
8 × 8 × 2 , etc., where the first two parameter s deter-
mine the num ber of the blocks in spatial domain, and
the last parameter is the num ber of segments in the
temporal directio n. Ea ch cuboid can be considered as
a new unit. The LBP features are extracted from three
different orthogonal planes (XY, XT, and YT planes)
in the new unit. We traverse all the cuboids to obtain
the LBP-TOP features of the image sequence and then
LBP-TOP features of each cuboid are concatenated.
As shown in Figure 5.
In the classification part, we use the linear support
vector machine (LSVM) (Chang and Lin, 2011) as
the classifier. To make a fair comparison, we employ
the leave-one-subject-out protocol in th e experiments.
According to the micro-expression labels provided by
the dataset publisher, we classify the samples from
濬
濫
濧
濟濕濣激濧濢濣
濄
濫濬 濫濧 濬濧
濖濴瀆濶濴濷濼瀁濺
濘瀋瀇瀅濴濶瀇澳濟濕濣澳
濹濸濴瀇瀈瀅濸瀆澳濹瀅瀂瀀澳
瀇濻濸澳濶瀈濵瀂濼濷
濧瀅濴瀉濸瀅瀆濼瀁濺澳
濼瀀濴濺濸澳
瀆濸瀄瀈濸瀁濶濸瀆
濟濕濣激濧濢濣
濅
Figure 5: L BP-TOP feature extraction of image sequences.
XY, XT, and YT refer to the XY plane, the XT plane, and
the YT plane, respectively. LBP-TOP
1
refers to the LBP-
TOP feature of a single cuboid. LBP-TOP
2
refers to the
LBP-TOP feature of the entire image sequence.
SMIC into three categories (positive, negative, and
surprised), and samples from CASME II into five ca-
tegories (happiness, surprise, repression, disgust, and
others).
3 EXPERIMENT AND ANALYSIS
We now present the experiments and results on three
different spontaneous micro-expression datasets, i.e.,
the SMIC-HS, SMIC-subHS and CASME II. The ex-
perimental parameter setting and result analy sis will
be discussed in the following subsections.
Table 1: The summary of used datasets.
SMIC-HS SMIC-subHS CASME II
Micro-Clips 164 71 247
Participants 16 8 26
Classes 3 3 5
3.1 Pre-processing
SMIC-HS and SMIC-subHS are two subsets of
SMIC. The SMIC-HS dataset contains 16 4 spontane-
ous micro-expression clips from sixteen participa nts,
which are categorized into three categories: posi-
tive (51 clips), negative (70 clips), and surprise (43
clips). The SMIC-subHS dataset (Li et al., 2017)
is a subset of SMIC-HS an d contains only the last
eight participants. The numbe r of micro-expression
clips from each of the first eight subjects varies a
lot, three subjects have contributed almost ha lf micro-
expression samples of the whole set, which could af-
fect the leave-one-subjec t-out per formance, while the
later eight subjects’s (SMIC-subHS) clips number are
more evenly distributed. And the numb er of positive,
negative and surprise clips is 28, 23 and 20, respecti-
vely in the SMIC-subHS dataset. Meanwhile, the
CASME II dataset contains twenty-six participants
VISAPP 2019 - 14th International Conference on Computer Vision Theory and Applications
430
belonging to five different categories: sur prise (25
clips), happiness (32 clips), others (99 clips) , disgust
(64 clips), and repression (27 clips). Table 1 shows a
summary of the datasets used in the experiments. The
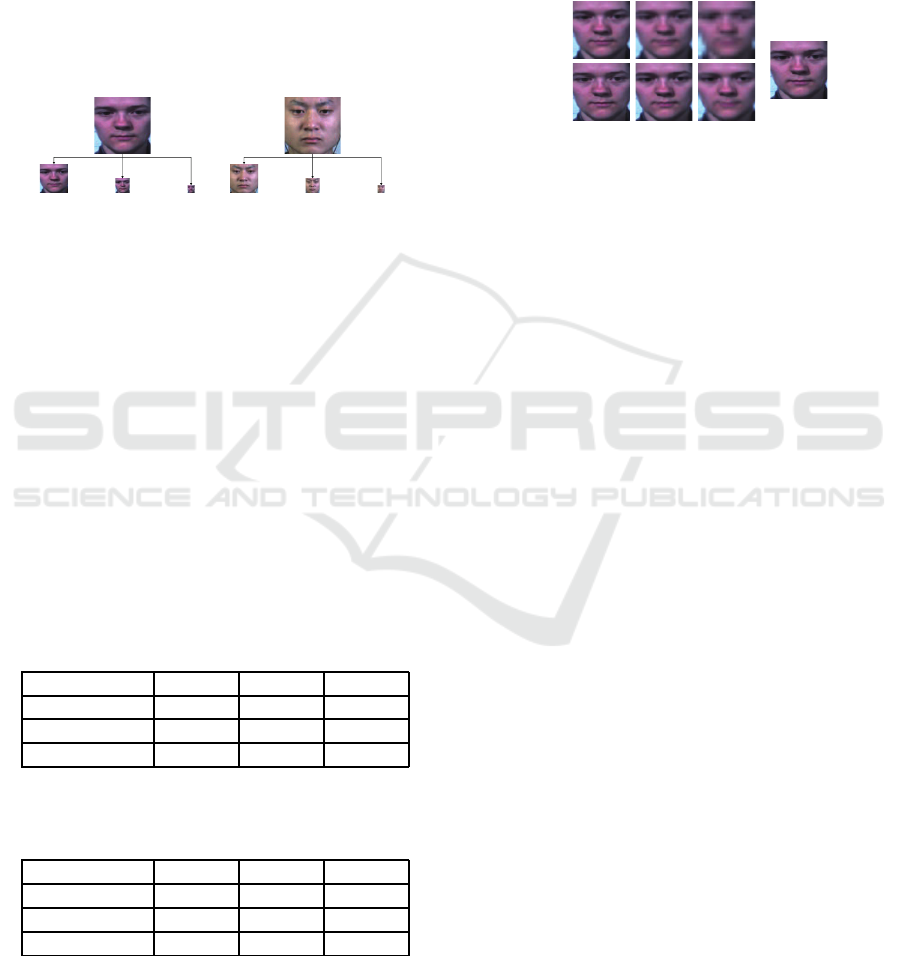
facial resolution of the high-resolutio n image is set as
128×128 in the experiment. The images of 128×128
resolution a re downsampled by 2, 4 and 8 time s to
obtain low-resolution images (as shown in Figure 6).
This means that we evaluate the low-resolution facial
image sequences of three various levels (e.g., 16 ×16,
32 × 32, 64 × 64) in the micro-expression recognition
tasks.
濄濅濋灤濄濅濋
濉濇灤濉濇 濆濅灤濆濅 濄濉灤濄濉
(a)
濄濅濋灤濄濅濋
濉濇灤濉濇 濆濅灤濆濅 濄濉灤濄濉
(b)
Figure 6: (a) SMIC-HS/SMIC-subHS low-resolution
image, (b) CASME II low-resolution image.
3.2 Reconstruction
In this section, the low-resolution image is recon-
structed into a high-resolution ima ge using the met-
hod proposed in the paper (Shi et al., 2018), which is
briefly introduc e d in Section 2.3. Tables 2-3 list the
average peak signal to noise ratio (PSNR) and structu-
ral similarity (SSIM) index of the reconstructed image
sequences for different datasets under various reso lu-
tions. H e re, we use S64, S32, and S16 to name the re-
constructed image sequences from resolution 64 × 64,
32 × 32, and 16 × 16, respectively.
Table 2: The average PSNR (dB) indexs of the recon-
structed image sequences for the SMIC-HS, SMIC-subHS
and CASME II datasets under the different resolution.
PSNR (d B) 16 × 16 32 × 32 64 × 64
SMIC-HS 31.25 37.67 44.30
SMIC-subHS 31.67 38.26 43.22
CASME II 31.80 36.49 37.83
Table 3: The average SSIM indexs of the reconstructed
image sequences for the SMIC-HS, SMIC-subHS and
CASME II datasets under the different resolutions.
SSIM 16 × 16 32 × 32 64 × 64
SMIC-HS 0.9397 0.9775 0.9883
SMIC-subHS 0.8970 0.9346 0.9424
CASME II 0.9439 0.9761 0.9882
As shown in Tables 2 and 3, the quantitative indi-
cator (PSNR/SSIM) of the reconstructed facial image
sequences is prop ortional to the resolution of input fa-
cial image seq uences. For example, in the SMIC-HS
dataset, the PSNR index of S16 is 31.25dB, which
is 6.42dB lower than S32, and 13.05dB less than S64.
For the SSIM index, S16 achieves the value of 0.9397,
which is 0.0378 infe rior to S32, and 0.0486 lower than
S64. Besides, Figure 7 presents the visual perfor-
mance of the reconstructed image sequences, which
also indicates the same conclusion as the above view-
point.
濉濇灤濉濇 濆濅灤濆濅 濄濉灤濄濉
濛濥
濦濥
濟濥
濄濅濋灤濄濅濋
Figure 7: Comparison of reconstruction results at different
resolutions.
3.3 Recognition
To normalize the duration of the video clips, the frame
number of the video clips is interpolated to 10 fra-
mes by TIM algorithm (Li et al., 2017) as introduced
in Section 2.2. We apply the fast LBP-TOP (Hong
et al., 2016) to divide the video clips into different
cuboids and extract the LBP-TOP f e ature of each cu-
boid to constitute a complete feature, where uniform
mapping is used, the radius r is set to r = 2, and the
number of neighboring points p is set to p = 8. We
use the leave-one-subject-out protocol to conduct the
experiments, i.e., use all the sam ples of one subject
as the testing set, and the samples from all the other
subjects as the training set. We employ L SVM as the
classifier, where penalty coefficient c = 1 .
3.3.1 Recognition of Low-resolution Image
Sequences
In this subsection, we present a baseline for the per-
formance of micro-expression recognition of low-
resolution image sequences. To adapt the testing sam-
ples of various resolutions, we downsample the trai-
ning set from 128 × 1 28 to the corresponding reso lu-
tion (i.e., the same with testing samples) in order to
condu c t the classification p rocedure. Notice th at the
downsampling operation causes the lack of discrimi-
native features for micro-expression. T he following
experiments also show that the recogn ition acc uracy
dramatically decreases under very low resolution.
Figure 8 shows the re cognition accuracy of dif-
ferent resolution image sequences at different data-
sets. Here, we use L64, L32, and L16 to name the
low-resolution image sequences respe c tively. From
Figure 8, it is found that the recognition accuracy of
Micro-expression Recognition Under Low-resolution Cases
431
L64
L32
L16
Resolution
0.35
0.45
0.55
0.65
0.75
Accuracy
SMIC-HS
SMIC-subHS
CASME II
128×128
Figure 8: The recognition accuracy of different resolution
image sequences at different datasets.
the SMIC-SubHS dataset (the blue fold line) drama-
tically decreases when the resolution o f input image
sequences reduces from 64 × 64 to 32 × 32. Mean-
while, we can see that the accuracy of low-resolution
image sequences (e.g., L16) is relatively low. This
pheno menon indicates that it is hard to acquire satis-
factory results with low-resolution image sequences.
The main reason is that the low-resolution causes the
lack of high-frequency information a nd texture details
in describing the micro-expression.
34.29
23.53
27.91
41.43
60.78
9.30
24.29
15.69
62.79
N
P
S
N
P
S
73.91
21.43
15.00
21.74
78.57
20.00
4.35
0.00
65.00
N
P
S
N
P
S
22.22
1.56
1.01
3.13
0.00
11.11
34.38
18.18
18.75
28.00
44.44
57.81
71.72
18.75
36.00
22.22
6.25
9.09
53.13
24.00
0.00
0.00
0.00
6.25
12.00
R
D
O
H
S
R
D
O
H
S
34.29
17.65
27.91
31.43
70.59
20.93
34.29
11.76
51.16
N
P
S
N
P
S
52.17
10.71
10.00
30.43
85.71
15.00
17.39
3.57
75.00
N
P
S
N
P
S
11.11
0.00
1.01
15.63
0.00
29.63
43.75
24.24
15.63
28.00
44.44
54.69
70.71
40.63
48.00
14.81
1.56
4.04
28.13
20.00
0.00
0.00
0.00
0.00
4.00
R
D
O
H
S
R
D
O
H
S
27.14
15.69
27.91
28.57
60.78
9.30
44.29
23.53
62.79
N
P
S
N
P
S
39.13
25.00
30.00
47.83
71.43
20.00
13.04
3.57
50.00
N
P
S
N
P
S
11.11
3.13
1.01
0.00
0.00
25.93
32.81
20.20
15.63
28.00
48.15
57.81
70.71
37.50
44.00
14.81
3.13
6.06
46.88
28.00
0.00
3.13
2.02
0.00
0.00
R
D
O
H
S
R
D
O
H
S
38.57
41.18
18.60
20.00
23.53
18.60
41.43
35.29
62.79
N
P
S
N
P
S
26.09
21.43
35.00
47.83
71.43
30.00
26.09
7.14
35.00
N
P
S
N
P
S
7.41
4.69
0.00
0.00
0.00
40.74
26.56
14.14
28.13
28.00
48.15
59.38
78.79
59.38
56.00
3.70
6.25
6.06
12.50
12.00
0.00
3.13
1.01
0.00
4.00
R
D
O
H
S
R
D
O
H
S
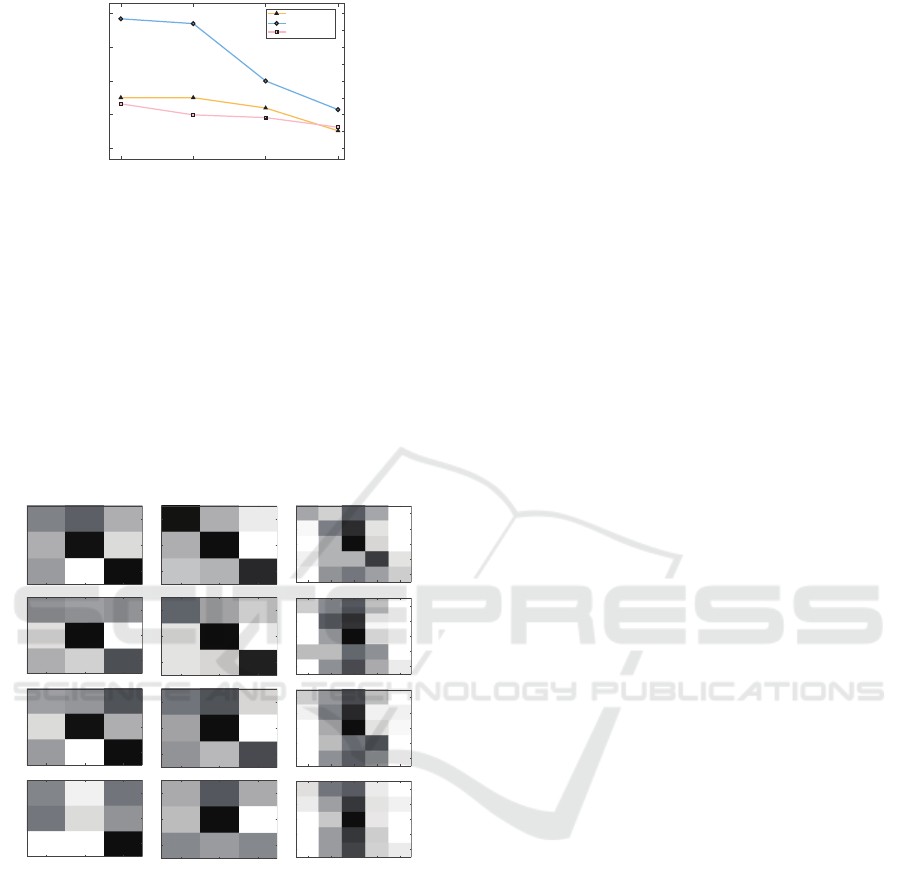
Figure 9: Confusion matrix of recognition accuracy of
image sequences with different resolution. In the horizontal
direction, Left: SMIC-HS, Middle: SMIC-subHS, Right:
CASME II. In the vertical direction, from t op t o bottom,
there are 128 ×128, 64 × 64, 32 ×32, 16 × 16, respectively.
P: positive, N: negative, S: surprise, R: repression, D: dis-
gust, O: others, H: happiness.
Figure 9 shows the confusion matrix for the classi-
fication results of low-resolution image sequences and
also the performance u nder 128 × 128 resolution as
the reference. We can find that when the resolution of
the image sequ e nces is 128 ×128 in the SMI C-SubHS
dataset (the second column of Figure 9), the co nfusion
matrix is more concentrated on the diagonal, which
indicates that the micro-expression recognition met-
hod performs well. However, when the resolution of
the im age sequences decreases, the confusion matrix
is grad ually to become poor. We can also find that
the proportion of misclassification in SMI C-H S (the
first column of Figure 9) and CASME I I (th e third co-
lumn of Figure 9) is more than the SMIC-subHS, and
the recog nition accuracy shown in Figure 8 is also re-
latively low. For SMIC-HS, the main reason for the
above problems may be that the last eight subjects
(the SMIC-subHS dataset) have a more balanced dis-
tribution than the first eight subjects. For CASME
II, it is mainly be cause of the imbalance distribution
and excessive ca tego ries. For example, th e number
of video clips from the class OTHERS accounts for
40.08% in the CASME II dataset.
3.3.2 Performance of the Proposed Framework
In this subsection, we carry ou t the experiments of our
proposed framework on three datasets. Th e testing set
is first reconstructed to the resolution o f 128 × 128,
and then we conduct the classification in the high-
resolution space. According to empirical analysis, we
select the optimal pa rameters for LBP-TOP. Table 4
gives the recognition accuracy together with the cor-
respond ing parameter setting of blocksize.
We can see from Table 4 that the experimental re-
sults have been significantly improved. For example,
in the SMIC-subHS dataset, the recognition accu racy
of the image seq uences under 64 × 64 resolution in-
creased from 71. 83% to 74.65%, with an increase of
2.82%. The recognition accuracy of S32 is 74.65%,
which is 19.72% highe r than L32. The recognition
accuracy of S16 is 73.24%, which is 26.7 6% higher
than L16. Th is shows that our method has a good im-
provement on the micro-expression recognition accu-
racy of low-resolution image sequences. We also no-
tice that the pr oposed f ramework even obtains better
results with S64 than directly utilizin g the input as ori-
ginal 128 ×128 image sequences. It could be because
that the samples in the or iginal SMIC-HS/subHS da-
taset suffer from apparent noises in the recordin g so
that the face sequences actually includes redunda nt
and noisy information.
The confusion matrix of recognition accuracy
of super-resolution reconstructed ima ge sequenc es is
shown in Figure 10. We exhibit the recognition accu-
racy of image sequences with 12 8 × 128, S64 , S32,
and S16 according to different datasets. From Figure
10, it is found that the confusion matrix of our propo-
sed framework is more concentrated on the d iagonal
than Figu re 9. Particularly in the 16 ×16 at the SMIC-
HS dataset (bottom left), the recognition accuracy o n
POSITIVE has significantly improved. Additionally,
we can see from the results of SMIC-subHS dataset
(the second column ) that the proportion of NEGA-
VISAPP 2019 - 14th International Conference on Computer Vision Theory and Applications
432
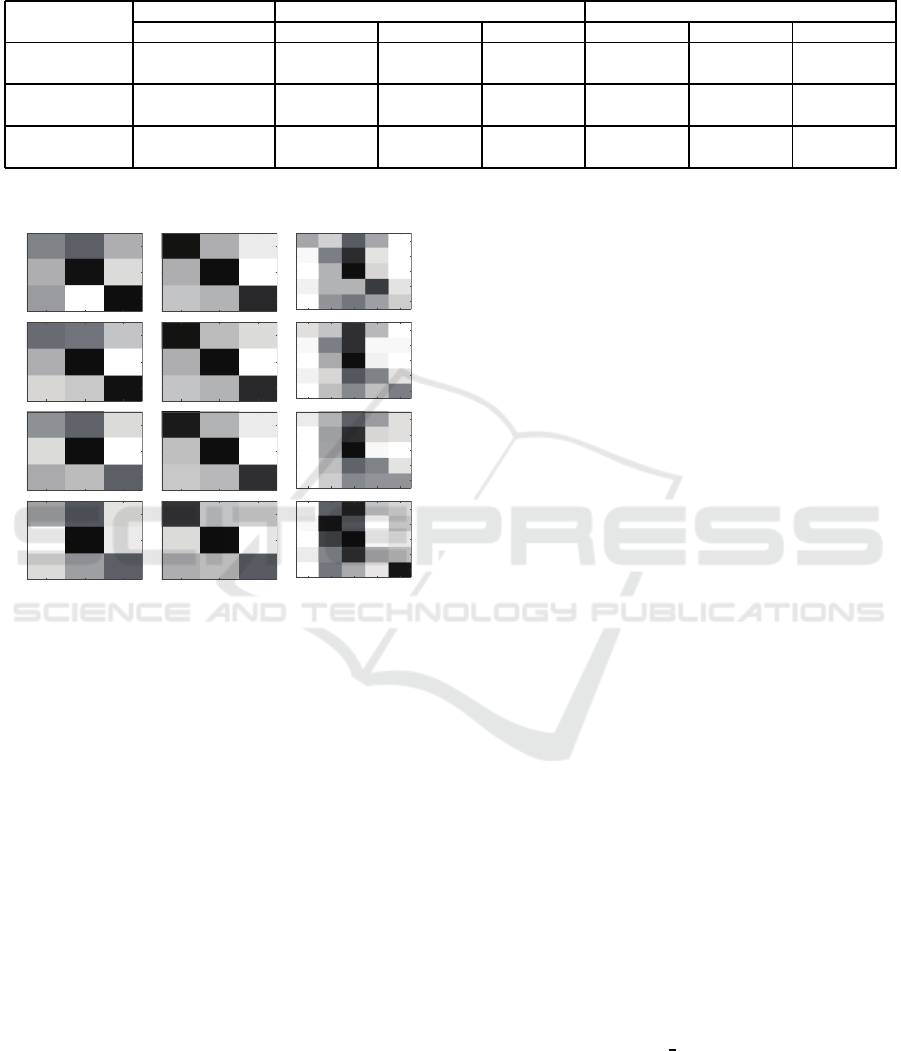
Table 4: Comparison of recognition accuracy of different resolution images on different datasets. High-resolution means
the image sequences with the resolution of 128 × 128. Super-resolution Reconstruction represents the low-resolution image
sequences are reconstructed to the 128 × 128 by t he facial hallucination method. Low-resolution denotes the low-resolution
image sequence before reconstruction. X × Y ×T expresses the number of horizontal, vertical and temporal cuboids.
Accuracy (%)
High-resolution Su per-resolution Reconstruction Low-resolution
128 × 128 64 ×64 32 ×32 16 × 16 64 × 64 32 × 32 16 × 16
SMIC-HS
50.00
(8 ×8 × 2)
52.44
(5 ×5 × 2)
51.83
(5 ×5 × 2)
51.83
(5 ×5 × 2)
50.00
(6 ×6 × 5)
46.95
(6 ×6 × 5)
40.24
(3 ×3 × 6)
SMIC-subHS
73.24
(5 ×5 × 2)
74.65
(5 ×5 × 2)
74.65
(5 ×5 × 2)
73.24
(8 ×8 × 3)
71.83
(6 ×6 × 2)
54.93
(6 ×6 × 2)
46.48
(4 ×4 × 1)
CASME II
48.18
(7 ×7 × 3)
48.18
(7 ×7 × 5)
44.53
(7 ×7 × 3)
42.92
(7 ×7 × 5)
44.94
(7 ×7 × 1)
44.13
(4 ×4 × 2)
41.30
(2 ×2 × 5)
濉濇灤濉濇
濆濅灤濆濅
濄濉灤濄濉
濛濥 濦濥 濟濥
34.29
23.53
27.91
41.43
60.78
9.30
24.29
15.69
62.79
N
P
S
N
P
S
73.91
21.43
15.00
21.74
78.57
20.00
4.35
0.00
65.00
N
P
S
N
P
S
22.22
1.56
1.01
3.13
0.00
11.11
34.38
18.18
18.75
28.00
44.44
57.81
71.72
18.75
36.00
22.22
6.25
9.09
53.13
24.00
0.00
0.00
0.00
6.25
12.00
R
D
O
H
S
R
D
O
H
S
40.00
25.49
18.60
38.57
62.75
20.93
21.43
11.76
60.47
N
P
S
N
P
S
78.26
21.43
15.00
17.39
78.57
20.00
4.35
0.00
65.00
N
P
S
N
P
S
7.41
1.56
0.00
3.13
0.00
14.81
35.94
21.21
9.38
16.00
59.26
59.38
74.75
46.88
32.00
18.52
1.56
3.03
34.38
16.00
0.00
1.56
1.01
6.25
36.00
R
D
O
H
S
R D
O
H
S
35.71
15.69
27.91
48.57
76.47
23.26
15.71
7.84
48.84
1
3
6
1
3
6
73.91
17.86
15.00
21.74
82.14
20.00
4.35
0.00
65.00
N
P
S
N
P
S
3.70
0.00
0.00
0.00
0.00
18.52
25.00
23.23
15.63
12.00
44.44
57.81
73.74
43.75
32.00
25.93
9.38
2.02
34.38
28.00
7.41
7.81
1.01
6.25
28.00
R
D
O
H
S
R
D
O
H
S
31.43
7.84
16.28
54.29
80.39
32.56
14.29
11.76
51.16
N
P
S
N
P
S
69.57
10.71
25.00
17.39
89.29
20.00
13.04
0.00
55.00
N
P
S
N
P
S
0.00
1.56
0.00
3.13
0.00
33.33
51.56
39.39
25.00
28.00
48.15
35.94
55.56
43.75
16.00
11.11
0.00
1.01
15.63
4.00
7.41
10.94
4.04
12.50
52.00
R
D
O
H
S
R
D
O
H
S
Figure 10: Confusion matrix of recognition accuracy of
super-resolution reconstructed image sequences. In the ho-
rizontal direction, Left: SMIC-HS, Middle: SMIC-subHS,
Right: CASME II. In the vertical direction, from top to
bottom, there are 128 × 128, S64, S32, and S16, respecti-
vely.
TIVE misclassified into POSI TIVE are significantly
reduced, while the proportion of POSITIVE correctly
classified are also substantially improved. Unfortuna-
tely, even though the results of the CASME II data-
set (the third column) have improved, the classifica-
tion of each category is still very p oor, and they are
generally falsely classified into OTHERS. Perhaps it
is because OTHERS includes all the other types of
micro-expr essions excluding surprise, happiness, dis-
gust, and repression, so it ha s mixed categories. In
summary, fro m the comparison between Figure 10
and Figure 9 , we see that the proposed framework can
obtain very promising performance boosting for low-
resolution micro-expression recogn ition.
4 CONCLUSIONS
In this paper, we give a comprehensive study ab out
the task of low-resolution micro-expression recogni-
tion problem. We use blurring and downsampling
model to produc e and simulate the low-resolution
micro-expr ession facial image sequences. We recon-
struct the high-qua lity facial im a ge sequ ences by em-
ploying facial hallucination method on each frame,
which enhances the local details and am plifies the
low-quality image sequences to the high resolution
ones. Then, we utilize fast LBP-TOP to extract the
dynamic features and recognize the micro-expression
by SVM classifier. Th e experimental results illustrate
that the prop osed framework performs well on pu-
blicly available micro-expression datasets (SMIC-HS,
SMIC-subHS, an d CASME II) on the low-resolution
micro-expr ession recognition problem. In the fu-
ture, we will focus on the research of deep fea-
tures for micro-expression reco gnition under low-
resolution ca ses.
ACKNOWLEDGEMENTS
G. Li is visiting the University of Oulu when the ma-
nuscript is completed. His visit is supported by the
Graduate Academic Visiting Program of Northwest
University and University of Oulu. J. Shi and G.
Zhao have been supported by Academy of Finland,
Tekes Fidipro Program (1849/31/2 015), Tekes Project
(3116/31/2017), Infotech, N ational Natural Science
Foundation of China (61772419) and Tekn iikan Edis-
tamissaatio Foundation. J. Peng has been suppor-
ted by Changjiang Scholars and In novation Research
Team in University (IRT
17R87), Nation al Key R&D
Program of China (2017YFB1402103), National Na-
ture Science Foundation of China (41427804) and
Shaanxi provincial Key R&D Program (2017ZDXM-
G-20-1).
The aster isk indicates corresponding author.
Micro-expression Recognition Under Low-resolution Cases
433

REFERENCES
Chang, C.- C. and Lin, C. - J. (2011). Libsvm: a library for
support vector machines. In ACM transactions on in-
telligent systems and t echnology (TIST). ACM.
Cootes, T. F., Taylor, C. J., Cooper, D. H., and Graham, J.
(1995). Active shape models-their training and appli-
cation. In Computer vision and image understanding.
Elsevier.
Goshtasby, A. (1988). Image registration by local approx-
imation methods. In Image and Vision Computing.
Elsevier.
He, J., Hu, J.-F., Lu, X., and Zheng, W.-S. (2017). Multi-
task mid-level feature learning for micro-expression
recognition. I n Pattern Recognition. Elsevier.
Hong, X., Xu, Y., and Zhao, G. (2016). Lbp-top: a tensor
unfolding revisit. In Asian Conference on Computer
Vision. Springer.
Le Ngo, A. C., Phan, R. C.-W., and See, J. (2014). Sponta-
neous subtle expression recognition: Imbalanced da-
tabases and solutions. In Asian conference on compu-
ter vision. Springer.
Lei, Z., Ahonen, T., Pietik¨ainen, M., and Li, S. Z. (2011).
Local frequency descriptor for low-resolution face re-
cognition. In Automatic Face & Gesture Recognition
and Workshops (FG 2011), 2011 IEEE International
Conference on. IEEE.
Li, X., Pfister, T., Huang, X., Zhao, G., and Pietik¨ainen, M.
(2013). A spontaneous micro-expression database: In-
ducement, collection and baseline. In Automatic face
and gesture recognition (fg), 2013 10th ieee internati-
onal conference and workshops on. IEEE.
Li, X., Xiaopeng, H., Moilanen, A., Huang, X., Pfister, T.,
Zhao, G., and Pietik¨ainen, M. (2017). Towards rea-
ding hidden emotions: A comparative study of sponta-
neous mi cro-expression spotting and recognition met-
hods. In IEEE Transactions on Affective Computing.
IEEE.
Liong, S.-T., See, J., Phan, R. C.- W., Le Ngo, A. C., Oh,
Y.-H., and Wong, K. (2014). Subtle expression recog-
nition using optical strain weighted features. In Asian
conference on computer vision. Springer.
Liu, Y.-J., Zhang, J.-K., Yan, W.-J., Wang, S.-J., Zhao, G.,
and Fu, X. (2016). A main directional mean optical
flow feature for spontaneous micro-expression recog-
nition. In IEEE Transactions on Affective Computing.
IEEE.
Lu, Z., Luo, Z., Zheng, H., Chen, J., and Li, W. (2014).
A delaunay-based temporal coding model for micro-
expression recognition. In Asian conference on com-
puter vision. Springer.
Oh, Y.-H., Le Ngo, A. C., See, J., Liong, S.-T., Phan, R.
C.-W., and Ling, H.-C. (2015). Monogenic riesz wa-
velet representation for micro-expression recognition.
In Digital Signal Processing (DSP), 2015 IEEE Inter-
national Conference on. IEEE.
Patel, D., Hong, X., and Zhao, G. (2016). Selective deep
features for micro-expression recognition. In Pattern
Recognition (ICPR), 2016 23rd International Confe-
rence on. IEEE.
Pfister, T., Li, X., Zhao, G., and Pietik¨ainen, M. (2011). Re-
cognising spontaneous facial micro-expressions. In
Computer Vision (ICCV ) , 2011 IEEE International
Conference on. IE EE.
Ruiz-Hernandez, J. A. and P ietik¨ainen, M. (2013). Enco-
ding local binary patterns using the re-parametrization
of the second order gaussian jet. In Automatic Face
and Gesture Recognition (FG), 2013 10th IEEE Inter-
national Conference and Workshops on. IEEE.
Shi, J., Liu, X., Zong, Y., Qi, C., and Zhao, G. (2018).
Hallucinating face image by regularization models in
high-resolution feature space. In IEEE Transactions
on Image Processing. IEEE.
Wang, S.-J., Yan, W.-J., Li, X., Zhao, G., and Fu, X.
(2014a). Micro-expression recognition using dyna-
mic textures on tensor independent color space. In
2014 22nd International C onference on Pattern Re-
cognition (ICPR) . IEEE.
Wang, S.-J., Yan, W.-J. , Zhao, G., Fu, X., and Zhou, C.-G.
(2014b). Micro-expression recognition using robust
principal component analysis and local spatiotempo-
ral directional features. In Workshop at the European
conference on computer vision. Springer.
Wang, Y., See, J., Phan, R. C.-W., and Oh, Y.-H. (2014c).
Lbp with six intersection points: Reducing redundant
information in lbp-top for micro-expression recogni-
tion. In Asian Conference on Computer Vision. Sprin-
ger.
Wang, Y., See, J., Phan, R. C.-W., and Oh, Y.-H. (2015). Ef-
ficient spatio-temporal local binary patterns for spon-
taneous facial micro-expression recognition. In PloS
one. Public Library of Science.
Wang, Z., Miao, Z., Wu, Q. J., Wan, Y., and Tang, Z.
(2014d). Low-resolution face recognition: a review.
In The Visual Computer. Springer.
Xu, F., Zhang, J., and Wang, J. Z. (2017). Microexpression
identification and categorization using a facial dyna-
mics map. In IEEE Transactions on Affective Compu-
ting. IEEE.
Yan, W.-J., Li, X., Wang, S.-J., Zhao, G., Liu, Y.-J., Chen,
Y.-H., and Fu, X. (2014). Casme ii: An impro-
ved spontaneous micro-expression database and the
baseline evaluation. In PloS one. Public L ibrary of
Science.
Zhao, G. and Pietik¨ainen, M. (2007). Dynamic texture re-
cognition using local binary patterns with an applica-
tion to facial expressions. In IEEE transactions on
pattern analysis and machine intelligence. I EEE.
Zhou, Z., Zhao, G., and Pietik¨ainen, M. (2011). Towards a
practical lipreading system. In Computer Vision and
Pattern Recognition (CVPR), 2011 IEEE Conference
on. IEEE.
VISAPP 2019 - 14th International Conference on Computer Vision Theory and Applications
434
