
Amplitude Vibration Measurement by Harmonic Frequency Analysis
of a Distributed Acoustic Sensor
Javier Preciado
1,3
, David Sanahuja
1
, Carlos Heras
1
, Jesús Subías
2
, Lucía Hidalgo
1
, Iñigo Salinas
1
,
Pascual Sevillano
3
, Juan José Martínez
3
and Asier Villafranca
3
1
Departamento de Ingeniería Electrónica y Comunicaciones, EINA, Universidad de Zaragoza, C/María de Luna 1, 50018
Zaragoza, Spain
2
Departamento de Física Aplicada, Ciencias, Universidad de Zaragoza, C/María de Luna 1, 50018 Zaragoza, Spain
3
Aragón Photonics Labs (APL), Prado 5, 50009 Zaragoza, Spain
{p.sevillano, jj.martinez, a.villafranca}@aragonphotonics.com
Keywords: Distributed Acoustic Sensor, Distributed Fiber Sensing, Accelerometer Sensor, Calibration.
Abstract: Distributed acoustic sensors (DAS) based in coherent optical time-domain reflectometry (C-OTDR) provide
a cost-effective solution for intrusion monitoring of large civil infrastructures like pipelines, railways or
motorways. Although detection of events is well demonstrated, an estimation of the amplitude of these events
is difficult to achieve. We propose a new method to recover the amplitude of the vibration from the
conventional C-OTDR backscattered power traces. It is based on the FFT analysis of the DAS signals. Using
a discrete accelerometer as a reference, we have calibrated the response of an optical fiber DAS using known
stimuli. A correlation between the amplitude of the vibration and the ratios of the amplitudes of harmonics to
the fundamental of the DAS signals is demonstrated. This analysis overcomes the main issues of the amplitude
measurement, related to the interaction between the stimulus and the interference pattern.
1 INTRODUCTION
Distributed acoustic sensing (DAS) optical fiber
systems based on coherent optical time-domain
reflectometry (C-OTDR) are currently used for the
detection of events (vibrations) along large
infrastructures for intrusion monitoring and
surveillance purposes (J. Park, 2003), (R. Sifta,
2015), (Y. Lu, 2010).
These systems use the optical fiber as a distributed
sensor, detecting variations in the interference of the
backscattered signal. These variations are generated
by shifts in the phase of the propagating pulse due to
external disturbances.
One of the issues with this technique is the
saturation of the phenomenon due to the nature of the
interference. As the magnitude of the event increases,
so do the phase shift and the amplitude of the
interference. However, when the phase shift reaches
a given point the periodic nature of the interference
phenomenon shows, and the amplitude of the
detected signal does not show a linear variation with
the applied disturbances. The direct C-OTDR
backscattered power analysis results in a non-linear
response of the traces with the input stimulus.
Therefore, true vibrations amplitudes cannot be
directly measured (H. F. Martins, 2014).
To overcome this restriction, C-OTDR
backscattered phase analysis can be used (G. Tu,
2015), (Z. Pan, 2011). By measuring the phase of the
C-OTDR signal and using unwrapping phase
methods to recover phase shifts over 2π, the dynamic
measurement of strains has been demonstrated. Other
authors use chirped pulses to measure strain and
temperature values along an optical fiber (J. Pastor-
Graells, 2016). In those cases however, systems are
more complex and long term-stability is not
sometimes clearly addressed.
This work proposes a new method to recover the
amplitude of the vibrations from the C-OTDR
backscattered power traces. It is based on the FFT
analysis of consecutive traces and on the relation
existing between the ratios of the amplitudes of the
different harmonics and the amplitude of the
vibration. The experimental setup used to validate the
method is presented. It includes a C-OTDR with
random polarization rotation between consecutive
46
Preciado, J., Sanahuja, D., Heras, C., Subías, J., Hidalgo, L., Salinas, I., Sevillano, P., Martínez, J. and Villafranca, A.
Amplitude Vibration Measurement by Harmonic Frequency Analysis of a Distributed Acoustic Sensor.
DOI: 10.5220/0007373700460051
In Proceedings of the 7th International Conference on Photonics, Optics and Laser Technology (PHOTOPTICS 2019), pages 46-51
ISBN: 978-989-758-364-3
Copyright
c
2019 by SCITEPRESS – Science and Technology Publications, Lda. All rights reserved
trains of optical pulses to achieve a statistical study of
the interference. The stimulus was a vibration
generator with 50 meters of fiber length strapped
around it. Different frequencies and amplitudes were
tested and discrete accelerometers included for
reference and calibration purpose. The results open
the way to overcome the non-linear response of a
conventional C-OTDR and to provide amplitude
vibration analysis in DAS systems.
2 DAS GENERAL CONCEPTS
Figure 1 shows the basic scheme of a DAS system
based on direct C-OTDR backscattered power
analysis. A pulsed high-coherence laser is amplified
and injected into the sensing fiber. The optical power
backscattered by the fiber produces a pattern of
interferences due to the coherent sum of the M
wavefronts generated by Rayleigh diffusion along the
pulse width at each point k of the fiber. This pattern
is a function of the phase Ω
i
and amplitude a
i
of the
different wavefronts, according to expression (1),
(1)
This backscattered signal is amplified and filtered
to improve the signal-to-noise ratio prior to the
optical detection. The electrical signal coming from
the detector is then sampled and processed.
Figure 1: DAS scheme (direct).
If the phase of the backscattering produced by the
light pulse does not change, the interference of the
backscattered signals remains constant. However,
any mechanical disturbance affects, via the stress-
optic fiber coefficient, the phase of this signal and the
resulting interference. Thus, the optical fiber becomes
a distributed sensor that detects and locates pressure
changes nearby.
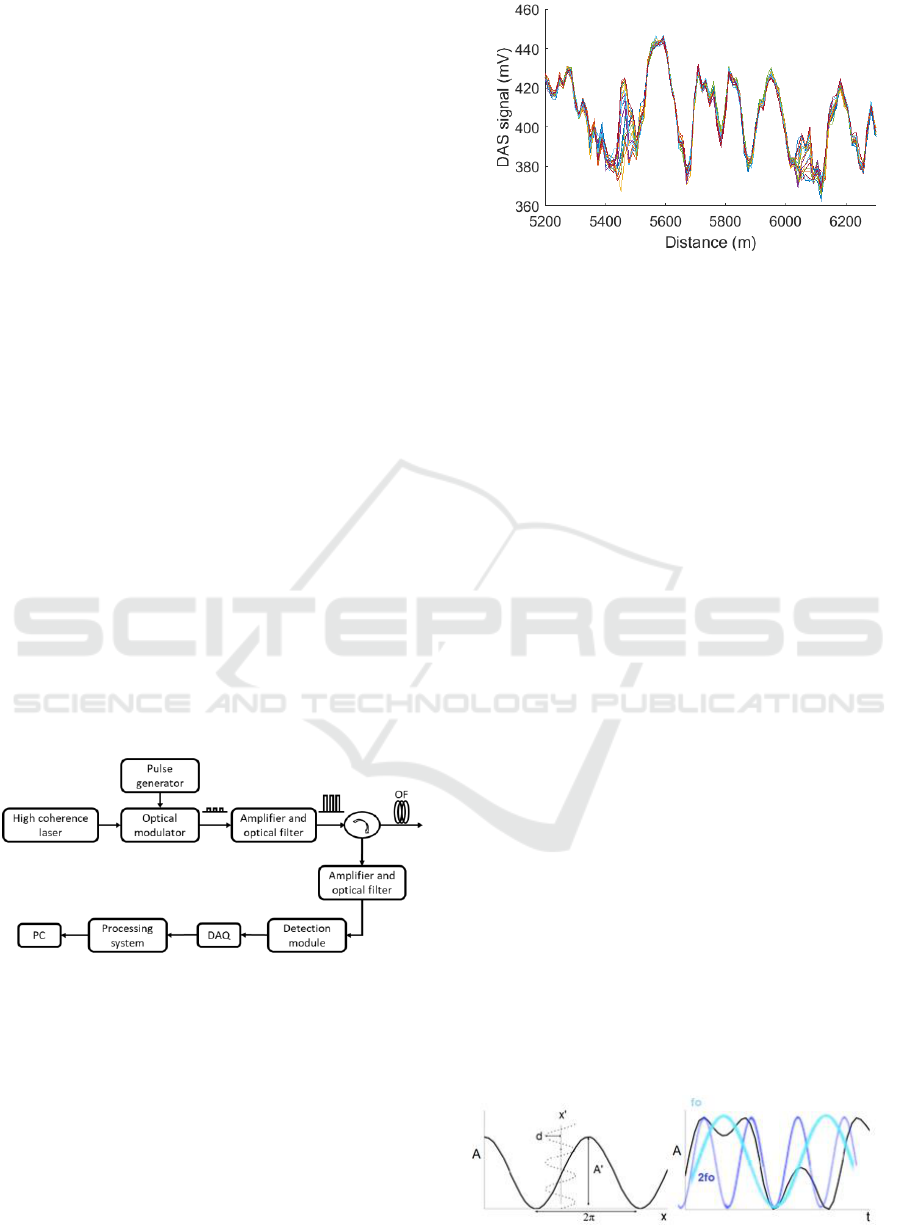
As an example of the measured DAS signals,
Figure 2 represents 21 consecutive acquired traces
Figure 2: DAS signal.
with a constant stimulus at 5470 and 6070 meters. It
is clearly seen that those points show much larger
variability compared with the rest of the trace.
3 NON-LINEAR RESPONSE OF
C-OTDR TRACES
The intensity resulting from the interference of
several wavefronts depends on the phase
relationships between them. These variations will
always be within the range allowed by the destructive
(minimum) and constructive (maximum) interference
conditions.
In the case of a C-OTDR, when an external
disturbance changes the relative phases of some of the
components of the backscattered pulse, the intensity
of the detected signal also varies. As the amplitude of
the disturbance is greater, the induced phase variation
is also greater. Since there is a maximum of the
interference amplitude, there is a saturation
phenomenon in the intensity variation of the C-OTDR
trace. Once this saturation point has been reached, the
amplitude increases of the external disturbance are
not reflected as increases in the intensity variation
detected in the DAS.
Figure 3 shows a simplified model of this
phenomenon, with only two wavefronts interfering
and a sinusoidal mechanical stimulus of frequency f
0
.
For small induced phase changes, variations of the
traces are linear with the magnitude of the stimulus
(same frequency and proportional amplitude).
However, when there is a large phase shift, the
Figure 3: Interference pattern.
Amplitude Vibration Measurement by Harmonic Frequency Analysis of a Distributed Acoustic Sensor
47
amplitude of the DAS signal cannot exceed its
maximum value, A', non-linear response is given and
harmonics of the fundamental frequency appear. The
ratio of the amplitudes of these harmonics and the
fundamental is related to the amplitude of the
stimulus (M. Abramovitz, 1972).
Obviously in the case of a C-OTDR pulse, there is
a large number of interfering wavefronts and it is not
possible to obtain a simple analytical relation.
Therefore, it is necessary to perform a large set of
measurements under different intra-pulse interference
conditions to determine experimentally these
relations for DAS systems.
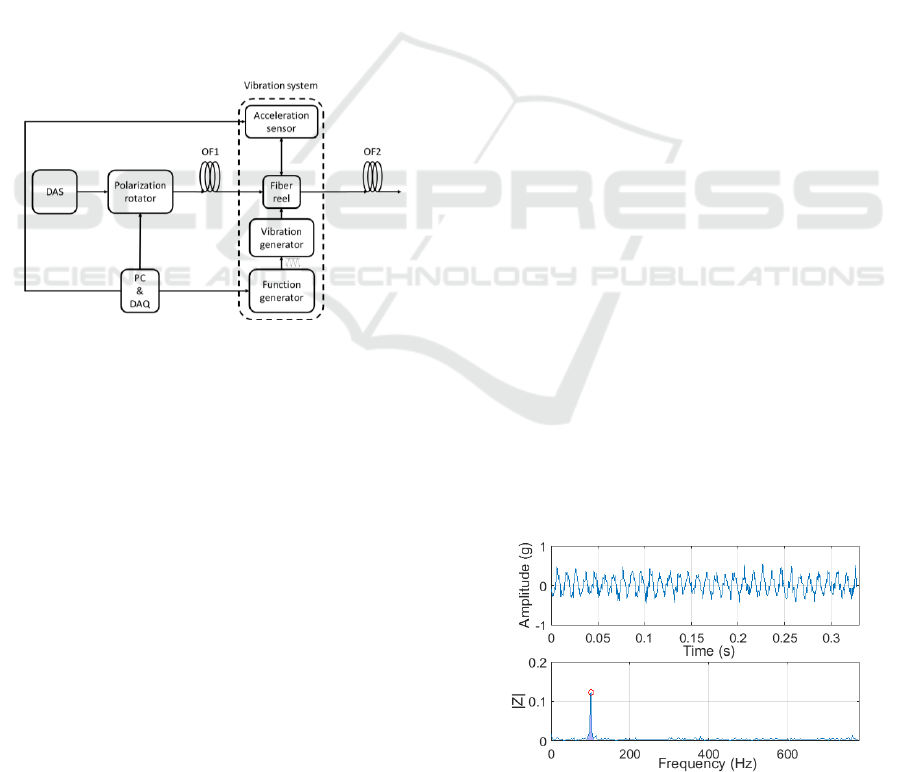
4 EXPERIMENTAL SET-UP
The experimental setup to determine the relationship
between the stimulus amplitude and the amplitudes of
the DAS signals (fundamental and harmonics) is
shown in Figure 4.
Figure 4: Basic scheme of the experimental setup.
The DAS system is based on a C-OTDR as
described in Figure 1. The laser pulses are 600 ns long
and are injected into the optical fiber in trains of 5000
pulses with a repetition rate of 1 kHz. In order to
perform a statistical analysis for every possible
interference condition, the polarization state is
changed randomly from a pulse train to the next.
Thus, each different pulse polarization accounts for a
different intra-pulse interference condition at each
point of the fiber. A controlled vibration system is
placed between two single mode fiber reels of 5 km
(OF1) and 40 km (OF2). It consists of a 50-meter-
long fiber reel fixed to the rod of the vibration
generator. A function generator controls the
amplitude and frequency of the vibration. A
commercial three-axis accelerometer (Analog
Devices 16227) is attached on top of the fiber reel.
This accelerometer provides the reference
measurement of the real amplitude of the mechanical
vibrations that are supported by the fiber. It allows the
amplitude response calibration of the DAS system.
Finally, a computer and a LabJack U3-HV data
acquisition card (DAQ) provide control of the
polarization rotator, the vibrator, the accelerometer
and the DAS system.
5 EXPERIMENTAL RESULTS
The signals from the DAS system and the
accelerometer are captured simultaneously. To
establish the relationship between the amplitude of
the vibration and the DAS signals at a given
frequency, an amplitude sweep of the vibrator is
performed. At each point of the sweep there are 50
iterations using random polarizations, and 5000 DAS
traces are captured for an FFT analysis. As an
example, we present tests carried out for an excitation
frequency of 100 Hz. More frequencies have been
proved in the following range, [50, 110] Hz at several
distances as 5 and 10 km, although the results
presented were at 5 km and 100 Hz.
The acceleration measured by the accelerometer
versus the amplitude of the function generator is used
as calibration of the real mechanical vibrations
supported by the fiber. In addition, it assures that no
harmonics of the applied fundamental frequency are
mechanically generated in the vibration setup. Figure
5 shows an example of the signal captured by the
accelerometer for the maximum tension applied by
the function generator in the test, 2 V, and the
corresponding FFT. It shows the 100 Hz fundamental
frequency without evidence of any harmonic. Figure
6 shows the mechanical amplitude displacement
measured in function of the applied tension. The
acceleration has been converted to displacement for a
better understanding of the magnitude of the test
vibrations. The response of the system is clearly
linear, and the curve is used for a direct calibration of
the DAS signal.
Figure 5: Accelerometer signals: time (top) and FFT
(botton).
PHOTOPTICS 2019 - 7th International Conference on Photonics, Optics and Laser Technology
48
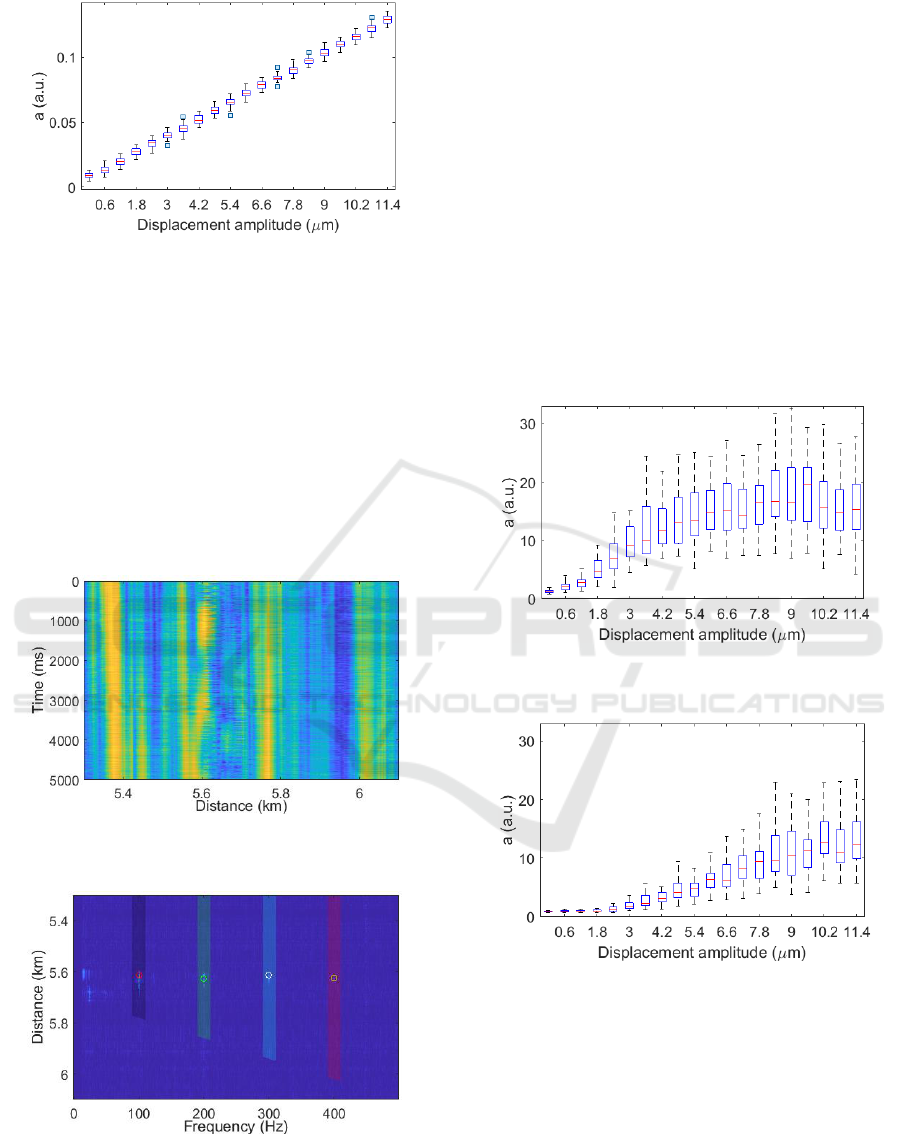
Figure 6: Mechanical amplitude calibration curve of the
vibration setup.
Figure 7 shows a 2D representation of the signal
captured by the DAS system during 5 seconds, with a
constant stimulus of 100 Hz located at 5.6 km. The
trace remains stable within the 5 seconds, except for
the vibration area. When the acquisition is complete,
we search for the stimulus in the frequency domain,
at the excitation frequency and its harmonics (up to
4f
o
). The location in frequency and distance of each
of the harmonics is shown in Figure 8. The search
area is shaded in frequency and a marker (circle) is
placed in the position of the maximum.
Figure 7: Representation of 5 seconds DAS signal around
the 50 m fiber reel.
Figure 8: Location of the fundamental frequency and its
harmonics in the DAS signal at 5,6 km.
The amplitude of the DAS signal at 100 Hz versus
the displacement amplitude of the vibration at the
same frequency is shown in Figure 9. The central
mark indicates the median, and the bottom and top
edges of the box indicate the 25th and 75th
percentiles, respectively, with 50 data points for each
amplitude. For small displacements, the dependence
is approximately linear but, contrary to the results of
the accelerometer in Figure 6, it soon reaches a
saturation level due to the non-linear response of the
DAS signal, as predicted in section 3.
The signal missing from the 100 Hz tone is
distributed between its harmonics, as shown in
Figures 9-12. These harmonics are not generated by
the vibrating structure but by the saturation effect of
the DAS, as evidenced by the frequency response of
the accelerometer in Figure 5.
Figure 9: DAS signal at the fundamental frequency f
0
=100
Hz.
Figure 10: DAS signal at the first harmonic of the excitation
frequency (f
1
=200 Hz).
These graphs represent the non-linear dependence
of the DAS signal with the displacement amplitude of
the vibrations, and can be used to estimate the real
magnitude of unknown excitations despite the
saturation effect. Figure 13 shows the calibration
curves obtained from these measurements. It shows,
in function of the vibration amplitude, the normalized
variation of the fundamental to its maximum and the
ratio of harmonics to the fundamental. From this
Amplitude Vibration Measurement by Harmonic Frequency Analysis of a Distributed Acoustic Sensor
49
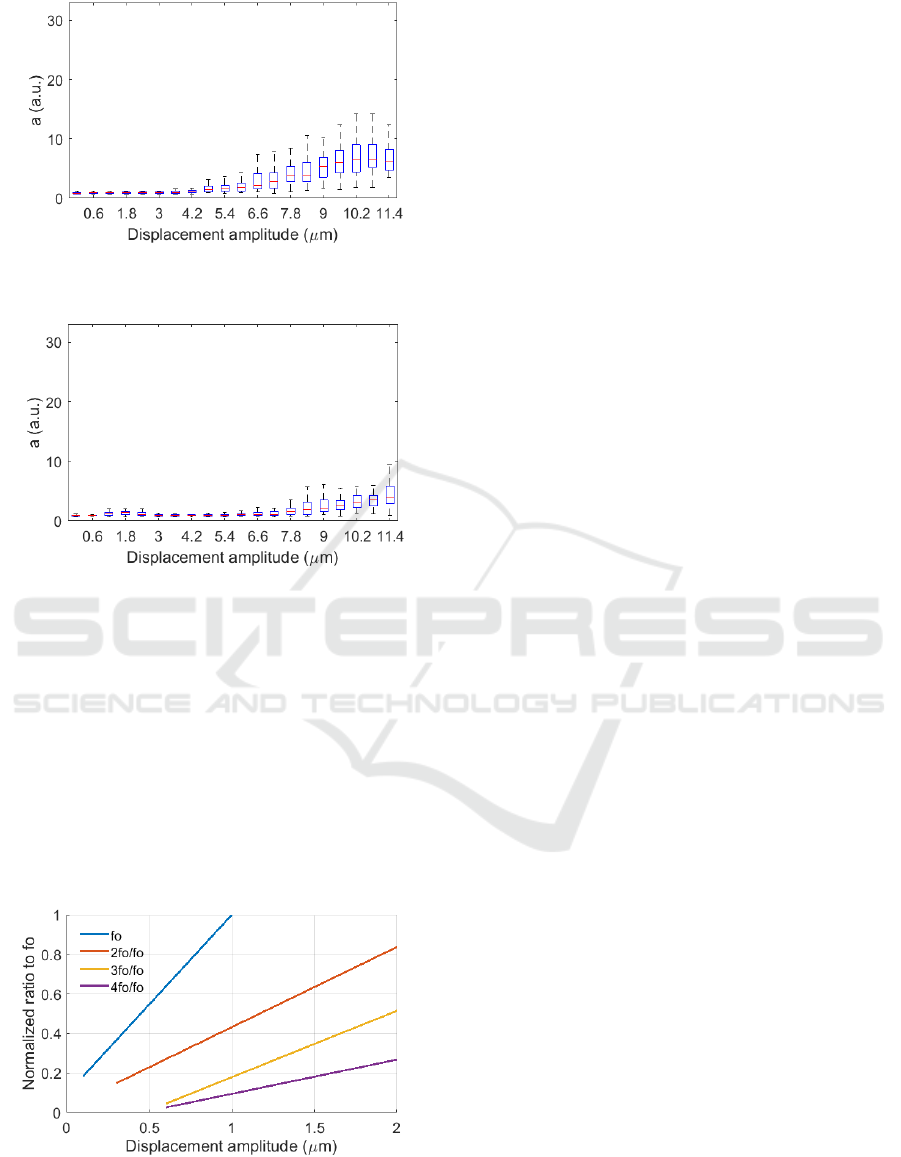
Figure 11: DAS signal at the second harmonic of the
excitation frequency (f
2
=300 Hz).
Figure 12: DAS signal at the third harmonic of the
excitation frequency (f
3
=400 Hz).
Figure 13, given a stimulus of unknown amplitude,
after FFT analysis of the C-OTDR traces, the
harmonic to fundamental amplitude ratios will allow
the estimation of the magnitude of the excitation.
The distribution of the measured values for a
given vibration condition accounts for the statistical
behavior of the interference phenomenon. Thus, it is
clear that the accuracy of the method is strongly
related to the use of random polarization states for the
launched pulses, in order to ensure a large enough
sample.
Figure 13: Calibration curves of the non-linear behavior of
DAS signals.
6 CONCLUSIONS
A new method to recover the magnitude of the
stimulus from DAS signals has been described. It is
based on the FFT analysis of C-OTDR traces using
random polarization states in consecutive trains of
pulses and on the relation existing between the
magnitude of the vibration and the ratios of the
amplitudes of the harmonics to the amplitude of the
fundamental tone.
The experimental setup used to validate the
method has also been presented. It uses discrete
accelerometers for reference and calibration. The
results demonstrate the viability of the method, which
overcomes some of the issues in the magnitude
measurement. It opens the way to work through the
non-linear response of conventional C-OTDR to
provide not only detection of events in DAS systems,
but also vibration amplitude analysis.
ACKNOWLEDGEMENTS
This work was supported in part by the Spanish
“Agencia de Investigación Estatal" through
“Doctorados Industriales” grant DI-17-09169 and
“Retos-Colaboración” grant RTC-2016-5212-8.
REFERENCES
Jaehee Park and Henry F. Taylor (2003) ‘Fiber Optic
Intrusion Sensor using Coherent Optical Time Domain
Reflectometer’, Jpn. J. Appl. Phys. 42.
Radim Sifta, Petr Munster, Petr Sysel, Tomas Horvath, Vit
Novotny, Ondrej Krajsa, Miloslav Filka (2015)
‘Distributed fiber-optic sensor for detection and
localization of acoustic vibrations’, Metrology and
Measurement Systems. 22.
Yuelan Lu, Tao Zhu, Member, IEEE, Liang Chen, and
Xiaoyi Bao (2010) ‘Distributed Vibration Sensor Based
on Coherent Detection of Phase-OTDR’, J. Lightwave
Technol. 28(22).
H. F. Martins, S. Martin-Lopez, P. Corredera, M. L.
Filograno, O. Frazão, and M. Gonzalez-Herraez (2014)
‘Phase-sensitive optical time domain reflectometer
assisted by first-order Raman amplification for
distributed vibration sensing over >100km’, J.
Lightwave Technol. 32(8), pp. 1510–1518.
Guojie Tu, Xuping Zhang, Member, IEEE, Yixin Zhang,
Fan Zhu, Lan Xia, and Bikash Nakarmi (2015) ‘The
Development of an �-OTDR System for Quantitative
Vibration Measurement’.
Zhengqing Pan, Kezhen Liang, Qing Ye, Haiwen Cai,
Ronghui Qu, Zujie Fang (2011) ‘Phase-sensitive OTDR
system based on digital coherent detection’.
PHOTOPTICS 2019 - 7th International Conference on Photonics, Optics and Laser Technology
50

J. Pastor-Graells, H.F. Martins, A. García Ruiz, S. Martin-
Lopez, M.Gonzalez-Herraez (2016) ‘Single-shot
distributed temperature and strain tracking using direct
detection phase-sensitive OTDR with chirped pulses’,
OPTICS EXPRESS.
M. Abramovitz, I. A. Stegun (1972) ‘Handbook of
mathematical functions’. 9.1.42 and 9.1.43. Dover
Publications.
Amplitude Vibration Measurement by Harmonic Frequency Analysis of a Distributed Acoustic Sensor
51
